Credit Growth in Indian Banking System: Green-shoots or Early Blips?
Partha Ray Download ArticleIn an environment dominated by headlines on RBI-government difference of opinion and resignation of the erstwhile RBI Governor Urjit Patel, the recently released Financial Stability Report (December 2018) of the RBI seemed to have attracted less attention. But the report (RBI, 2018) offers a wealth of information and analytics on the Indian financial system at the time when the environment was marked by complaints on accumulation of non-performing assets, regulatory activism and credit shortage after the IL&FS crisis. This note looks into one specific aspect of the report, namely, credit growth of the Indian commercial banking sector.
Trends in Credit Growth
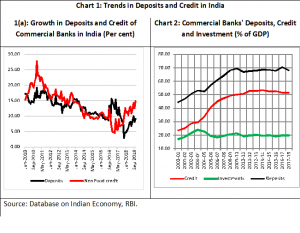
To put the matter in perspective, credit growth in Indian banking system has been rather low in recent times (Chart 1a). Of course, since early 2012 there has been a secular decline in growth of both non-food credit and deposit till end 2016. Because of the deposits inflow arising out of demonetization, during 2017 and 2018, there could have been a disconnect between deposits growth and credit with deposit growth experiencing a spurt during the first half of 2017 and a sharp fall thereafter. In general credit growth continued to fall till about February 2017; it headed for a recovery since then but yet to cross the 15 per cent mark.
The situation is more stark if one considers the major banking aggregates as a percentage of GDP (Chart 1b). Since 2011-12 three major banking aggregates, viz., deposits, credit, and investment have remained almost constant as a percentage of GDP. In particular, bank credit as a percentage of GDP typically hovered around 50 per cent in recent times. In terms of cross-country data from Wold Bank, India’s domestic credit to private sector appears to be quite low among most of the G-20 countries (Table 1).
| Table 1: Domestic credit to private sector in 2016 (As % of GDP)
|
|
| Country Name | Broad Credit-GDP Ratio (%) |
| United States | 192.2 |
| Japan | 161.7 |
| China | 156.8 |
| South Korea | 143.0 |
| Australia | 142.5 |
| United Kingdom | 134.3 |
| France | 97.6 |
| Italy | 85.7 |
| Brazil | 62.3 |
| Russian Federation | 53.4 |
| India | 49.5 |
| Indonesia | 39.4 |
| Argentina | 13.7 |
| Note: Domestic refers to financial resources provided to the private sector by financial corporations, such as through loans, purchases of non-equity securities, and trade credits and other accounts receivable that establish a claim for repayment.
Source: World Bank |
|
Non-Bank Sources of Financing
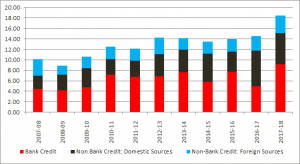
Considering the fact that India’s economy grew at 6 per cent plus since 2011-12, does this lack of credit pose a riddle? How was the growth financed? Interestingly, contrary to the popular belief that the Indian financial system is bank-based, in recent times non-bank sources tended to dominate flow of financial resources to Indian non-financial sector. In fact, faced with a shortage of credit by banks, it seems that a large chunk of credit needs by select sectors were met from non-banking sources of finance – both domestic and foreign sources (Chart 2).
While FDI is the primary sources of foreign flow of resources, What are the domestic non-bank sources of credit? Prominent among these are: i) public issues by non-financial entities; ii) gross private placements by non-financial entities; iii) net issuance of CPs subscribed to by non-banks; iv) net Credit by housing finance companies; v) total gross accommodation by 4 RBI regulated AIFIs (NABARD, NHB, SIDBI & EXIM Bank); vi) systematically important non-deposit taking NBFCs (net of bank credit); and vii) LIC’s net investment in corporate debt, infrastructure and Social Sector. In particular, both gross private placements by non-financial entities and net issuance of commercial papers (CPs) subscribed by non-banks have, in recent times, emerged as major sources of finance.
| Chart 2: Flow of Financial Resources to Commercial Sector (Rs. Trillion) |
 |
| Source: Database on Indian Economy, RBI. |
Did this non-bank sources of financial resources get dried up following the IL&FS (Infrastructure Leasing & Financial Services) crisis, when the IL&FS defaulted on a few payments and failed to service its commercial papers (CP) on due date in September 2018.[1] Two major trends are noticeable in this regard.
First, insofar as the flow of resources from domestic non-bank sources in concerned, the share of net credit by housing finance companies (HFCs) in the total flow of credit (from domestic sources) nearly doubled from 6.2 per cent in 2013-14 to 11.7 per cent in 2017-18 (RBI, 2018).
Second, mutual funds (MF) have played a catalytic role in the reshaping of the non-bank financial intermediation. In fact, the RBI report noted:
“The recent episode in the wake of IL&FS default however underlined certain issues in this market intermediated credit provisioning structure, the narrative on which can be broadly divided into: a) nature of credit intermediation of MFs and the IL&FS incident induced dislocation; b) price impact of MF dislocation with specific focus on money market rates; c) fair value of corporate issuances in banks and MFs; and d) credit concentration in MF portfolios and possible behavioural implications” (RBI, 2018; p. 14).
Recent Trends
Considering the fact that the rise in non-performing assets of the banking sector could have had a significant role in subdued credit growth, the RBI report indicated certain positive pointers. The following are important in particular:
- The asset quality of scheduled commercial banks has showed signs of improvement with gross NPA ratio declining from 11.5 per cent in March 2018 to 10.8 per cent in September 2018.
- The annualised slippage ratio (i.e., fresh accretion of NPAs during the year as a percentage of total standard assets at the beginning of the year) came down from 7.6 per cent to 4.1 per cent in the same period.
- While the stressed assets to advances ratio has started converging to the gross NPA ratio following the withdrawal of various restructuring schemes, sector-wise analysis showed higher stress in mining, food processing and construction sectors.
Furthermore, the RBI report projected that the gross NPA ratio (under the baseline scenario) might decline from 10.8 per cent in September 2018 to 10.3 per cent in March 2019. Concerns however remained as sensitivity analysis indicated that 18 scheduled commercial banks (including all public sector banks under Prompt Corrective Action) may fail to maintain the required CRAR under a 2 standard deviation shock to the gross NPA ratio.
In recent times Indian banking has been occupying headlines mostly due to wrong reasons. Thus, some of these indicators seem to be good news in an otherwise not-so-bright scenario of Indian banking sector. It, however, remains to be seen whether these indicators are genuine green shoots or blips.
*****
[1] According to a Reuters report, by the middle of September, IL&FS and IL&FS Financial Services had a combined Rs 270 billion of debt rated as junk by CARE Ratings and a further six group companies had suffered downgrades with a negative outlook on another Rs 120 billion of borrowings.


