The Many Truths about India’s Long Term Equity Returns
Deep N Mukherjee Download Article
Markets are now at historic highs. On 20th July 2017, Nifty 50 closed at 9873. On 20th July 1990 Nifty 50 had a level of 302, a mind-blowing 32 times growth over a period of 27 years with an annualised return of 13.7%. Prima facie, these numbers clearly create a case for investment in Indian equities. But such headline numbers often sets wrong expectations on risk and return among investors. Besides they also form the basis of various claims which superficially appear to be correct but on deeper analysis appears to be somewhat exaggerated.
Claims by various stake holders in equity market such as brokerage houses and mutual funds looks barely conservative even when the annualised 13.7% is considered. A lot of purveyor of equity products often suggest that over the long term an investor in a portfolio of Indian equities may expect 12% to 15% annualised returns. As such the Nifty 50 was launched for trading on April 1996. The data dating back till 1990 was market data reflecting the index value used for the index creation. From the launch date of Nifty50 the current level suggest an 8.7X growth with annual returns (including dividend) of around 11%. Thus one may say that typical claims of long term returns on Indian equity are possibly exaggerated. It is to be noted that this is a 21 year (and not 27 year) return and hence a bit lower. Such observations dovetail into the popular narrative of compounding of returns and how 27 years being longer than 21 years results in higher returns (even annualised!!). However this explanation is not only simplistic but may be misleading under certain scenarios.
Of course in each of the solicitations and advertisements for investment in equity, as mandated by the market regulator SEBI, the advertiser sensitises the investors that past returns may not reflect the future returns and the returns themselves are subject to market risk. Despite these warning notes, an ordinary investor is made to believe that a)long term returns (5 to 10 years) have been handsome, enough to justify the ‘market risk’ , b)the returns were well above rates of bank deposits or investment in bonds. This understanding of common investors is directly driven by the near constant promotional bombardment with overarching headlines which hides nuances of historical return.
Lot of investment decisions based on over simplistic understanding of past returns of Indian equity markets fails to highlight the market risks associated with such returns thus exposing the investor to possible adverse surprise. One may of course wonder why the various purveyors of equity products, more importantly the market regulator, have not taken enough steps to elucidate the story as opposed to limiting itself with the catch all ‘equity returns are subject to market risk’.
The prospective investor in equity market needs to know that there were long stretches where 5 year returns had been negative and some instances where even 10 year returns on equity index has been negative and would turn barely positive if the dividend is added.
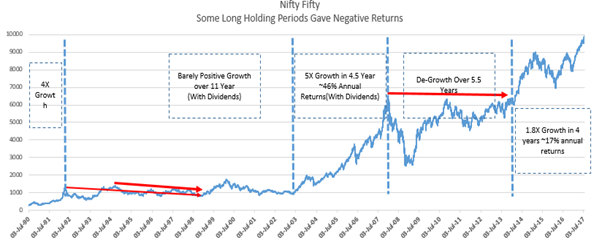
The forgotten subplot of a popular story: From July 1990 till July 2017, one may divide Indian equity markets into 5 phases based on returns. The short two year period between 1990 and 1992 and then again the four and a half year period between July 2003 and January 2008 accounted for bulk of the returns, till date. However, the 11 year period between 1992 and 2003 and then again from January 2008 to August 2013, the long term growth has been largely flat to negative. One may say that since 1991 Indian markets have given flat to negative returns in most of the years. However there were shorter stretches where the returns have gone through the roof.
Representation of Returns: There are two typical ways in which equity returns are calculated for public consumption. One is the way described above where the index values at the start and at the end of a multi-year period are used to find the cumulative returns and then annualised based on number of years in that period using annual compounding assumptions. Mutual funds while highlighting their returns often take returns between specific dates such as 1 January or 1st April as start date and end dates of 31st December or 31 March after one or multiple years. And then of course the annual compounding calculations kick in. The annualised returns thus calculated are used to present the annual return an investor may expect over a longer term holding period. These are of course not incorrect methods in themselves but they do not consider a very practical aspect of investment behaviour.
An investor will invest in any day when the market is open for trading and will likewise sell on any day when the market is open. Under such a scenario it may be argued that if the 1-year, 5 year,10 year(or for that matter any period) returns are calculated on a rolling basis and the median or average returns are taken then it may be more representative of the ‘true’ return. In fact this approach also shows the standard deviation of returns for each of these holding periods. More importantly it easily identifies stretches where the returns were significantly low or negative.
| 1 Year Return | 5 Year Cumulative Return | 10 Year Cumulative Return | |
| Median | 11% | 55% | 240% |
| 10 Percentile | -20% | 2% | 48% |
| 25 Percentile | -6% | 23% | 114% |
| 75 Percentile | 37% | 107% | 345% |
| 90 Percentile | 63% | 212% | 413% |
| Returns do not include dividend, which typically average around 0.5% returns a year | |||
The table suggests that at least one in four years the one year return is negative. However the bright spot has been that in one out of four year (refer 75 percentile) the annual return has been in excess of 37%. Indeed a very volatile market as is the case with most emerging markets. While commentators often highlight that short investment period such as one year gives volatile return and try to assuage that longer holding period gives more stable and higher returns. Now this is correct if one looks at median 5 year and 10 year cumulative returns.
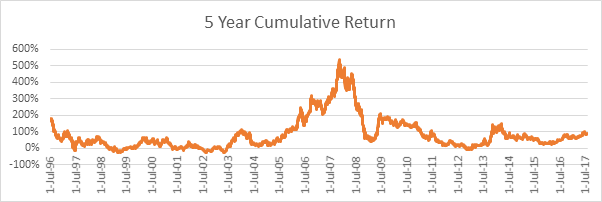
But there are one in 10 instances where the cumulative 5 year return is just 2% and if one includes dividends the cumulative returns of these 5 year holding period is 5%. There are one in four instances where the cumulative 5 year return is just 23%(without dividend). Even considering the dividend there were stretches where for five year holding period the return was barely higher than interest rates on savings deposit of bank.
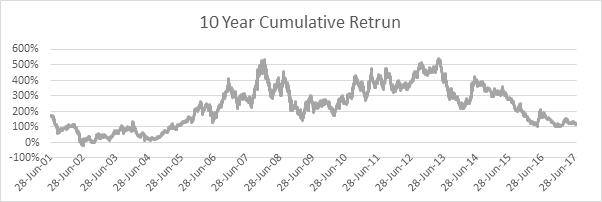
Of course longer term holding period does tend to reduce volatility of returns, but there were 10 year investment holding periods where cumulative returns were less than 48% which is the same return the investor would have received had they kept their money in savings deposit of banks.
The point to note here is the median annual returns for 5 year and 10 year holding period ranges between 9% and 12%. Often an ordinary investor will take this at face value without realising upfront that there can be long stretches where the equity market returns even for longer holding period of 5 years or 10 years barely beat the savings deposit interest and on many instances such returns would be lower than returns of bank fixed deposit or fixed income mutual funds.
SEBI should clarify the communication: SEBI should go beyond the present mandate of informing investors about market risk of equity returns. It will do well to suggest that Mutual Funds should also calculate their return on rolling basis. Besides the investors must be communicated in simple language that while the average returns has been 11% to 12% there were instances where even a 10 year holding period had flat returns and stretches where 5 year returns yielded negative return. This phenomenon can be easily captured in the disclosure requirements for mutual funds by making it mandatory for the funds to report maximum drawdown and days of recovery in addition to historical returns.
Of course investors who invest after knowing these divergences in long term return truly exhibit the appetite for handling equity market risks and will lend to long term stability of the market. Else it is possible that quite a few investors are joining the equity band wagon without the knowledge of negative divergence of past returns. These investors are likely to get disillusioned with the equity markets and switch off from the markets after an initial burst of activity.