Does Monetary Policy influence Stock Market in India? Or, are the claims exaggerated?
Partha Ray Download Article
Monetary policy announcements tend to attract to attract huge media attention. Illustratively, the Economic Times of April 5 2016 observed, “The Reserve Bank of India (RBI) on expected lines slashed repo rates by 25 bps and maintained an accommodative stance. The stock market reacted sharply with the benchmark indices losing close to 1 per cent in a hurry soon after the policy announcement”. There are several reasons for such perceived hype on the impact of monetary policy on the stock market. First, monetary policy announcements are much more frequent than their fiscal counterparts. Second, in standard macroeconomic models monetary policy tend to work through influencing private investment via changes in interest rates or through influencing net exports via changes in exchange rates. Thus, unless it is an abnormal time of a recession, the private players (including financial market participants) are far more comfortable with monetary policy actions. One of the sources of this hype about the monetary policy is perhaps its perceived impact in stock market. How does it happen? The popular perception is captured in Investopedia which commented, “The impact of monetary policy on investments is .. direct as well as indirect … The direct impact is through the level and direction of interest rates, while the indirect effect is through expectations about where inflation is headed”.
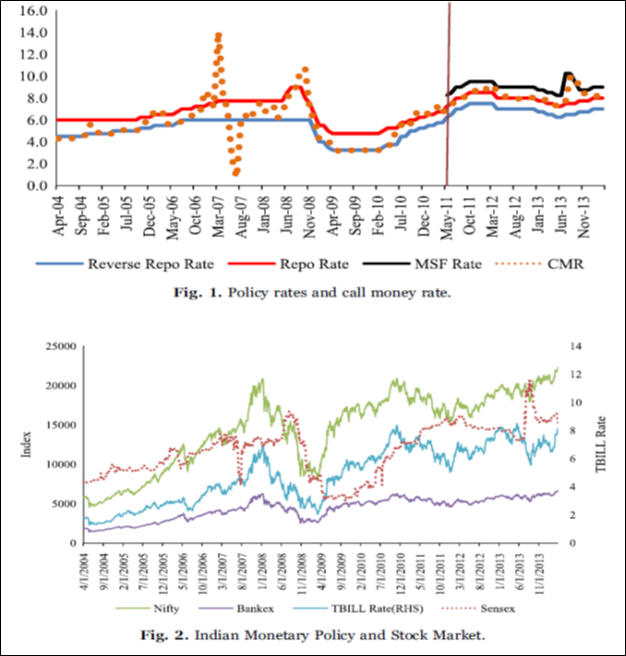
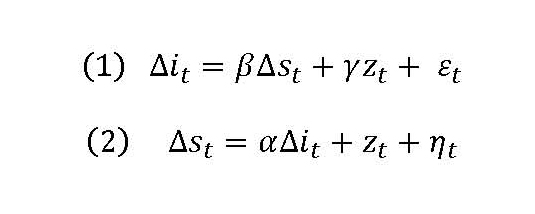
How far are such associations symptomatic in nature? Are the visual effects of the movements in monetary policy rates and the movements in stock price indices unable to decipher the truth (Figures 1 and 2)? Do these claims suffer from the logical fallacy of post hoc ergo propter hoc? Does such association stand rigorous tests? All these questions have huge practical relevance. I, along with two co-researchers, have looked into these questions for India in a recent paper using daily data over the period 2004-2014 and found the answer to be in general negative (with some qualifications).[1] Given this interesting result on lack of relationship between monetary policy and stock market, for the readers of Artha, the present write-up summarizes our findings and tries to make sense of this apparent non-relation between monetary policy and stock market in India.
Methodology
It may be useful to start with a brief digression on methodology. Methodologically, the issue of association between monetary policy and stock market has traditionally been examined either via an event study approach or in a vector autoregression (VAR) framework comprising some monetary policy indicator, stock prices and related variables. While the event study approach looks at the movements in an “effect variable” (in this case, stock prices) in a before-after comparison, of late a new innovative approached have surfaced in. This method, known as, “identification through heteroscedasticity” (IH), uses a key result that, “if the structural shocks have a known correlation (usually 0), the identification problem can be solved by simply appealing to the heteroskedasticity of the structural shocks”.[2] Effectively, it looks at the variance of stock prices on policy days with the variance for non-policy days.[3] In this approach, the total period is divided into two sub samples: (a) policy days (P) and non-policy days (NP). Policy days are those when decisions are announced by the RBI while non-policy day refers to the previous day (over a two-day window). The technical details of the methodology are described in Annex 1.
Monetary Policy Announcements
Monetary policy announcements during the period 2004-2014 can be segregated into: (a) scheduled; and (b) non-scheduled, and (c) within market hours; and (b) after market hours. The relevant frequency is reported in Table 1.
| Table 1: Monetary Policy Announcements
(April 2004 – March 2014) |
|||||
| Policy Dates | Observations | Direction | Observations | Timing | Observations |
| Scheduled | 52 | Tightening | 36 | Within market hours | 58 |
| Non-scheduled | 20 | Easing | 18 | After market hours | 14 |
| No Change | 18 | ||||
| Total | 72 | 72 | 72 | ||
Interestingly, the literature distinguishes between anticipated and unanticipated monetary policy actions. How to use a proxy for unanticipated component of policy announcements? Since unlike the US there is no repo futures market for India, we use the 91-day Treasury bill rate as a proxy for surprise effect of monetary policy actions. After all, anticipated changes in monetary policy actions are already factored in the Treasury bill yields by the market and any change in yield after the policy announcements reflect the unanticipated component of policy decisions.
Empirical Results
Using both scheduled and non-scheduled policy announcements, we have tried to implement both an event study (ES) as well as IH approaches for estimating the impact of monetary policy on the stock market indices (proxied by three indices, Sensex, Nifty and Bankex). We found that that monetary policy have a negative impact on stock Indices but are these are statistically insignificant (Table 2). This finding is in line with observed trends for Germany, Hungary and Poland.
| Table 2: Impact of Monetary Policy on Stock Prices: IV versus ES and GMM Results | ||||||
| IV
coefficients |
ES
coefficients |
Test of ES
versus IV# |
GMM
coefficients |
Over Identification Test (GMM)* | Test of GMM
versus ES |
|
| Sensex | -0.008
(0.59) |
-0.002
(0.83) |
0.324 | -0.008
(0.64) |
0.665 | 0.469 |
| Nifty | -0.006
(0.68) |
-0.002
(0.89) |
0.419 | -0.006
(0.72) |
0.677 | 0.555 |
| Bankex | -0.014
(0.47) |
-0.012
(0.46) |
0.826 | -0.013
(0.54) |
0.741 | 0.878 |
| Note: #: Hausman Test for validity of the underlying assumptions of the event study (ES) estimator tested against instrumental variable (IV) approach. The standard p-values are given in this column.
* : P-value of Hansen’s J chi square value is given in this column. |
||||||
Table 3 reports the results of the impact of non-scheduled policy announcements on stock market from IH and ES. The results indicate that monetary policy has a negative, albeit statistically insignificant impact, for ES and IH using IV method. The Hausman test statistic rejects the null hypothesis at 10% in favour of IH using IV method. In IH method using GMM, we find weakly significant (at 10%) impact of unanticipated monetary policy on the Sensex and Bankex. Expectedly, the impact on Bankex is higher than the Sensex. This is in line with the dominance of the banking system in the monetary transmission mechanism.
| Table 3: Impact of Unannounced Monetary Policy on Stock Prices
: IV versus ES and GMM Results |
||||||
| IV
coefficients |
ES
coefficients |
Test of ES
versus IH # |
GMM
coefficients |
Over Identification Test (GMM)* | Test of GMM
versus ES |
|
| Sensex | -0.08
(0.19) |
-0.022
(0.40) |
0.054 | -0.068*
(0.09) |
0.311 | 0.105 |
| Nifty | -0.078
(0.20) |
-0.020
(0.43) |
0.055 | -0.065
(0.12) |
0.293 | 0.110 |
| Bankex | -0.103
(0.11) |
-0.046
(0.17) |
0.074 | -0.092*
(0.08) |
0.553 | 0.053 |
| Note: #: Hausman Test for validity of the underlying assumptions of the event study (ES) estimator tested against instrumental variable (IV) approach. The standard p-values are given in this column.
* : P-value of Hansen’s J chi square value is given in this column. |
||||||
The results presented above have found to be fairly robust and stood the test of a longer (viz., a three day) data window[4] and alternative measure of unanticipated monetary policy action by MIBOR FIMMDA-NSE Mumbai Inter-bank Offer Rate (MIBOR) for maturity of 3 months as in T-Bills.
Implications
How can we interpret the results of relative insignificance of monetary policy to influence stock prices? Several conjectures may be put forward. First, the small and medium enterprises (SMEs), which constitute the bulwark of the industrial sector, continue to rely solely on bank finance as they have limited access to the stock market. Second, during the period of our study, notwithstanding the impact of global financial crisis, the extent of uncertainty about Indian macroeconomic fundamentals was rather low. After all, with an average growth of above 7% and an inflation of around 6%, the Indian economy showed remarkable resilience amidst the global meltdown. Third, the Indian stock market is quite open and globalized despite a phased and calibrated move towards capital account convertibility. In that sense, domestic monetary policy can have limited influence on FIIs’ investment decisions in India.[5] Fourth, there are limits to banks’ investment in the equity market limiting banks’ exposure to stock market activities.[6] Finally, the role of the stock market in capital formation in the country, both directly and indirectly, continues to be less significant.
Annex 1: Methodology of Identification through Heteroscadascity
Following Rigobon and Sack (2004), the relationship between monetary policy (as captured by a short-term interest rate ) and stock price ) can be described by two simultaneous equations:
Note that Equation (1) is the monetary policy reaction function whereby the changes in the monetary policy or short-term interest rate (it) respond to the stock market index and a set of variables z, where z can be observed or omitted variables. Equation 2, on the contrary, is the asset price equation and models the changes in the stock market indices as a function of changes in the short-term interest rate and the variable z. Monetary policy shocks are and stock market shock is ηt .
The reduced form equations of equation (1) and (2) is given by
The difference in the covariance matrix between the policy day (P) and the non-policy days (NP) then can be shown as:
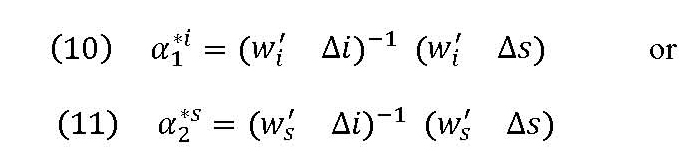
From the above equation (5), we can estimate the desired parameter α using instrumental variables (IV) approach as well as by the generalised-method-of-moments (GMM) method.
First, we group the changes in the two variables in the two subsamples i.e., policy days (P) and non-policy days (NP) into one vector with dimension of 2Tx1, where T is the number of policy days in the subsample. Since the number of observation is same for policy days and non-policy days, by combining them, the total observation becomes 2T. The new vectors Δi and Δs are given by
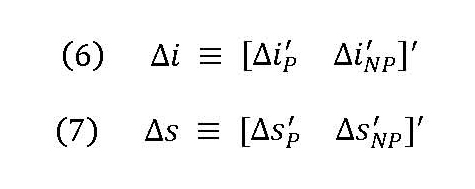
The two instruments for estimating the IV approach (Rigobon and Sack 2004) are
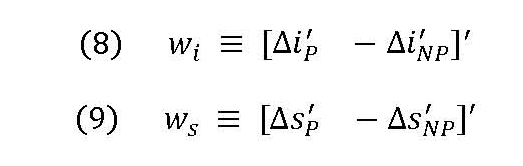
Here, the instrumental variable wi is correlated with the dependent variable but is neither correlated with nor . It is correlated with ∆i because the greater variance in sub-sample P implies the positive correlation between (∆i ′P) and (∆i ′P) of wi which more than outweighs the negative correlation between (∆i ′NP ) and (∆i ′NP ) of wi. It is neither correlated with zt nor ηt because the positive and negative correlation cancels each other out (Foley-Fisher et al 2013).
Given the two instruments, α which measures the impact of monetary policy on the stock market can be estimated by either of the following equations:
[1] Edwin Prabu, Indranil Bhattacharyya, and Partha Ray (2016): “Is the stock market impervious to monetary policy announcements: Evidence from emerging India”, International Review of Economics & Finance, Volume 46, November 2016, Pages 166-179.
[2] Rigobon R (2003): “Identification through heteroscedasticity”. Review of Economics and Statistics, 85(4), 777–792.
[3] Rigobon R, and Sack, B (2004): “The impact of monetary policy on asset prices”, Journal of Monetary Economics, 51:1553-1575.
[4] In our sample, however, there were three occasions when the policy rates have been changed twice within a span of two to three days. Therefore, we were not able to define policy date and non-policy date without the overlapping of dates. Hence, we have excluded the overlapping dates from our sample.
[5] We have also examined the possible influence of unconventional monetary policy in the US on Indian stock market and were unable to arrive any systematic influence. In order to estimate the impact of specific events on stock returns (2 day window), we employed an Event Study methodology using dummy variable for each of the 24 US Fed announcement dates while controlling for surprises in the macroeconomic data releases using Citigroup economic surprise index for the US and the Nomura surprise index for India.
[6] Direct exposure in equities is restricted to 20% of net worth of a bank.