Predicting Corporate Default Using Text
Ashok Banerjee and Sanjeev Kumar* Download Article
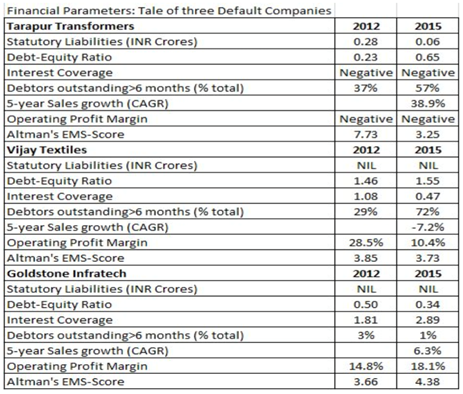
The rising corporate debt and higher default rates have led to a continuous increase in distressed loans in Indian financial system. The situation worsened when stressed asset ratio rose from 7.6 % in March 2012 to 11.5 % in March 2016 and further to 12% in March 2017. As of June 2016, the total amount of Gross Non-Performing Assets (NPA) for public and private sector banks was around Rs. 6 lakh Crore (almost $10 billion). Alarmed by the deteriorating asset quality, the Reserve Bank of India (RBI) in April 2015 had urged all commercial banks to put in place an early warning system to prevent financial fraud. In March 2016, the Securities and Exchange Board of India (SEBI), the Ministry of Corporate Affairs (MCA) and the Institute of Chartered Accountants of India (ICAI) had emphasised the need for developing an early warning system aimed at zeroing in on companies that have taken funds from public and whose balance sheet parameters show that they may renege on repayment. The problem with this approach –generating early warning signals from financial statements- is it may lack predictive power. This would be particularly true for firms which ‘window dress’ their financial numbers to ‘defer’ release of bad news. Lenders typically concentrate largely on financial parameters at the time of loan origination and subsequently track the behaviour of borrowers through financial statements and other financial data furnished by the borrower. However, the information in the financial statements may not reveal the actual state of affairs of a borrower. Take the following example (Table 1). These three companies defaulted in 2015. Their financial health did not show any sign of trouble/irregularity three years (2012) before the year of default. In fact, leverage (debt-equity) of two companies was much less than one. Operating profit margins were in double-digit for two firms. The Altman’s Z-score[1] was much above the comfort zone for all the three companies in 2012. One might point out that the EMS can predict distress one year ahead and not so early. However, even in the year of default (2015), the EMS was above 2.6 for all three companies.
Much of the research has so far explored the relationship between financial distress and historical accounting information. However, the quantitative financial information comprises only approximately 20% of all the information contained in annual reports (Beattie et al. 2004). Therefore to obtain a complete picture of financial health of a company, it is necessary that one uses the qualitative information provided in corporate annual reports. There is of late a growing interest among finance and accounting research community in analysing and quantifying the qualitative information present in annual reports. Loughran, McDonald ( 2011 ) analysed the tone of corporate annual reports (sentiment) and observed that sentiments expressed in annual report text data is significantly correlated with profitability, trading volume, and unexpected earnings for listed companies in USA.
Table 1: Financial Health of Three Companies
Realizing the need for greater scrutiny of annual reports, the RBI[2] instructed banks to undertake a detailed study of the Annual Report, and not concentrate merely on financial statements. At present detection of loan frauds takes an unusually long time, which may delay action against any fraudulent entity causing huge losses to financial institutions. So, early detection of any trouble or distress of borrowers would really help in controlling the menace of non-performing assets. The lenders in India should learn the art of extracting information from large text documents and improve their present rating system by supplementing financial parameters with text-based information. This would make the existing rating system more robust.
We have observed, after manually going through hundreds of annual reports of corporates, firms reveal more in the ‘text’ part of the annual report. Companies, more so the listed ones, become careful while presenting financial statements simply because this section of the annual report is scrutinised most by analysts, investors and lenders. We have developed a proprietary text-based model for estimating default probability of firms and we claim that our model has much better predictive power than Altman’s. Our proposed model is equally effective in case of unlisted firms. Further our text-based model is designed to capture any kind of trouble or uncertainty that a firm faces in addition to default risk.
Words reveal more
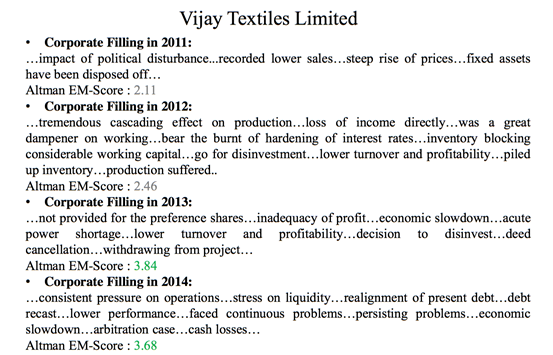
Our model is developed using text present in the annual report of a company. We have only used three sections of an annual report- Directors Report (including Management Discussion and Analysis), Audit Report and Notes to Accounts. It is important to note that annual report (except the audit report) is a self-report of a company and hence such a document is bound to have strong bias. Yet we were amazed by the quality of information that one can extract from such a biased text. Let us take the case of Vijay Textile (mentioned in Table 1). The company reported an operating margin of more than 28% in 2012 with a debt-equity ratio of less than 1.5. Even in the year of default, the debt-equity did not cross 2, though the sales growth was negative. However, if one looks at the annual report of the company over past few years prior to the year of default, one would notice that the company had started facing financial hardships at least four years before 2015 (Table 2). It is interesting to note that the Altman EMS improved over the years whereas the text of annual reports clearly showed that the firm was burdened with huge financial hardship so much so that the company had to dispose of some assets way back in 2011. The firm witnessed inventory pile up and lower profitability in 2012 and the situation did not improve thereafter leading to huge pressure on liquidity in 2014. The material information captured in the text of the annual report, in this example, proves that it makes economic sense to analyse the non-financial information as seriously as one does for financial information. We find that directors report provide most of material information and audit report provided least marginal information.
Magnusson et al. (2005) use self-organizing maps to visualize the changes in the writing style of the annual reports of telecommunication companies. They observed that when a company is expected to perform well, the tone of the report remains positive with extensive use of optimistic vocabulary as compared to a less optimistic and more conservative tone when expecting worse financial performance.
Table 2: Excerpts from Annual Report
Methodology Explained
Each piece of annual report text data provides one aspect of reality about a firm’s condition for a particular financial year. But the text data contains a lot of noise or irrelevant information, which makes extracting only useful information, using computational tool, a bit cumbersome. So text data cleaning is a first important task before performing any analysis on it.
For cleaning the dataset, we have used the following steps:
- Remove all hypertext data, urls etc.
- Remove the selective dash only like un-relalistic is converted to unrealistic, un-certain to uncertain but not profit-loss to profitloss, rather profit loss. We identify the selective prefixes which changes/add stress on the only desired sentiment of words.
- Remove all non informative text data like numbers, dates, serial numbers for starting points, comma, dots, anything between () or {} or [].
- Remove all phrases which are general accounting literature terms like profit and loss, gain and loss, all words in capital letters.
- Perform the lemmatization of the keywords to remove inflectional endings only and to return the base or dictionary form of a word, called lemma. e.g. diminish , diminishes, diminishing, diminished reduced to diminish.
- Remove all stop words. There is a list of around 4000 words mainly consisting of objective words which are common literature words and possess no sentiment. This stop word removal greatly helped in inferring the results.
- The negation words change the overall sentiment of word used in a sentence. So the negation marking is done to correctly infer the actual sentiment expressed by a human writer.
We have used ‘bag of words’ approach in extracting sentiments out of text. A text document is converted into a vector of counts. The vector contains an entry for every possible word in vocabulary. The original text is a sequence of words but bag-of-words has no sequence. It just remembers how many times each word appears in the test. A matrix can represent the corpus of documents with one row per document and one column per feature (e.g. word) in the corpus (popularly known as term-document matrix). The element (i,j) within this matrix represents term frequency of feature in document. The resultant representation is called bag-of-documents representation. The final words list extracted from annual reports text using statistical feature selection methods is not exhaustive. The human intervention is desired. So finance and accounting expert intervention helped us create an exhaustive list of features (words) which may be generalized to all annual reports, e.g. qualified if used in auditor’s report carries a negative sentiment but in general English dictionary it is a positive sentiment word. The expert judgments helped in categorizing the exhaustive list of keywords into most probable sentiments associated with the feature in finance and accounting literature. The feature selection process reduced the number of keywords by 98%.
The process of feature selection has started with initial corpus of 50 distressed and 50 non-distressed firms. With initial inferences, iteratively the corpus is increased to around 800 firm’s annual reports for time period 2007-2015, representing different sectors and belonging to either of one category i.e. distressed or non-distressed firms. We have finally created two important bags of words- fear and sunshine. Fear word list consists of all the constraint words used in finance and accounting literature for disclosing the current or anticipated hardship. Sunshine word list consists of all the word used by managers for disclosing positive information in the annual reports[3]. We have used several metrics for measuring sentiments (Table 3).
Table 3: Sentiment Metrics
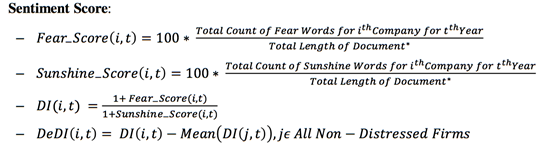
* Total number of words in the document. DI stands for Distress Intensity
Results
Our sample consisted of annual reports of both public and privately held companies operating and registered in India. We have selected the companies functioning in around 36 different sectors. Due to special nature of business and financial structure, insurance and banking firms were excluded from the sample. Our final sample consisted of 780 companies divided almost equally between financially distressed and healthy firms. The descriptive statistics of fear and sunshine words (Table 4) show that these words have discriminating ability between distressed and non-distressed firms. Average number of negative words (fear score) has increased for both financially distressed and healthy firms over the years. Surprisingly the optimism (sunshine words) in the Indian corporate sector has declined during 2007-2015. The fear score is high for financially distressed firms as compared to their sunshine score. Similarly for non-distressed firms the sunshine score is comparatively higher than their fear score.
Table 4: Descriptive Statistics of Bag of Words
| Distressed Firms | Non-distressed Firms | |||||||||||
| Fear_Score | Sunshine_Score | Fear_Score | Sunshine_Score | |||||||||
| Year | Mean | Min | Max | Mean | Min | Max | Mean | Min | Max | Mean | Min | Max |
| 2007 | 7.22 | 3.15 | 14.04 | 8.2 | 3.38 | 15.1 | 6.9 | 2 | 11.61 | 9.62 | 4.78 | 20.27 |
| 2008 | 8.05 | 3.09 | 14.42 | 8.7 | 3.64 | 15.39 | 7.65 | 2.78 | 13.41 | 10.11 | 5.23 | 20.6 |
| 2009 | 8.89 | 3.58 | 14.73 | 8.55 | 4.05 | 14.95 | 8.15 | 3.27 | 12.98 | 9.97 | 4.62 | 20.17 |
| 2010 | 7.76 | 2.08 | 13.91 | 7.92 | 4.16 | 14.91 | 7.31 | 2.65 | 11.73 | 9.51 | 3.79 | 20.73 |
| 2011 | 7.99 | 3.92 | 12.83 | 7.84 | 4.78 | 14.9 | 7.24 | 2.84 | 11.83 | 9.59 | 4.58 | 21.38 |
| 2012 | 8.43 | 3.61 | 14.55 | 7.86 | 4.55 | 13.75 | 7.45 | 2.53 | 11.23 | 9.53 | 5.35 | 20.94 |
| 2013 | 9.3 | 3.99 | 15.54 | 7.68 | 3.09 | 14.18 | 7.92 | 2.76 | 11.66 | 9.56 | 4.31 | 21.17 |
| 2014 | 9.28 | 4.03 | 15.66 | 7.69 | 4.27 | 13.62 | 7.8 | 3.35 | 10.89 | 9.31 | 4.55 | 20.41 |
| 2015 | 9.31 | 4.29 | 13.8 | 7.93 | 3.68 | 13.25 | 7.88 | 3.98 | 11.08 | 9.46 | 5.02 | 20.04 |
Our results show that text–based model performs better than Altman Z-Score in predicting default (Table 5). Panel A of the table shows that our text-based model has better predictive power than Altman’s EMS. For example, our model could correctly classify 83% of distressed firms two years before the year of default where the Altman’s EMS could classify only 44% correctly. One may wonder why our model wrongly identifies a third of healthy firms as distressed firms. The reason is our model captures any kind of trouble and not necessarily financial distress.
Table 5
Panel A: Percentage of firms identified as distressed using Text of Annual Report
| tth Year Annual Report | Defaulted in(t+2)th Year | Defaulted in(t+1)th Year | Defaulted in(t)th Year | Non Distressed Firms |
| 2013 | 83% | 75% | 73% | 33.5% |
| 2014 | – | 88% | 65% | 34% |
| 2015 | – | – | 77% | 34% |
Panel B: Percentages of firms identified as distressed using Altman EMS
| tth Year Annual Report | Defaulted in(t+2)th Year | Defaulted in (t+1)th Year | Defaulted in (t)th Year | Non Distressed Firms |
| 2013 | 44% | 58% | 65% | 15% |
| 2014 | – | 61% | 79% | 18% |
| 2015 | – | – | 67% | 17% |
We have also tried to map the default probability with firm ratings. We have used latest available rating of long-term debt instruments (or loans) issued (raised) by firms in our sample. Information on ratings were available for only 653 out of 780 firms in our sample. We observe that text-based probability estimates are highly correlated with the ratings of firms.
Table 6: Credit Ratings and Default Probabilities
| RATINGS | Number of Companies | Mean PD | Median PD | SD | Standard Error | Confidence Interval |
| A | 75 | 0.481215 | 0.478512 | 0.149147 | 0.017222 | 0.034316 |
| AA | 192 | 0.409935 | 0.416292 | 0.151555 | 0.010938 | 0.021574 |
| AAA | 62 | 0.309836 | 0.238397 | 0.141819 | 0.018011 | 0.036015 |
| B | 39 | 0.67719 | 0.656481 | 0.142903 | 0.022883 | 0.046324 |
| BB | 52 | 0.611038 | 0.609468 | 0.19681 | 0.027293 | 0.054792 |
| BBB | 59 | 0.470745 | 0.456779 | 0.172132 | 0.02241 | 0.044858 |
| C | 15 | 0.67049 | 0.640226 | 0.128924 | 0.033288 | 0.071396 |
| D | 155 | 0.610771 | 0.628122 | 0.169184 | 0.013589 | 0.026845 |
| NM | 2 | 0.786156 | 0.786156 | 0.052783 | 0.037323 | 0.474239 |
| WD | 2 | 0.309671 | 0.309671 | 0.062139 | 0.043939 | 0.5583 |
PD implies Probability of Default. NM=Not Mentioned. WD= Rating Withdrawn
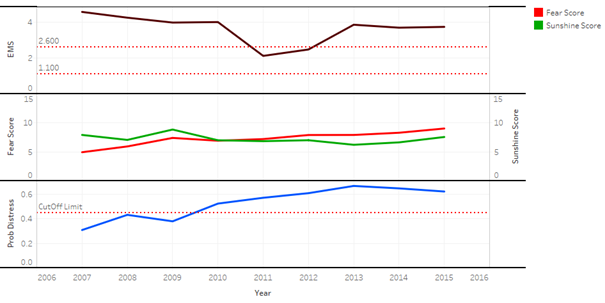
The focus of the study was to design an early warning measure of financial distress based on qualitative information present in corporate annual reports. We set out to construct a systemic financial distress prediction process based on the tone of corporate annual report text information and proposed a measure to quantify both positive and negative sentiments in the annual report’s language without using any accounting information. We turn to the case of Vijay Textiles for the last time (Figure 1). As mentioned earlier, the company defaulted in 2015 and Altman’s EMS failed to capture the phenomenon. However, our ‘fear score’ surpassed ‘sunshine score’ in 2011 and thereafter the ‘fear score’ was always higher than the ‘sunshine score’. Also the probability of default was close to 60% in 2011 and increased further thereafter.
Figure 1: Vijay Textiles: Probability of Default Estimates
The proposed sentiment based method performed better than the traditional accounting information based models for predicting the probability of distress. Hence, it is harmful to ignore the boring text of an annual report.
[1] The Altman Z-Score is used as a tool for analyzing the level of distress a firm might face in next one year. Altman et al (1995) introduced a revised Z-score model for the non-manufacturing and manufacturing companies operating in developing countries using the sample of Mexican Companies. They called the revised model as EMS (Emerging Market Score). The present study uses the EMS. Any firm, which secures an EMS of 1.1(2.6) or below (above), has high (low) risk of default.
[2] Framework for dealing with loan defaults, June 2016
[3] We regret our inability to further describe the methodology due to its proprietary nature.
References:
Altman, E., Hartzell, J., Peck, M., (1995). A Scoring system for emerging market corporate bonds. Salomon Brothers High Yield Research. June.
Beattie, V., McInnes, W., & Fearnley, S. (2004). A methodology for analysing and evaluating narratives in annual reports: a comprehensive descriptive profile and metrics for disclosure quality attributes. Accounting Forum, 28 (3), 205–236.
Tim Loughran and Bill McDonald (2011), When is a Liability not a Liability? Textual Analysis, Dictionaries, and 10-Ks. Journal of Finance, 66 (1), 35-65
Magnusson, C.; Arppe, A.; Eklund, T.; Back, B.; Vanharanta, H.; Visa, A. (2005). The language of quarterly reports as an indicator of change in the company’s financial status. Information & Management, 42 (4), 503-53