Pro-cyclical Behaviour of Indian Mutual Funds
Ashok Banerjee and Bobbur Abhilash Chowdary Download Article
The Reserve Bank of India (RBI), in its latest (June 2018) Financial Stability Report, highlights ‘pro-cyclical’ behaviour of mutual funds as consumers of liquidity. The Report also mentions that Indian and foreign banks have offered generous credit lines to mutual funds when interest rate views are bearish. The findings of the RBI have two implications: (a) mutual funds move away from G-sec instruments during bearish interest environment and invest in ‘spread products’; (b) credit lines from banks help mutual funds manage their liquidity risks during bearish interest regime. The present article tries to look at these findings of the RBI more closely.
Global mutual funds tend to show similar pro-cyclical behaviour during financial crisis, reducing their exposure to countries during bad times and increasing it when conditions brighten. This is particularly true for open ended mutual funds. There are several motivating factors for such pro-cyclical behaviour of institutional investors. Primary among them is liquidity needs. During good days, investors underestimate the need for liquidity buffer and hence invest most of the funds in risky and illiquid assets to boost short term performance. However, during liquidity crisis, fund managers tend to quickly sell risky investments to shore up cash. In case of Indian mutual funds, RBI asserts, managers were not required to sell risk assets to pay for redemptions. Banks provided them the required liquidity. Therefore, Indian mutual funds continued to hold onto risky assets (spread products) in spite of liquidity pressure from the investors, thanks to bank credit lines. Another important motivating factor is the principal-agent problem. Managers, as agent, are answerable to asset owners (principal) and therefore the agents try all possible tricks to keep principal in good humor. The problem for the Principal is she cannot directly monitor the operations of the managers. Benchmarks and annual targets are common monitoring tools used by the Principal to evaluate the performance of agents. Agents, therefore, try to show better performance by investing in risky but high-yielding assets. This creates a moral hazard problem. Pro-cyclical behaviour of an individual investor can be rational if the investor wants to exit early. However, if many investors want to exit at the same time, such liquidity pressure may trigger a pro-cyclical behaviour of the managers leading to significant asset volatility. We try to find out the motivation of managers of Indian mutual funds for the pro-cyclical behaviour.
Indian Mutual Fund Industry
Mutual funds play a very important role of channeling household savings into capital markets and thereby help retail investors diversify their risks. The Indian mutual fund industry has a total AUM (Asset Under Management) of Rs. 21.4 lakh crore ($330 billion) as on March 31, 2018. About 90% of the AUM is invested in open ended funds; about 9% in closed ended funds and the balance in interval funds. Interval funds are those which can be bought and sold only during a specified time interval, say 15 days. Over the last decade, the AUM of the Indian mutual fund industry has increased four-folds. The category-wise breakup of AUM is provided below (Table 1). Income-generating assets constitute 37% of the total AUM followed by equity.
Table 1: AUM of Indian Mutual Fund Industry as on March 31, 2018
| AUM (INR crore) | Percentage | |
| Income | 785553 | 37% |
| Infrastructure Debt | 2468 | ~1% |
| Equity | 669207 | 31% |
| Balanced | 172151 | 8% |
| Liquid/Money Market | 335525 | 16% |
| Gilt | 11404 | 1% |
| ELSS – Equity | 80583 | 4% |
| Gold ETFs | 4806 | ~1% |
| Other ETFs | 72888 | 3% |
| Fund of Fund investing overseas | 1451 | ~1% |
| Total | 2136036 | 100 |
Source: Association for Mutual Funds in India (AMFI)
If one looks at the type of investors in Indian mutual funds, one may observe (Table 2) retail investors love equity funds. Corporate investors, on the other hand, prefer non-equity funds.
Table 2: Indian Mutual Fund Industry: Investor Types
| Investor Type (figs in INR crore) | Equity | Non-Equity |
| Corporates | 1,87,538 | 7,41,890 |
| Banks/FIs | 2,294 | 20,297 |
| FIIs | 6,613 | 5,539 |
| High Net worth Individuals | 3,54,482 | 2,88,083 |
| Retail | 4,42,417 | 86,882 |
| Total | 9,93,345 | 11,42,691 |
Source: Association for Mutual Funds in India (AMFI)
Pro-cyclicality
In order to examine the behaviour of fund managers, we use AMFI (Association of Mutual Funds in India) classification of funds. We consider funds which are domiciled and registered for sale in India leaving out ELSS, FoFs (Fund of funds), Gold ETF, Growth, and Other ETFs. This selection criterion leaves us with 5029 funds. We further remove closed-end funds as these do not have any redemption pressure and therefore do not need any bank credit lines as argued by the RBI. This leaves us with 519 funds. Of the 519 funds, we focus only on bond and money market funds and leave out mixed asset funds. Our final sample stands at 409 funds (292 Bond and 117 Money market). These 409 funds include 13 Floating rate funds, 58 Gilt funds, 268 Income & Balanced funds, and 70 Liquid & Money market funds. The Assets Under Management (AUM) of these 409 mutual funds has increased consistently over the past 18 months (December 2016-May 2018), from Rs. 5,06,952 crores ($78 billion) to Rs. 9,63,557 crores ($148 billion) at a monthly compounded growth rate of 3.6%. However, if one looks at the distribution of such holdings, it is found that holding of government papers was generally on the decline since January 2017, whereas non-government holdings was continuously rising over the past 18 months (Figure 1). Of the total fixed-income instruments, government bond holdings, which was about 20% of total holdings, declined sharply to only 7% in May 2018. We know that when there is a change in the interest rate, bonds with lower coupon are more sensitive to interest rate risk.
Figure 1: Holding of Government and Corporate Bonds
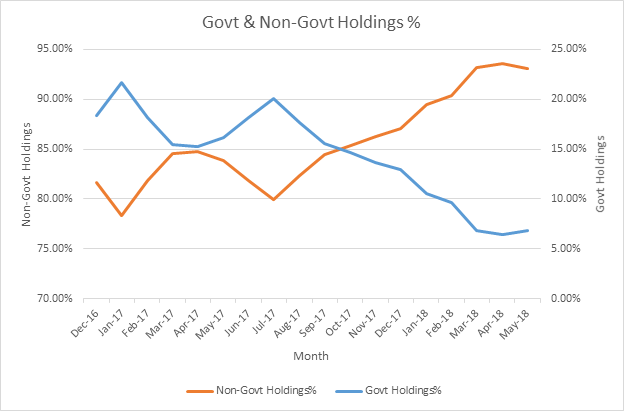
Source: Computed from holdings data taken from Lipper for Investment Management
What could be the reason for such a behaviour? The RBI report suggests that a bearish outlook for interest rates could be the culprit. The spread between 10-year Government Bonds and AAA-rated bonds of same maturity has fallen from 106 basis points to around 70 basis points in the past 18 months. This implies that yield on government bonds has increased more than that of corporate bonds during this period (Figure 2). Generally, the liquidity of corporate bonds in the secondary market is lower compared to government bonds. For example, the rupee volume of trading in corporate bonds in Indian capital markets was Rs. 145786 crore ($22 billion) in May 2018, which is only a quarter of the outright trading volume in G-Sec during the same period[1].
Figure 2: Yield Spread
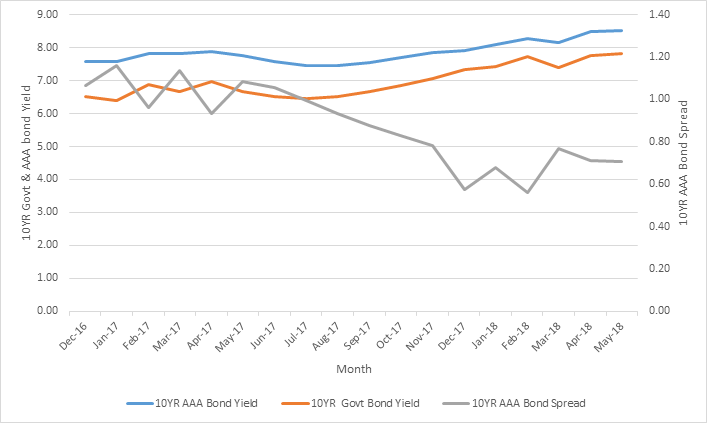
Source: Bloomberg
Therefore, larger exposure to corporate papers creates illiquidity in the portfolio. The RBI asserts that ‘liquidity insurance by financial intermediaries (banks) allow asset managers to load on yield-enhancing illiquid investments.’[2] The report shows significant increase in bank credit lines to mutual funds since June 2017. We looked at the actual borrowings (and not credit lines) by Indian mutual funds and found that highest borrowing (as a percentage of total AUM) of 409 (debt and money market) funds was only 6% during the past 18 months (Figure 3). In terms of magnitude, the highest borrowing was Rs. 59,015 crores against an AUM of Rs. 950,044 crores. We have also looked at bank-affiliated mutual funds separately and found similar borrowing pattern. So, the banks were offering credits to most of the mutual funds, whether affiliated or not. Further, there is no significant difference in the proportionate holdings of government and corporate bonds between bank-affiliated and other mutual funds.
Figure 3: Borrowings by Mutual Funds
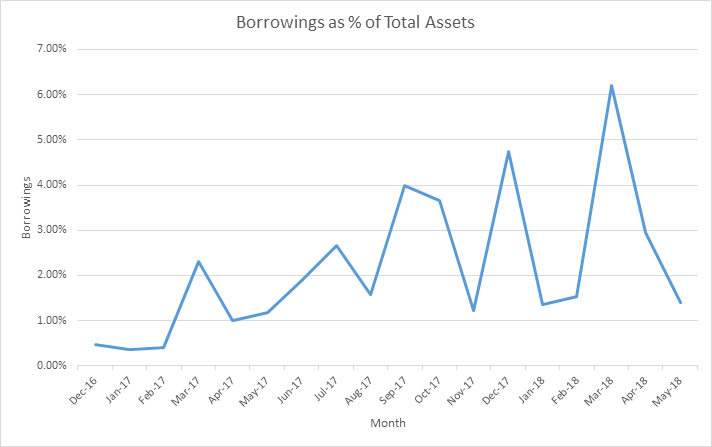
Source: Computed from holdings data taken from Lipper for Investment Management
Agency Theory
Was the motivation for shifting to high-yielding products driven by agency problems? One needs to look at the performance of the fund managers to understand the phenomenon. If managers consistently perform well, there is no reason for such aggressive behaviour during periods of bearish interest regime. On the other hand, any inconsistence performance would motive concerned managers to increase exposure to high-yielding risky, though illiquid, assets. Performance of top ten fund managers (Table 3) for the past three years shows major fluctuations. Results in Table 3 are based on performance of the chosen 409 funds.
Table 3: Performance of top ten fund managers
| Annual Performance (%) | ||||
| Fund Name | Manager Tenure(Yrs) | 2015-16 | 2016-17 | 2017-18 |
| Taurus Ultra Short Term Bd-Retail Growth | 0.8 | 8.28 | -5.38 | 9.27 |
| Taurus Short Term Income Fund-Growth | 0.8 | 8.68 | -5.10 | 9.12 |
| Taurus Dynamic Income Fund-Growth | 0.8 | 7.27 | -7.04 | 8.78 |
| Indiabulls Income Fund-Growth | 3.6 | 6.61 | 7.81 | 8.41 |
| Franklin India Short Term Inc-Growth | 3.9 | 6.02 | 11.12 | 8.39 |
| Franklin India Income Opportunities Fd-Growth | 3.9 | 6.14 | 11.30 | 8.36 |
| Franklin India Low Duration Fund-Growth | 3.9 | 9.05 | 10.20 | 8.19 |
| Franklin India Dynamic Accrual-Growth | 3.1 | 8.27 | 11.50 | 8.15 |
| Franklin India Credit Risk Fund-Growth | 3.9 | 6.98 | 10.74 | 8.02 |
| Taurus Liquid-Retail-Growth | 0.8 | 7.51 | -0.86 | 7.76 |
Source: Lipper for Investment Management. Performance is measured as percentage change in NAV of a fund adjusting for any distributions. Ranking is based on performance of 2017-18.
The top performing fund manager (Taurus Ultra) in 2017-18 had joined the fund less than a year ago. Hence, it shows that the mutual fund had changed the manager during 2017-18 due to poor performance in the previous year. It is also found that all fund managers (in top 10) who have performed poorly during 2016-17 were replaced. Another interesting feature worth noting is huge variation in performance of fund managers across years. For example, the top performer of 2015-16 (Franklin India Low Duration Fund) secured seventh position in 2017-18. Naturally, funds which did not perform well in 2016-17 would try to improve its near term (next year) performance to satisfy investors. Since all investments are marked-to-market on daily basis, change in market price of bonds would show up in the NAV. Therefore, bonds which are less sensitive to interest-rate risk would attract more funds from managers who would like to improve their performance.
Conclusions
Indifference to liquidity buffer (due to availability of generous lines of credit) and principal-agent problem are major contributors to the pro-cyclical behaviour of fund managers. Since incentive of fund managers is linked to the fund performance, managers may have perverse incentive to boost short-term performance at the risk of putting the fund face higher volatility in the long run.
***********
[1] Corporate bond trading volume from SEBI and Government bonds outright trading volume form CCIL
[2] Financial Stability Report June 2018 page 17