U.S. Cross Border Deals in China and India: A Comparison
Tianyi Cheng### and Debarshi Nandy Download ArticleThe last two decades has seen gradually increasing integration across global capital markets, not only with increased foreign direct investments but also an increased amount of deal making activity across countries. Several foreign firms have entered the U.S. market by acquiring a stake (in many cases a majority stake) in U.S firms. Likewise, U.S. firms have also increased their footprint globally, and in particular in Asia. China and India are two of the leading countries in Asia to account for a huge proportion of such expansionary deals by U.S. based institutions. This study takes an initial look at all such deals by U.S. institutions that acquired any type of stake in either China or India and presents a side-by-side comparison between these activities.[1] The analysis includes joint ventures, minority stakes, majority stakes, and outright mergers and acquisitions in either country between the years 1991 and 2018. In total, we have 1705 Chinese deals and 1981 Indian deals in our sample.
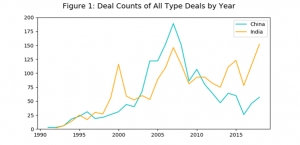
Figure 1 shows the trend in number of cross-border deals by US acquirors in China and India. Deals by US institutions in China reached its peak around 2007. However, since the financial crisis in 2008, the number of the deals in China has declined sharply until 2016. In 2016, the number of cross-border deals by US acquirors in China was only around 25, almost the same level as in 1998. Recently, over the last couple of years, deals in China has started displaying an upward trend. Compared with the single peak in China, the trend of similar deals in India showed multiple peaks in 2000, 2007, and 2015, with an average of 125 deal counts in each of these years. Since 2016, similar to the trend in China, the number of deals in India has also boomed, with the growth rate of deal counts being significantly higher than that in China. Based on the historical trend, 2018 appears to be another peak deal flow year for India.
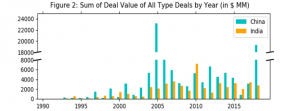
In addition to the number of deals, we also compared both the total deal value and the median deal value, for both countries, for each year. The analysis that follows on deal value is however only for a subset of the data, for which the deal values are non-missing, which is approximately for 42% of the overall data. While this limits our ability to get a clear overall picture, it should be noted that the data availability issue is very similar across the two countries and hence not skewed in any manner. Figure 2 presents the total value of all deals, which are expressed in real 2018 US dollars. The results show that there is greater heterogeneity in terms of total deal value in China, with the highest value achieved in 2005, around 23 billion US dollars. Over the past three years, the sum of deal value showed a similar upward trend to that of deal counts, with a significant jump up in 2018, reaching around 20 billion US dollars. Compared to China, the trend of total deal value in India has been more stable with an average value at around 3 billion USD per year. The peak total deal value in India was in 2010 but following that, total value has dropped to previous levels. On average since 2005, there does not seem to be significant differences in levels of total deal value in India.
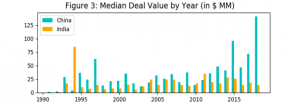
Figure 3 presents a comparison of the median deal value by year between China and India. We employ medians to eliminate the effects of the extremely large or small deal values. We find that for most years, the median deal value in China is greater than in India. Moreover, since 2013, while the median deal value in India has on average remained stable, the same has been increasing rapidly in China. For the last few years the median value in India has been gradually dropping in each year. Combined with the results from figures 1 & 2, the trend analysis suggests that US deals in China and India are potentially intrinsically different in nature, with India attracting smaller deals on average, but in larger numbers, while China attracting fewer deals but with higher value per deal.
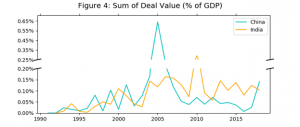
To shed further light, we also undertook the same exercise by normalizing total deal value by different macro indicators, such as gross domestic product (GDP), foreign direct investment (FDI), and stock market capitalization of each country. Figure 4 shows the trend of the sum of total deal value as a percentage of the GDP in each year. All the GDP values are in 2018 US dollars adjusted by the GDP deflator of each country. For most of the time and for both China and India, the percentage fluctuates from 0.02% to 0.15%, indicating that the volume of total deal values in both countries is quite small when expressed as a fraction of each country’s GDP. However, the overall trend indicates, that India has seen a steadier trend line in total deal value as a percent of GDP compared to China, over the last two decades.
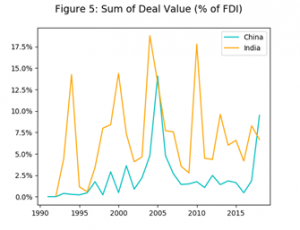
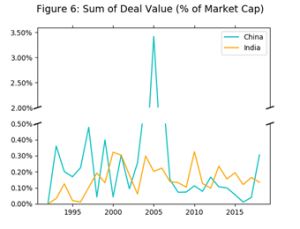
Similar to the GDP analysis we further explore on the trends of sum of deal values as a percent of FDI and stock market capitalization. As shown in Figure 5, the percentage of total deal values over FDI inflow each year in India is much higher than that in China, indicating that M&A investments make up a higher share of FDI inflow to India than in China. Figure 6 on the right shows that, even though the peak reached to 3.5% in 2005 due to extreme deal value, the percent of total deal values over Stock Market Capitalization is still quite insignificant both for China and India. Overall, the trend analysis indicates lower value fluctuations in India as compared to China, when analyzing deal flows from the US.
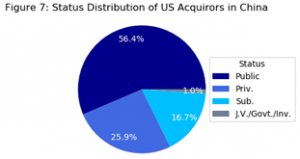
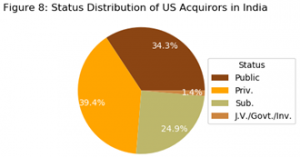
Figures 7 & 8 provides a look at the classification of US acquirors that invest in China and India. Compared to India, M&A deals in China have significantly more public acquirors from US, but fewer private acquirors. In addition, fewer US subsidiaries engage in China, relative to India. Joint ventures, government backed institutions, and financial acquirors make up approximately 1 to 1.5 percent in China and India, respectively. To understand whether the two countries have significant differences in these distributions, we conducted a double-sided t-test. Based on the results shown in Table 1, we can see that they have the significantly different distributions in public status and subsidiary status.
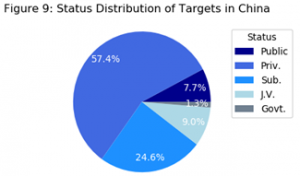
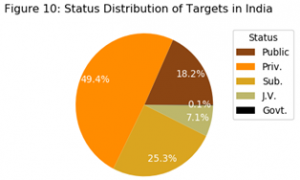
Figures 9 and 10 above, show the status distribution for target firms in China and India. We can see from the pictures that, compared to India, China has more private companies that are acquired by US companies but fewer public companies that are acquired. In terms of US firms establishing subsidiaries or engaging in JVs in the two countries, we do not find any significant difference. The t-tests below in Table 1, also highlights these differences between the two countries.
Table 1: Double-Sided T-test Result for Status distribution in China and India
| t-value | p-value | P < 1% | |
| Diff in Public Acquiror | 3.0788 | 0.0033 | Yes |
| Diff in Priv. Acquiror | -0.8948 | 0.3750 | No |
| Diff in Sub. Acquiror | -3.2649 | 0.0022 | Yes |
| Diff in Public Target | -4.4708 | 0.0001 | Yes |
| Diff in Priv. Target | 3.4141 | 0.0015 | Yes |
| Diff in Sub. Target | 0.3151 | 0.7540 | No |
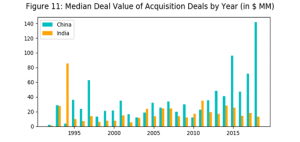
We finally, confirm the trends above by analyzing a couple of different sub-samples. First, we eliminate all JVs, since they account for a small portion of our sample, and only consider acquisition stakes. Figure 11 plots these results. As before, we find a similar trend on the median deal value for all types of M&A deals.
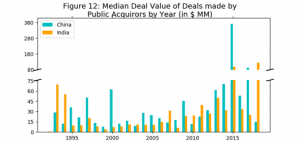
Similarly, as shown in Figure 12, we consider the median deal value by public US acquirors in China and India. The results indicate a growing trend in this respect over the last 5 years in both countries. While 2015 particularly stands out for China, 2018 shows significant deals by public US acquirors in India. Again, the overall trend for India seems more gradual, when looking at investment by public US acquirors.
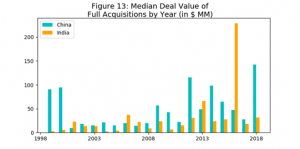
Finally, we also take a look at the trend in the full acquisition deals, which means 100% ownership of the targets after the transaction. Figure 13 shows that the median deal value of this type of deal grew in China, gradually from 2000. Compared with the trend in China, India displayed relatively flat deal value throughout the years, except for 2016, when the median deal value was significantly higher. However, for all other years the median values were on average lower than that in China.
In conclusion, it should be noted, that our analysis does not take into account government regulations that exist in both countries with regard to equity stake ownership and its heterogeneity across industries, and hence should be interpreted with caution. This overview is only meant to stimulate discussion on the factors that are driving or impeding US cross border investments for corporate control in China and India.
[1] We will use the term US institutions and US acquirors interchangeably in this article.


