Restructuring Electricity Distribution Companies: The UDAY Scheme
Payal Ghose and N Aparna Raja Download ArticlePower has traditionally been the pillar for economic development. Despite its critical role in growth and economic transformation, the Indian power sector has been beset with technical and financial difficulties, with its criticality resulting in several Government bailouts of the sector, the latest of which is the “Ujwal Discom Assurance Yojana” or in other words, the UDAY scheme.
Structure of power sector in India
The Indian power sector governed by the Ministry of Power (MoP) can be categorized into three arms – Generation, Transmission and Distribution. Actual production of electricity, using diversified sources (ranging from conventional sources like coal, oil, natural gas etc. to non-conventional sources like wild, solar and domestic waste) can be regarded as the Generation segment. Transmission facilitates delivery of electricity through high voltage towers and interconnected lines from a generation plant to the distribution point. Distribution is the final stage in the delivery of electric power through which electricity received at the distribution centers is supplied to retain consumers and businesses via poles and wires.
In India, the Centre and the state governments were constitutionally entrusted to lay down the laws, issue licenses for the development of power supply network and to create State Electricity Board (SEB) in each State (Indian Electricity Act, 1910 and The Electricity (Supply) Act, 1948). Over the years, electricity generation and transmission sectors were opened to the private sector (through an amendment to the 1948 act in 1991 and The Electricity Laws (Amendment) Act 1998). However, distribution remained exclusively in the domain of the States, with few exceptions (e.g., West Bengal). Inefficient planning, lack of investment, over staffing, inadequate maintenance, power theft, non-billing or incorrect billing led to mounting losses to SEBs. Mismatch between tariffs and cost of generating power, delay in increasing tariff rates, below-cost tariffs to different consumer groups, and free electricity to agriculture weakened the finances of state utilities, making distribution sector unappealing for private investments. To address problems faced by the power sector especially for the purpose of distancing state governments from tariff determination, the central government, in 1998 passed, the Electricity Regulatory Commissions Act to mandatorily create the Central Electricity Regulation Commission which is designated to set the tariff of centrally controlled generation companies. States too were provided with an option to either set up a commission or function under the existing procedure. Nevertheless, it was only after the enactment of the Electricity Act, 2003, that the power sector underwent significant transformation.
The Electricity Act, 2003 which came into effect from June 02, 2003, replaced some of the previous laws to provide for the development of the power sector as a whole and shift regulated business to competitive business. It is “an Act to consolidate the laws relating to generation, transmission, distribution, trading and use of electricity and generally for taking measures conducive to development of electricity industry, promoting competition therein, protecting interest of consumers and supply of electricity to all areas, rationalization of electricity tariff, ensuring transparent policies regarding subsidies, promotion of efficient and environmentally benign policies, constitution of Central Electricity Authority, Regulatory Commissions..”
The Accelerated Power Development and Reform Programme (APDRP) which was first contemplated by the Central Government in 2002-03 to improve financial viability of the SEBs, reduce losses, improve quality and availability of power supply was modified further by the XI Plan as Restructured Accelerated Power Development and Reform Programme (R-APDRP). The programme was approved for IT enablement and strengthening of distribution sector through up-gradation for which funds are provided through loans to be converted into grant after achieving certain level of loss reduction.
Discoms – The weakest link
Distribution companies (Discoms) are the intermediaries between generators and the end-users of power which purchase electricity from wholesale markets and provide it to retail customers. Discoms charge a mark-up over their cost of supply to earn return in addition to other income they earn from investments. As Discoms are the backbone for the entire electricity supply chain, their debt overhang is seen as a bottleneck for the sector. The Chart given below shows the financial gap per unit of power in Discoms as a difference between average cost of supply (ACS) and average revenue (AR). Since 2008-09, the gap per unit has been consistently on the rise from Rs.0.77 to Rs.1.18 in 2012-13. During 2013-14, however, the gap reduced marginally to Rs.1.15. The primary reason for the ever-increasing gap could be non-equivalent increase in tariff in relation to increase in cost of inputs.
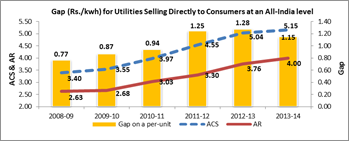
Source: Power Finance Corporation Ltd. Note: Average Cost of Supply (ACS) = Total Expenditure/Total input energy (Kwh); Average Revenue (AR) = Revenue from sale of power (excluding subsidy) + other income/Total input energy (Kwh); Gap = ACS – Average Revenue
Financial gap per unit per state for 2013-14 is illustrated in the following Chart. Out of 30 States, just 5 states, namely, Sikkim, Uttarakhand, Delhi, Kerala and West Bengal, were profit making states without state government subsidies. 11 states had a gap of less than Re.1 per unit, while remaining 14 had a gap of more than Re.1 per unit. It can also be observed that 9 states made up 75% of the total loss per unit during 2013-14.
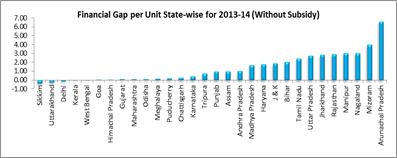
Source: Power Finance Corporation Ltd.
The deteriorating financial health of distribution companies has become an area of concern. They are caught in a vicious circle with operational losses being funded by debt reducing their ability to buy power to satisfy demand. Delayed and inadequate tariff hikes that are quite below the cost can be termed as the main reason for mounting losses. Apart from this revenue side constraint, there are other factors on the cost side such as failure on part of the states to undertake financial restructuring of Discoms in terms of fixing tariff on a regular basis and setting up of the State Electricity Distribution Responsibility Act, unforeseen cost of fuel, a sharp increase in the use of expensive imported coal last minute, rising interest expenses due to Discoms’ increased borrowing to meet cash-flow needs led to escalation in cost that played a crucial role in making finances weak for these companies.
Source: Ministry of Power
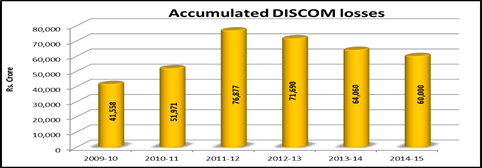
Outstanding debt of DISCOMs has increased from about Rs.2.40 lakh crore in 2011-12 to about Rs.4.30 lakh crore in 2014-15, with interest rates up to 14-15% and accumulated losses of approximately Rs.3.80 lakh crore (as on March, 2015).
Reasons behind Discom losses
| Technical losses | Technical losses are caused by power theft, overloading of existing lines due to higher demand for power, non-upgradation of equipment, improper relocation of distribution substations and provisioning for additional distribution transformers in the pipeline. |
| Commercial losses | Commercial losses arise due to low metering/billing/collection efficiency, causing persistent gaps between ACS and ARR. Furthermore, faulty meters, billing on average consumption basis, delays in revenue collections and unauthorised usage of power by agricultural and rural consumers also contribute to heavy commercial losses. |
| Rise in subsidy dependence | Delay and nonpayment of subsidies by state governments is a major source of loss for Discoms. These subsidies are meant to be paid to them to compensate for cheaper power supplies to certain segments promised by the state governments. In particular, the subsidy burden for distribution companies is estimated to have increased due to higher costs and cheaper tariff for the farm sector. |
| Under pricing and reporting lags | Selling prices have been historically set significantly lower than the procurement price for electricity, influenced by the political agenda of state governments. Furthermore, Discoms release their financial results with a considerable lag, which complicates the assessment of their financial viability by potential lenders. |
| Power in concurrent list | Electricity is a concurrent subject under the purview of states; as a result, oversight of Discoms is the domain of state governments. Consequently, it is difficult for the Central Government to reform Discoms directly. |
| Reduction in Power Purchase Agreements (PPAs) | The lower energy requirement of Discoms due to their fragile financial health has resulted in fewer PPAs. Going forward, signing of new PPAs will depend on the ability of Discoms to enter into long term commitments. This implies that in the short term market, electricity generating companies will continue to remain exposed to volatile prices. |
Source: RBI “State Finances: A Study of Budgets of 2015-16”
Vision for power sector
Revamping power distribution has now become one of the priorities for the government to achieve its ambitious “Power for All” goal as weakness in Discoms results in cascading effect on other sub-sectors of electricity supply. The Government announced several policy actions on distribution front as listed in the Economic Survey 2015-16, including:
- Ujwal DISCOM Assurance Yojana (UDAY) – States shall take over 75% of Discom debt outstanding as of September 2015, reduction of Aggregate Technical & Commercial (AT&C) losses to 15% and decrease in Gap (cost – revenue) by 2018-19, increased supply of domestic coal to substitute for imported coal, prohibition to avail short term debt from banks for financing losses.
- Deen Dayal Upadhyaya Gram Jyoti Yojana (DDUGJY) – Electrification of all villages, reduction in losses by metering of unmetered connections, separation of feeders to ensure sufficient electricity to agriculture and continuous supply to other categories and improvement of sub-transmission and distribution network to improve the quality and reliability of supply.
- Integrated Power Development Scheme (IPDS) – Strengthening of sub-transmission and distribution network, metering of distribution transformers/feeders/consumers in urban areas, IT enablement of distribution sector and strengthening of distribution network.
- Domestic Efficient Lighting Program (DELP) – 77 crore LED bulbs to replace household and street light incandescent bulbs.
- National Tariff Policy, 2016 – Revision of Cross subsidy surcharge formula and planning by regulator to supply power 24X7 to all consumers latest by 2021-22 or earlier.
The UDAY Scheme
The Union Cabinet approved the UDAY scheme on November 5, 2015 for the financial turnaround and revival of Discoms and ensure a sustainable solution to the problem of distribution losses.
Features of UDAY Scheme
| State Takeover of Discom Debt | Debt takeover mechanism | UDAY Bonds | Treatment of residual debt | Future Discom financing | ||||||||||||
| Scheme available only for State Discoms including combined generation, transmission and distribution undertakings | Debt of Discom will be taken over in the priority of debt already due, followed by debt with highest cost. | Non-SLR bonds issued by States shall have maturity period of 10-15 years with a moratorium on repayment of principal up to 5 years, as required by the State. | Up to 25% of the grant can be given as equity where the Discom requires equity support. | Bank/FIs henceforth cannot advance short term debt to Discoms for financing losses. | ||||||||||||
| States shall take over 75% of Discom debt as on September 30, 2015. Debt shall be taken over as: 2015-16 – 50% 2016-17 – 25% |
Transfer to Discom by State will be as grant with an option to spread the grant over three years (MoP can further relax by 2 years for high debt States). | 10 year Bond Pricing: The 10 year UDAY bonds would be priced at the 10 year G-sec + 0.50% spread for 10 year SDLs + 0.25% spread for non-SLR status on semi-annual compounding basis, or market determined rate, whichever is lower. This may be further reduced if the interest is paid on monthly basis. | Discom debt to be taken over by the State will include Discom bonds which are committed to be taken over by the State as part of FRP 2012 including bonds already taken over in 2015-16. | Working capital loans from Bank/FIs will only be allowed up to 25% of the Discom’s previous year’s annual revenue. | ||||||||||||
| Discom debt is de facto borrowing of States which is not counted in de jure borrowing. Principal debt taken over will not be included in fiscal deficit of States. However, interest has to be serviced within FRBM limits. | States will issue non-SLR including SDL bonds in the market or directly to the respective banks /Financial Institutions (FIs) holding the Discom debt to the appropriate extent. Proceeds shall immediately be transferred by the States to the Discoms, which in turn shall discharge the corresponding amounts of Bank/FIs debt. | Bonds to be issued against the loans of Fis, including REC and PFC, would first be offered for subscription by the market including pension and insurance companies. Balance, if any, would be taken over by banks in proportion to their current lending to Discoms. | For amount transferred as loan, the interest rate payable by the Discoms to the State for the intervening period shall not exceed the rate of interest on the bonds issued by the State. | States shall take over the future losses of Discoms in a graded manner.
|
||||||||||||
| Operationalized through a tripartite agreement amongst the Ministry of Power, State Government and the Discom. | Banks/FIs shall not levy any prepayment charge on the Discom debt. | Residual Discom debt to be converted into bonds to be offered to market at a likely rate of State Bond + 0.20%. If not converted into bonds, Banks can lend at interest rate not higher than Banks’ Base rate + 0.10%. | Loss financing after October 1, 2015 only as per loss trajectory finalized by States with MoP and only through SDLs or Discom bonds backed by State guarantee. | |||||||||||||
| UDAY is optional for all States. | Banks/FIs will waive any unpaid overdue or penal interest on the Discom debt and refund/adjust any such overdue/penal interest paid since October 1, 2013. | Half of residual debt shall be taken over by the State by 2016-17. States shall guarantee repayment of principal and interest payment for balance debt remaining with Discoms/ bonds issued by Discom. |
Source: Ministry of Power, Coal and New & Renewable Energy
Expectations from the scheme
The UDAY scheme will not only serve at improving the financials of Discoms, it will also account for huge capital savings for the Indian banking sector, especially the Public Sector Banks which have maximum exposure to the power sector. The UDAY scheme rather than being a scheme doling out free funds without accountability is more of an attempt at financial restructuring for all the parties involved – the States, Discoms and their creditors. It is essentially a mechanism of converting outstanding Discom debt to tradable instruments rather than NPAs, thus, freeing up further funding channels. This will reduce the financial pressure on the Discoms and the resultant reduction in the cost of power can be passed on to the final consumers. Discoms will be forced to improve their operational efficiency to avail further financing. UDAY comes with strict budgetary constraints, provisions for monitoring by Central teams and binding operational milestones for the State governments and Discoms. Operational efficiency improvements like compulsory smart metering, upgradation of transformers, meters etc., energy efficiency measures like efficient LED bulbs, agricultural pumps, fans & air-conditioners etc. will reduce the average AT&C loss from around 22% to 15% and eliminate the gap between Average Revenue Realized (ARR) & ACS by 2018-19. Reduction in cost of power would be achieved through measures such as increased supply of cheaper domestic coal, coal linkage rationalization, liberal coal swaps from inefficient to efficient plants, coal price rationalization based on GCV (Gross Calorific Value), supply of washed and crushed coal, and faster completion of transmission lines. NTPC alone is expected to save Rs.0.35/unit through higher supply of domestic coal and rationalization/swapping of coal which will be passed on to Discoms/consumers.
The UDAY scheme will force fiscal prudence on the part of the States as it requires them to absorb a part of future losses of the Discoms while providing for the cost of servicing their subsidies in their Budgets. Financial liabilities of Discoms are the contingent liabilities of the respective States and need to be recognized as such. States shall take over 75% of Discom debt as on September 30, 2015 over two years – 50% of Discom debt shall be taken over in 2015-16 and 25% in 2016-17. This will reduce the interest cost on the debt taken over by the States to around 8-9%, from as high as 14-15%; thus improving overall efficiency. Further provisions for spreading the financial burden on States over three years, will give States flexibility in managing the interest payment on the debt taken over, within their available fiscal space in the initial few years. A permanent resolution to the problem of Discom losses will be achieved by States taking over and funding at least 50% of the future losses (if any) of Discoms in a graded manner. It also provides incentives for performing states.
Benefits of UDAY
| Government | Industry & Consumers | Banks & Investors | Additional Benefits for States | Discoms |
| Achievement of 24X7 Power for All | Availability of 24X7 power improving quality of life and efficiency | Avoid banking contagion (Rs.40,000 crore of repayments due to banks in 2015-16) which will create significant NPAs | States accepting the scheme and performing as per operational milestones will be given additional/ priority funding through DDUGJY, IPDS, Power System Development Fund (PSDF) or other such schemes of MoP and MNRE | Enabling quarterly tariff increase to mitigate cost increase burden |
| Power to 5 crore households without electricity | Lower cost of power -Typical 3,000 MW NTPC plant running at 60% Plant Load Factor (PLF) has a fixed cost of Rs.2.67/unit, vs Rs.1.80 at 90% PLF | Lower risk for existing investments and loans in power, coal and renewables sector | Such States shall also be supported with additional coal at notified prices and, in case of availability through higher capacity utilization, low cost power from NTPC and other Central Public Sector Undertakings (CPSUs) | Operational efficiency |
| Speedy achievement of electrification of remaining 18,500 villages | Global competitiveness of industry | Lower capital adequacy provisions as direct exposure to state governments would attract 0% risk-weight, compared to 20% for state government guaranteed exposure to Discoms, thus freeing up substantial amount of risk-weighted capital. The remaining Discom loans would attract lower provisioning as they would be classified as standard | Lower cost of power | |
| Energy security through coal and renewables | Increased procurement of power by Discoms revives existing power projects suffering from low PLFs | Reduction in interest cost | ||
| Reduce Current Account Deficit (CAD) from higher diesel import (current annual imports of around Rs.50,000 crore) | Reduces investment uncertainty across the sector | Opportunity to break even in the next 2-3 years | ||
| Meet ambitious renewable energy commitments as a responsible global citizen | Enforcing financial discipline through alignment with State finances | |||
| Revive investments in power sector to create jobs | Future bank lending channels opened |
Source: Ministry of Power, Coal and New & Renewable Energy
UDAY- Issuance Mechanism
In March 2016, RBI asked for bids from market participants interested in subscribing to the UDAY bonds through private placement route. Given non-SLR status by RBI, these securities were issued by eight State Governments under the Government Securities Act, 2006 and are eligible for market repo.
State-wise issuance of UDAY Bonds during 2015-16 (Rs. Crore)
| Sr. No. | States | Bonds issued (Face Value) | Average Coupon of Issue |
| 1 | Rajasthan | 37,349.77 | 8.35 |
| 2 | Uttar Pradesh | 24,332.47 | 8.55 |
| 3 | Haryana | 17,300.00 | 8.21 |
| 4 | Punjab | 9,859.72 | 8.51 |
| 5 | Jharkhand | 5,553.37 | 8.51 |
| 6 | Jammu & Kashmir | 2,140.00 | 8.51 |
| 7 | Bihar | 1,554.52 | 8.51 |
| 8 | Chhattisgarh | 870.12 | 8.54 |
| Total | 98,959.97 |
Source: RBI, CCIL
Profile of UDAY bonds issued in 2015-16
UDAY bonds have added substantially to the future debt liabilities of the participating States for the next decade and a half. The near-term liability for these bonds is the highest for Rajasthan, which also has the highest proportionate share of UDAY bonds in total debt.
Maturity Profile of UDAY Bonds (Face Value in Rs. Crore)
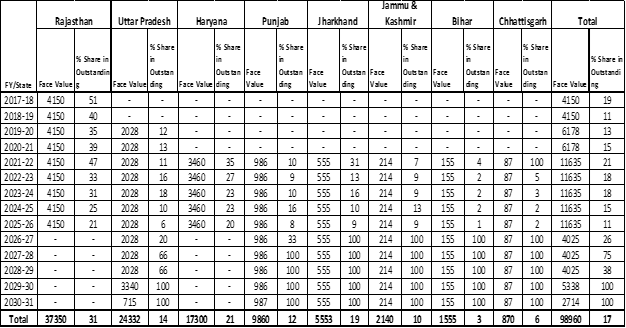
Source: CCIL (SDLs Outstanding as of May 31, 2016)
UDAY bonds have been issued at multiple maturities to suit the appetite of various investor groups. The higher yields compared to the central government securities is expected to attract investments. In general, Uttar Pradesh has had to offer the highest yields for these bonds.
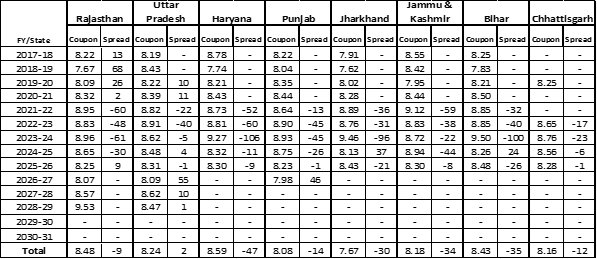
Coupon Profile of UDAY Bonds issued in 2015-16 (%)
| FY/State | Rajasthan | Uttar Pradesh | Haryana | Punjab | Jharkhand | Jammu & Kashmir | Bihar | Chhattisgarh |
| 2017-18 | 8.35 | – | – | – | – | – | – | – |
| 2018-19 | 8.35 | – | – | – | – | – | – | – |
| 2019-20 | 8.35 | 8.32 | – | – | – | – | – | – |
| 2020-21 | 8.35 | 8.50 | – | – | – | – | – | – |
| 2021-22 | 8.35 | 8.60 | 8.21 | 8.51 | 8.53 | 8.53 | 8.53 | 8.55 |
| 2022-23 | 8.35 | 8.52 | 8.21 | 8.45 | 8.45 | 8.45 | 8.45 | 8.48 |
| 2023-24 | 8.35 | 8.56 | 8.21 | 8.48 | 8.50 | 8.50 | 8.50 | 8.53 |
| 2024-25 | 8.35 | 8.52 | 8.21 | 8.50 | 8.50 | 8.50 | 8.50 | 8.50 |
| 2025-26 | 8.35 | 8.30 | 8.21 | 8.22 | 8.22 | 8.22 | 8.22 | 8.27 |
| 2026-27 | – | 8.64 | – | 8.44 | 8.45 | 8.45 | 8.45 | 8.64 |
| 2027-28 | – | 8.72 | – | 8.65 | 8.65 | 8.65 | 8.65 | 8.67 |
| 2028-29 | – | 8.48 | – | 8.48 | 8.48 | 8.48 | 8.48 | 8.46 |
| 2029-30 | – | 8.69 | – | 8.62 | 8.62 | 8.62 | 8.62 | 8.60 |
| 2030-31 | – | 8.79 | – | 8.72 | 8.72 | 8.72 | 8.72 | 8.70 |
| Total | 8.35 | 8.55 | 8.21 | 8.51 | 8.51 | 8.51 | 8.51 | 8.54 |
Source: CCIL
Despite the worsening in their fiscals, most States managed to issue the UDAY bonds at lower coupons than their existing securities for the respective tenors, primarily as a result of the rally in the benchmark 10-year central government bond following the Budget, which was the basis for the pricing of these bonds. As a result States such as Rajasthan were able to issue UDAY bonds at coupons lower than the cut-offs in the primary auctions for their 10-year SDLs.
Average Coupon Non-UDAY SDLs (%) and Spread of UDAY Bonds (bps)
Source: CCIL
Impact on Primary Market
Overall indebtedness of States has been on an upward trajectory, especially during the last financial year when market borrowings jumped more than 22% over the previous fiscal. While the RBI was able to conduct market borrowing operations in a smooth manner without undue disruptions, the apprehensions about the incremental supply of state bonds due to the UDAY issuances led to the hardening of the cut-offs in the SDL auctions in the last quarter of 2015-16. Lack of clarity on the RBI provisions regarding the bonds also added to the negativity made especially severe due to the prevailing liquidity tightness. The increased supply was also blamed for the lack of FPI interest in SDLs despite enhancement of limits on fears of supply outstripping demand. The market received some support after the RBI clarified that the UDAY bonds would be issued on private placement basis and could be considered for classification under the held-to-maturity (HTM) category.
Primary Market Borrowings (10-year SDL) (Rs. Crore)
| Month/State | Rajasthan | Uttar Pradesh | Haryana | Punjab | Jharkhand | Jammu & Kashmir | Bihar | Chhattisgarh |
| Apr-15 | 1000 | 4000 | – | 1000 | – | – | – | – |
| May-15 | 1000 | 2000 | 1900 | 900 | – | 500 | – | – |
| Jun-15 | 1000 | 2000 | 1000 | 600 | – | – | – | – |
| Jul-15 | 1000 | 2000 | 1900 | 600 | 1000 | 500 | – | 700 |
| Aug-15 | – | 1000 | 1000 | 1500 | – | 450 | – | – |
| Sep-15 | 500 | 2000 | 2000 | 1300 | – | – | 2000 | – |
| Oct-15 | 1750 | 3000 | – | 1500 | 500 | – | 1500 | – |
| Nov-15 | 2250 | 2000 | 800 | 500 | 1000 | 300 | – | 800 |
| Dec-15 | – | 1500 | 1900 | 600 | 500 | 150 | – | 1500 |
| Jan-16 | 3000 | 4000 | 1100 | 300 | 500 | – | – | 700 |
| Feb-16 | 1800 | 5000 | 2500 | 1000 | 1850 | 350 | 5000 | – |
| Mar-16 | 2500 | 1500 | – | 1000 | – | – | 3000 | 1150 |
| 2015-16 | 15800 | 30000 | 14100 | 10800 | 5350 | 2250 | 11500 | 4850 |
| Apr-16 | 750 | 2400 | – | 1200 | – | – | – | – |
| May-16 | 750 | 4500 | – | 800 | – | – | – | – |
Source: CCIL
While the investors were able to lock in higher yields, the interest costs for the borrowers were higher despite a downward trajectory in policy rates. Impact of the UDAY issuances was observable with investors differentiating between states based on their fiscal position and the quantum of losses accumulated by their Discoms. Yields started declining post RBI’s clarifications.
Primary Market Cut-offs (10-year SDL) (%)
| Month/State | Rajasthan | Uttar Pradesh | Haryana | Punjab | Jharkhand | Jammu & Kashmir | Bihar | Chhattisgarh |
| Apr-15 | 8.05 | 8.09 | – | 8.05 | – | – | – | – |
| May-15 | 8.29 | 8.27 | 8.21 | 8.32 | – | 8.18 | – | – |
| Jun-15 | 8.22 | 8.20 | 8.22 | 8.27 | – | – | – | – |
| Jul-15 | 8.29 | 8.31 | 8.29 | 8.34 | 8.30 | 8.30 | – | 8.32 |
| Aug-15 | – | 8.28 | 8.29 | 8.26 | – | 8.28 | – | – |
| Sep-15 | 8.23 | 8.20 | 8.20 | 8.22 | – | – | 8.17 | – |
| Oct-15 | 7.97 | 7.99 | – | 8.01 | 7.98 | – | 7.99 | – |
| Nov-15 | 8.15 | 8.16 | 8.15 | 8.14 | 8.17 | 8.17 | – | 8.19 |
| Dec-15 | – | 8.23 | 8.27 | 8.24 | 8.25 | 8.26 | – | 8.23 |
| Jan-16 | 8.33 | 8.37 | 8.38 | 8.31 | 8.42 | – | – | 8.32 |
| Feb-16 | 8.56 | 8.68 | 8.51 | 8.56 | 8.82 | 8.63 | 8.68 | – |
| Mar-16 | 8.27 | 8.58 | – | 8.17 | – | – | 8.60 | 8.35 |
| Apr-16 | 7.98 | 8.02 | – | 7.97 | – | – | – | – |
| May-16 | 8.00 | 8.03 | – | 8.00 | – | – | – | – |
Source: CCIL
Impact on Secondary Market
SDL yields spiked in January-February 2016 as the market, already apprehensive due to the enhanced State borrowings through incremental supply of SDLs, waited for clarity on the UDAY issuances.
Secondary Market Yields of SDLs >9 year (%)
| Month/State | Rajasthan | Uttar Pradesh | Haryana | Punjab | Jharkhand | Jammu & Kashmir | Bihar | Chhattisgarh |
| Apr-15 | 8.12 | 8.07 | 8.03 | 8.10 | 8.08 | – | 8.12 | – |
| May-15 | 8.17 | 8.20 | 8.18 | 8.24 | 8.22 | 8.16 | 8.16 | – |
| Jun-15 | 8.21 | 8.24 | 8.22 | 8.24 | 8.25 | 8.24 | 8.28 | 8.29 |
| Jul-15 | 8.24 | 8.26 | 8.24 | 8.30 | 8.29 | 8.22 | – | 8.31 |
| Aug-15 | 8.23 | 8.20 | 8.26 | 8.23 | 8.21 | 8.28 | 8.24 | 8.21 |
| Sep-15 | 8.25 | 8.18 | 8.19 | 8.20 | 8.18 | 8.23 | 8.17 | 8.20 |
| Oct-15 | 8.01 | 7.98 | 7.97 | 7.98 | 7.96 | – | 7.97 | 7.96 |
| Nov-15 | 8.12 | 8.14 | 8.10 | 8.12 | 8.14 | – | 8.08 | 8.16 |
| Dec-15 | 8.18 | 8.20 | 8.22 | 8.16 | 8.18 | 8.26 | – | 8.21 |
| Jan-16 | 8.30 | 8.33 | 8.33 | 8.24 | 8.40 | – | – | 8.30 |
| Feb-16 | 8.59 | 8.63 | 8.49 | 8.40 | 8.68 | 8.75 | 8.62 | 8.34 |
| Mar-16 | 8.29 | 8.46 | 8.17 | 8.22 | 8.33 | 8.12 | 8.46 | 8.43 |
| Apr-16 | 8.04 | 8.04 | 8.01 | 8.06 | 8.06 | – | 8.06 | 8.03 |
| May-16 | 8.02 | 8.02 | 8.03 | 8.03 | 8.04 | 8.03 | 8.05 | 8.03 |
Source: CCIL. Excluding Special Bonds
Commensurate to the spike in yields of SDLs, spreads over g-secs also rose during the last quarter of 2015-16, peaking in February 2016, and declining thereafter throughout March as the market got increased clarity from the RBI over the implementation of the scheme.
Secondary Market Spread of SDLs >9 year (bps)
| Month/State | Rajasthan | Uttar Pradesh | Haryana | Punjab | Jharkhand | Jammu & Kashmir | Bihar | Chhattisgarh |
| Apr-15 | 30 | 26 | 21 | 28 | 24 | – | 28 | – |
| May-15 | 24 | 26 | 29 | 29 | 29 | 36 | 26 | – |
| Jun-15 | 29 | 28 | 30 | 29 | 24 | 27 | 28 | 24 |
| Jul-15 | 30 | 32 | 29 | 31 | 34 | 29 | – | 38 |
| Aug-15 | 30 | 32 | 30 | 33 | 32 | 35 | 34 | 30 |
| Sep-15 | 36 | 34 | 32 | 33 | 31 | 39 | 32 | 34 |
| Oct-15 | 33 | 28 | 30 | 27 | 30 | – | 29 | 29 |
| Nov-15 | 31 | 32 | 30 | 31 | 32 | – | 34 | 32 |
| Dec-15 | 30 | 31 | 32 | 29 | 29 | 31 | – | 31 |
| Jan-16 | 54 | 55 | 56 | 41 | 62 | – | – | 53 |
| Feb-16 | 63 | 71 | 63 | 55 | 75 | 70 | 71 | 53 |
| Mar-16 | 55 | 65 | 47 | 49 | 57 | 39 | 66 | 63 |
| Apr-16 | 43 | 43 | 44 | 39 | 45 | 44 | 40 | |
| May-16 | 41 | 41 | 41 | 42 | 39 | 39 | 44 | 42 |
Source: CCIL. Excluding Special Bonds
Despite the initial negativity in the market over the non-SLR status of these bonds, they have found sufficient liquidity in the secondary market – both outright and market repo segments unlike power bonds issued earlier by States. The share of UDAY bonds in total trading of SDLs during April-May 2016 was almost 32% in the outright and a substantial 68% in the repo segment.
Trading Summary UDAY Bonds in 2016-17
| State | Outright | Repo | ||||
| Trades | Value (Rs. Cr) | % Share in Total SDL | Trades | Value (Rs. Cr) | % Share in Total SDL | |
| Rajasthan | 218 | 2208.65 | 3.25 | 146 | 15700.00 | 32.65 |
| Uttar Pradesh | 121 | 1173.46 | 1.73 | – | – | – |
| Haryana | 8 | 42.75 | 0.06 | 66 | 11825.00 | 24.59 |
| Punjab | 905 | 9864.30 | 14.52 | 81 | 3500.00 | 7.28 |
| Jharkhand | 47 | 329.23 | 0.48 | – | – | – |
| Jammu & Kashmir | 233 | 1979.00 | 2.91 | – | – | – |
| Bihar | 77 | 668.48 | 0.98 | 99 | 3962.00 | 8.24 |
| Chhattisgarh | 120 | 860.33 | 1.27 | 17 | 960.00 | 2.00 |
| Total | 1729 | 17126.20 | 25.21 | 409 | 35947.00 | 74.76 |
Source: CCIL
NBFCs followed by Mutual Funds have been the most active participants in secondary outright market for UDAY bonds. However, in terms of net activity, Provident Funds have been the most active buyers with Insurance companies being a distant second. Public Sector Banks have been the most active sellers.
Conclusion
UDAY is being projected by the government as a shining example of the utilization of the best principles of cooperative and competitive federalism. The journey so far for the UDAY bonds has been relatively smooth sailing as investors have gained appetite for these bonds, with default risk akin to SDLs, in a bid to lock in higher yields. The improvement in the financials of the Discoms, on the other hand, is expected to help overcome the critical hurdle in the government’s ambitious goals for the power sector.
******