Shape of Things to come in India’s Payments Systems: RBI’s Vision Document
Partha Ray Download Article
An effective payment and settlement system is one of the key elements of a well-oiled financial system. It also fosters real sector transactions effectively and is an outcome of geography, technology, social factors and politics (Carstens, 2018).[1] Asia Pacific region is in the process to emerge as a digital giant in near future (Evans, 2019).[2] It is in this context that the “Payment and Settlement Systems in India: Vision 2019 – 2021” released by the RBI on May 15 2019 assumes importance.[3]
Aiming at empowering all citizens with access to a bouquet of e-payment options the Payment Systems Vision 2021 had the core theme of ‘Empowering Exceptional (E) payment Experience’. Five features of such a payment system have been emphasized in particular: (a) safety; (b) security, (c) convenience, (d) fast pace and (e) affordability. Earlier, the RBI constituted a High-Level Committee on “Deepening of Digital Payments” under the Chairmanship of Nandan Nilekani in January 2019. This Committee too submitted its report on May 17 2019. While it might have been appropriate that this Vision Document could have been released after the acceptance (or otherwise) of this Committee report, the RBI in a press release mentioned that it would examine the recommendations of this Committee and will dovetail the action points, wherever necessary, in its Payment Systems Vision 2021, for implementation.
What are major constituents of this Vision? Does the Vision do justice to the current scenario of payment and settlement system in India? Is it capable of catering to the needs of an ever-growing economy? This present essay attempts to look into some of these questions.
Indian Payment System: Some Indicators
To put the vision document in context, it is important to review the trends in payments system in India.
Aggregate Trends
As far as the aggregate trend in payments system related indicators are concerned, India has experienced huge growth. Digital payment transaction turnover increased from 7.1 per cent of GDP in 2016 to 8.42 in 2018. The turnover in payment transactions too increased from 14.4 per cent of GDP in 2015-16 to to 15 per cent of GDP in 2017-18. Thus, the growth has taken place both in value and volume (Chart 1).
| Chart 1: Trends in Aggregate Payments Indicators |
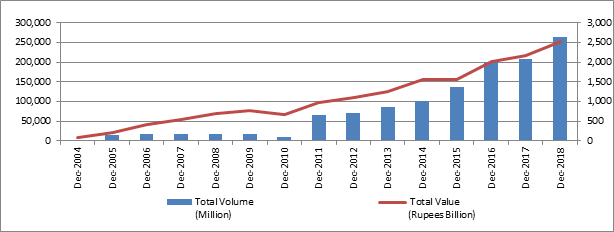 |
| Source: Online Database on India Economy, RBI. |
An analysis of the constituents of such digital payments reveals another interesting trend. The aggregate digital payments can be segregated in terms of the following major heads:
- RTGS (Real time gross settlement payments system) comprising: (a) Customer Transactions; (b) Interbank Transactions; and (c) Interbank Clearing.
- System operated by the CCIL (Clearing Corporation of India Ltd) comprising: (a) CBLO (collateralized borrowing and lending obligations); (b) Government Securities Clearing (viz., Outright, Repo and Tri-party Repo); and (c) Forex Clearing.
- Paper clearing of cheques.
- Retail electronic clearing (comprising (a) ECS (electronic clearing system) Debit; (b) ECS credit (including National Electronic Clearing Service or NECS); (c) EFT (Electronic Funds Transfer) / NEFT (National Electronic Funds Transfer); (d) Immediate Payment Service (IMPS); and (e) National Automated Clearing House (NACH)).
- Cards (comprising both credit and debit cards).
- Pre-paid payments instruments like mobile wallets.
| Table 1: Different Types of Payments: Volume and Value | |||||||||
| Month/Year | Customer RTGS Transactions | Interbank RTGS Transactions | CCIL Operated Systems | Paper Clearing | Retail Electronic Clearing | Cards | Prepaid Payment Instruments (PPIs) | Grand Total | |
| Volume (Million) | Dec-2004 | – | – | 0.1 | – | 4.6 | 14.9 | – | 19.6 |
| Dec-2005 | – | – | 0.1 | 113.5 | 7.3 | 18.7 | – | 139.4 | |
| Dec-2006 | 0.3 | 0.1 | 0.1 | 113.7 | 34.1 | 36.1 | – | 184.3 | |
| Dec-2007 | 0.4 | 0.1 | 0.1 | 124.3 | 18.5 | 28.3 | – | 171.7 | |
| Dec-2008 | 1.2 | 0.2 | 0.1 | 117.3 | 21.6 | 34.5 | – | 174.9 | |
| Dec-2009 | 3.0 | 0.2 | 0.1 | 117.7 | 24.8 | 35.9 | – | 181.8 | |
| Dec-2010 | 3.6 | 0.3 | 0.1 | 119.4 | 34.7 | 44.9 | – | 94.9 | |
| Dec-2011 | 4.7 | 0.4 | 0.2 | 107.1 | 42.0 | 501.9 | 3.1 | 659.3 | |
| Dec-2012 | 5.6 | 0.4 | 0.2 | 107.8 | 57.5 | 528.0 | 7.2 | 706.8 | |
| Dec-2013 | 6.6 | 0.4 | 0.2 | 107.1 | 100.1 | 628.6 | 10.8 | 853.8 | |
| Dec-2014 | 7.8 | 0.4 | 0.3 | 109.6 | 135.7 | 721.2 | 29.0 | 1003.9 | |
| Dec-2015 | 7.7 | 0.4 | 0.2 | 93.7 | 299.4 | 886.0 | 68.7 | 1356.1 | |
| Dec-2016 | 8.5 | 0.4 | 0.3 | 138.8 | 428.3 | 1162.4 | 261.1 | 1999.8 | |
| Dec-2017 | 10.6 | 0.3 | 0.3 | 96.4 | 470.0 | 1178.8 | 319.8 | 2076.2 | |
| Dec-2018 | 11.1 | 0.3 | 0.3 | 92.5 | 620.1 | 1460.2 | 441.8 | 2626.2 | |
| Value (Rupees Billion) | Dec-2004 | – | – | 7813.2 | – | 78.0 | 28.3 | – | 7919.5 |
| Dec-2005 | – | – | 10382.0 | 9959.3 | 82.5 | 33.8 | – | 20457.5 | |
| Dec-2006 | 7144.3 | 10246.9 | 13594.8 | 10061.9 | 1009.4 | 76.1 | – | 42133.4 | |
| Dec-2007 | 14140.5 | 7911.0 | 20900.8 | 11494.3 | 316.2 | 65.9 | – | 54828.7 | |
| Dec-2008 | 17339.7 | 10714.4 | 30908.3 | 9369.5 | 345.5 | 69.8 | – | 68747.3 | |
| Dec-2009 | 26980.7 | 7764.0 | 32836.0 | 8334.9 | 491.9 | 79.4 | – | 76486.8 | |
| Dec-2010 | 34500.1 | 11525.6 | 31450.6 | 8747.0 | 1216.5 | 104.5 | – | 67603.7 | |
| Dec-2011 | 37737.4 | 14182.9 | 34175.7 | 8188.0 | 1830.9 | 1376.5 | 6.4 | 97497.8 | |
| Dec-2012 | 44120.2 | 13157.7 | 39703.6 | 7914.9 | 2887.2 | 1642.9 | 8.2 | 109434.7 | |
| Dec-2013 | 50502.7 | 13347.6 | 47819.0 | 8584.3 | 4308.8 | 1917.5 | 7.2 | 126487.2 | |
| Dec-2014 | 57669.3 | 11074.7 | 70943.4 | 7488.3 | 6044.4 | 2285.2 | 22.7 | 155528.0 | |
| Dec-2015 | 58712.6 | 10211.4 | 69114.6 | 6935.6 | 8880.0 | 2565.1 | 44.3 | 156463.7 | |
| Dec-2016 | 72702.6 | 11393.9 | 95947.7 | 7289.4 | 12683.2 | 1742.0 | 97.7 | 201856.5 | |
| Dec-2017 | 90557.8 | 10350.0 | 88062.7 | 6752.5 | 17464.7 | 3470.0 | 143.3 | 216800.9 | |
| Dec-2018 | 101338.6 | 15085.2 | 102273.2 | 6687.4 | 22268.7 | 4215.6 | 189.2 | 252057.9 | |
| Source: Online Database on India Economy, RBI. | |||||||||
While the amounts are dominated by high value transactions comprising Customer RTGS Transactions, Interbank RTGS Transactions, and CCIL Operated Systems, in terms of volume, smaller transactions as captured by paper clearing of cheques, retail electronic clearing, credit and debit cards and prepaid payment instruments tended to dominate (Table 1).
Debit and Credit Cards
The situation in case of credit and debit cards is most instructive in this context. The total value of credit card and debit card transactions as of end 2018 stood at Rs. 546.4 billion and Rs. 3669.2 billion, respectively; these are merely 0.5 per cent and 3 per cent, respectively, of aggregate deposits of scheduled commercial banks (Table 2). That is to say, retail penetration of these instruments is still quite low and there is ample scope of their increasing usage.
| Table 2: Usage of Credit and Debit Cards: Volume (in Million) and Value (in INR Billion) | ||||||||||||
| 1. Credit Cards | 1a) Usage at ATMs | 1) Usage at POS | 2) Debit Cards | 2a) Usage at ATMs | 2b) Usage at POS | |||||||
| Volume (Mill) |
Value (INR Billion) |
Volume (Mill) |
Value (INR Billion) |
Volume (Mill) |
Value (INR Billion) |
Volume (Mill) |
Value (INR Billion) |
Volume (Mill) |
Value (INR Billion) |
Volume (Mill) |
Value (INR Billion) |
|
| Dec-2004 | 11.3 | 23.8 | – | – | 11.3 | 23.8 | 3.5 | 4.6 | – | – | 3.5 | 4.6 |
| Dec-2005 | 14.6 | 28.7 | – | – | 14.6 | 28.7 | 4.0 | 5.1 | – | – | 4.0 | 5.1 |
| Dec-2006 | 15.2 | 38.8 | – | – | 15.2 | 38.8 | 20.9 | 37.2 | – | – | 20.9 | 37.2 |
| Dec-2007 | 20.3 | 53.6 | – | – | 20.3 | 53.6 | 8.1 | 12.3 | – | – | 8.1 | 12.3 |
| Dec-2008 | 22.6 | 53.1 | – | – | 22.6 | 53.1 | 11.9 | 16.7 | – | – | 11.9 | 16.7 |
| Dec-2009 | 20.5 | 55.1 | – | – | 20.5 | 55.1 | 15.4 | 24.3 | – | – | 15.4 | 24.3 |
| Dec-2010 | 23.5 | 68.5 | – | – | 23.5 | 68.5 | 21.4 | 36.1 | – | – | 21.4 | 36.1 |
| Dec-2011 | 28.3 | 85.3 | 0.2 | 1.1 | 28.2 | 84.2 | 473.6 | 1,291.2 | 444.2 | 1,242.4 | 29.4 | 48.8 |
| Dec-2012 | 36.3 | 112.6 | 0.2 | 1.2 | 36.1 | 111.3 | 491.7 | 1,530.3 | 448.6 | 1,461.2 | 43.1 | 69.1 |
| Dec-2013 | 45.9 | 136.6 | 0.3 | 1.5 | 45.6 | 135.1 | 582.6 | 1,781.0 | 530.4 | 1,699.0 | 52.3 | 81.9 |
| Dec-2014 | 56.5 | 174.4 | 0.4 | 2.5 | 56.1 | 171.9 | 664.7 | 2,110.8 | 591.1 | 1,999.8 | 73.6 | 111.0 |
| Dec-2015 | 69.9 | 214.7 | 0.5 | 2.8 | 69.4 | 211.9 | 816.1 | 2,350.4 | 708.0 | 2,204.6 | 108.1 | 145.8 |
| Dec-2016 | 116.5 | 312.4 | 0.4 | 0.9 | 116.1 | 311.5 | 1,045.9 | 1,429.7 | 630.5 | 849.3 | 415.5 | 580.3 |
| Dec-2017 | 124.5 | 422.0 | 0.7 | 3.3 | 123.8 | 418.6 | 1,054.3 | 3,048.0 | 761.9 | 2,640.4 | 292.4 | 407.6 |
| Dec-2018 | 159.2 | 546.4 | 0.9 | 4.0 | 158.3 | 542.3 | 1,301.0 | 3,669.2 | 914.3 | 3,139.0 | 386.7 | 530.2 |
RBI Vision Document
It is in this context that the RBI Vision document assumes much importance. Focusing on a two-pronged approach of (a) achieving exceptional customer experience; and (b) enabling an eco-system that will result in this customer experience, the Vision emphasized the following goals, viz., (a) enhancing the experience of Customers; (b) empowering payment System Operators and Service Providers; (c) enabling the Eco-system and Infrastructure; (d) putting in place a Forward-looking Regulation, supported by a Risk-focused Supervision. Thirty six goals posts of the Vision are grouped under the 4C’s: (a) competition; (b) cost; (c) convenience; and (d) confidence (Table 3).
| Table 3: Goals-Posts For Payment System Vision 2021 | |||
| Competition | Cost | Convenience | Confidence |
| 1. Self-Regulatory Organization for all PSOs.
2. Encourage and facilitate innovation in an environment of collaborative competition 3. Feature phone- based payment services. 4. Off-line payment solutions. 5. USSD-based payment services. 6. Global outreach of payment systems. 7. Fostering innovation in a responsible environment through regulatory sandbox. 8. Review of membership to centralized payment systems 9. Inter-regulatory and intra-regulatory co-ordination 10. Benchmarking India’s Payment Systems |
1. Accessible, affordable and inclusive services
2. Review of corridors and charges for inbound cross border remittances 3. Inter-operability and building capability to process transactions of one system in another system 4. Acceptance infrastructure to address supply-side issues 5. System capacity and scalability 6. Increasing LEI usage for large value cross border payments 7. Regulation of payment gateway service providers and payment aggregators |
1. Harmonizing TAT for resolution of customer complaints
2. Setting up a 24×7 helpline 3. Enhancing awareness 4. Conducting customer awareness surveys 5. Internal ombudsman for digital payments 6. National settlement services for card schemes 7. Enhanced availability of retail payment systems and a wide bouquet of offerings 8. Widen scope / use of domestic cards 9. Explore adoption of newer technologies including DLT for enhancement of digital payment services 10. E-mandates / Standing Instructions for payment transactions |
1. Increased coverage of the Cheque Truncation System
2. Increased scope and coverage of the Trade Receivables Discounting System (TReDS) 3. Geo-tagging of payment system touch points 4. Contact-less payments and tokenization 5. Enhanced security of mobile-based payments 6. Oversight for maintaining integrity of payment systems 7. Third party risk management and system wide security 8. Framework for collection of data on frauds in payment systems 9. Framework for testing resilience of payment systems |
| Abbreviations: PSO: Payment System Operators; USSD: unstructured supplementary service data; LEI: Legal Entity Identifier; TAT: Turn Around Time.
Source: RBI |
|||
Way Ahead
The Vision document appears to be comprehensive as well as ambitious. Aiming at achieving a highly digital and cash-lite economy, the Vision perhaps emphasized that the RBI needs to adopt a minimalist intervention strategy without compromising on the safety and security aspects of the transactions. Is it too ambitious in expecting that the number of digital transactions would increase to 8,707 crore by December 2021? Will it solve the traumatic experience of getting the KYC norms fulfilled by an average e-wallet user? Are the internal trade-offs between the objectives of the 4C’s get settled? Will it democratize the payments eco-system? Will the system become a hostage of a few big players in the e-payments space? Why is it silent on some of the contemporary issues like crypto-currencies? Hopefully, clarity will emerge to such questions in the days to come.
*******
[1] Carstens, Agustín (2018): “Money and payment systems in the digital age”, Speech by General Manager, Bank for International Settlements Finance and Global Economics Forum of the Americas University of Miami Business School, November 1, 2018.
[2] Evans, Michelle (2019): “Digitalisation in Asia How One Region Is Shaping Worldwide Trends”, Euro Monitor International.
[3]Available at https://rbidocs.rbi.org.in/rdocs/PublicationReport/