Tale of Direct Tax Collections in India
Ashok Banerjee Download Article
The Central Board of Direct Tax (CBDT) has published[1], for the first time, time series data on direct and indirect tax collection in the country, including number of tax payers and pending income tax cases. The publication also provides data on state-wise tax collections. The period covered (2000-2015) includes pre-crisis and post crisis period. For example, the direct tax-to-GDP ratio reached a peak of 6.3% during 2007-08 (immediately before global financial crisis) and then witnessed continuous decline reporting only 5.47% in 2015-16. Globally, similar trend was observed (Table 1). Tax revenue (% of GDP) was 27.8% in UK during 2008 and the figure was only 25.4% in 2013- five years after the crisis. In other words, the UK economy was struggling regain its business buoyancy. Brazil reported more than 1 percentage point drop in the ratio after recession. There are two principal reasons for rise or fall in this indicator: (a) changes in economic activity (affecting levels of employment, commercial transactions); and (b) changes in tax legislation (affecting tax rates, exemptions, tax base etc.) In order to boost revenue, several governments (e.g., Greece) have increased the tax rates thereby improving the ratio. The tax revenue (% of GDP) of Greece was lower in post-crisis. However, if such steeper tax rates are not backed by improved economic environment it does not augur well for the economy. Latest results show that lower tax regime may fuel economic growth. The argument for higher tax-to-GDP ratio, on the other hand, is to support infrastructure development. Tax revenue (% of GDP) of European Union (aggregate of 28 countries) was 40% in 2014- marginally up by 0.1 percentage point from 2013[2].
Interestingly number of income tax cases did not change much over the last one and half decade. The figure was 32.7 million in 2000-01 and the final count of number of assessments in 2014-15 was marginally lower to 31.8 million. Number of cases reached a peak in 2009-10 at 52.2 million. The efficiency of the income tax department, measured by the proportion of cases disposed during the same year, has reasonably improved during this period. It was 59% in 2000-01 and rose to 68% during 2014-15. Data also show that tax payers were making significant part of tax payments before assessment. Post assessment tax as percentage of total direct tax (excluding other receipts) receipts was 10.8% in 2000-01 and the figure remained almost same at 11.1% in 2014-15. Another interesting feature in the data set is cost of collection of direct tax. It has declined from 1.36% (2000-01) to 0.59% (2014-15). This has been possible mainly due to use of technology in tax administration. During the last four years (2011-12 through 2014-15), number of assessees has increased by around 8 million driven mainly by Individual assessees (7.8 million). Growth in number of corporate and partnership firm assessees during this period was, however, only 13% and the growth rate for Individual assessees was close to 20%. This implies that economic activity in the country was sluggish during the first four years of the present decade.
Table 1: Tax Revenue (% of GDP)
| Country | 2007 | 2008 | 2011 | 2012 | 2013 |
| Australia | – | 24.3 | 20.4 | 21.3 | 22.2 |
| Brazil | 15.8 | 15.5 | 14.9 | 14.1 | – |
| China | 9.8 | 10.2 | 10.4 | – | – |
| Denmark | 35.1 | 33.5 | 33.0 | 33.6 | 35.1 |
| Germany | 11.3 | 11.4 | 11.4 | 11.6 | 11.6 |
| Greece | 20.2 | 20.2 | 21.7 | 22.9 | 22.8 |
| India | 11.9 | 10.8 | 9.0 | 10.8 | – |
| Japan | – | – | 9.8 | 10.1 | 10.9 |
| Netherlands | 21.9 | 21.4 | 20.4 | 19.6 | 20.0 |
| Russia | 16.6 | 15.8 | 15.0 | 15.1 | 14.3 |
| Singapore | 12.9 | 13.9 | 13.3 | 13.8 | – |
| South Africa | 27.6 | 26.8 | 24.6 | 25.0 | 25.5 |
| Sweden | 28.4 | 27.0 | 26.5 | 26.1 | 26.3 |
| Thailand | 15.1 | 15.4 | 16.4 | 15.4 | 17.3 |
| UK | 26.6 | 27.8 | 26.2 | 25.5 | 25.4 |
| US | 11.5 | 10.0 | 9.6 | 9.8 | 10.5 |
Source: World Bank [http://data.worldbank.org/indicator/GC.TAX.TOTL.GD.ZS]
Tax revenue refers to compulsory transfer to the central government for public purposes.
Distribution of Total Tax Collections
Total (direct and indirect) tax collection has grown at a compound annual rate (CAGR) of 14.6% in last fifteen years (Table 2). The growth is not caused entirely by inflation. The real growth in total tax collection was 10.4% suggesting buoyancy in economic indicators during this period. Share of direct tax has increased over the period and the same for indirect tax declined. Wider tax base and rationalization of indirect tax rates have led to fall in the share of indirect taxes. The fall in indirect tax share is more noticeable after 2007-08 when the government had announced financial stimulus package to boost productivity and growth. One interesting feature of indirect tax, which comprise of excise duties, customs duty and service tax, is that the share of service tax is on the rise with the increase in service tax rate and more services being brought under service tax net. In order to promote growth in manufacturing sector, one may witness further reduction in the share of excise duties and increase in the share of service tax. For example, during 2014-15 excise duties contributed 1.52% of GDP and service tax is fast catching up with 1.35% of GDP. Personal tax (% of direct tax) has declined suggesting that share of corporate and (partnership) firm taxes have increased over the past fifteen years. The indirect tax component is steadier with a coefficient of variation lower than direct tax during the past fifteen years.
Table 2: Nominal and Real Tax
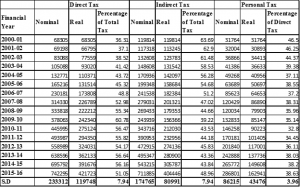
Nominal and Real tax figures are in Rs. Crore. Real tax figures are WPI-adjusted.
Top Tax paying States
The state of Gujarat has figured in the top five list for the first time in 2014-15 toppling Andhra Pradesh (including Telengana). The other four states have retained their positions over the past five years (Table 3). The top five states have consistently been contributing about three-fourths of national direct tax. Maharashtra led the show with close to 40% share and the next state (Delhi) is way behind with about 14%-16% share. In fact the share of Delhi has declined over the years, whereas Tamil Nadu and Karnataka have maintained their share.
Table 3: Contribution of Top Five States to Direct Tax
| 2008-09 | 2009-10 | 2010-11 | 2011-12 | 2012-13 | 2013-14 | 2014-15 |
| Andhra Pradesh (5.31) | Andhra Pradesh (5.07) | Andhra Pradesh (5.27) | Andhra Pradesh (5.37) | Andhra Pradesh (5.46) | Andhra Pradesh (5.15) | Gujarat
(5.25)
|
| Karnataka (8.30) | Karnataka (7.92) | Karnataka (8.17) | Karnataka (8.74) | Karnataka (8.94) | Karnataka (9.54) | Karnataka
(8.86)
|
| Maharashtra
(39.40) |
Maharashtra (39.42) | Maharashtra (39.88) | Maharashtra (37.84) | Maharashtra (36.84) | Maharashra (36.62) | Maharashtra (40.62)
|
| Delhi(16.62) | Delhi(16.15) | Delhi(14.64) | Delhi(14.60) | Delhi(14.425) | Delhi (14.06) | Delhi (13.34)
|
| Tamil Nadu(6.27) | Tamil Nadu(6.57) | Tamil Nadu(6.48) | Tamil Nadu(6.04) | Tamil Nadu(6.02) | Tamil Nadu(6.81) | Tamil Nadu
(6.54)
|
| Total(76.33) | Total(75.13) | Total(74.44) | Total (72.60) | Total(71.70) | Total (72.18) | Total
(74.62)
|
Figures in bracket denote percentage share. Figures do not include collections of Union Territories.
Factors driving Tax Collections
There are several factors that affect tax collection. Notable among them are trade openness, per capital income, tax rates, economic buoyancy, inflation and even corruption/leakage. Most studies find that per capita GDP and degree of openness is positively related to revenue performance, but a higher agriculture share lowers it[3]. Any emerging economy has to calibrate the tax rate very careful in order not to hurt the sentiments of foreign investors, particularly the FDI. Though higher tax mop is desirable for any developing country committed to build social infrastructure, greater tax incidence is generally accompanied with tax avoidance, lower capital formation by private sector etc. Ideally, lower tax rates and surge in economic activities should generate higher tax collection. The dataset published by the CBDT has details on three indicators that may have bearing on direct tax collection- indirect tax (% of total tax), cost of collection and buoyancy. The first indicator would imply general economic activity in terms of industrial output, services, and international trade. Cost of collection would naturally have negative impact of tax collection. Tax buoyancy indicates elasticity of direct tax with respect to GDP. It is observed (Table 4) that indirect tax and cost of direct tax collection are highly correlated. There is no rational for such correlation. Hence, in the regression analysis, the indirect tax variable is dropped.
Table 4: Correlation Matrix
| Variables | Indirect tax (%) | Buoyancy | Cost of collection |
| Indirect tax (%) | 1 | 0.461 | 0.872 |
| Buoyancy | 0.461 | 1 | 0.216 |
| Cost of collection | 0.872 | 0.216 | 1 |
Note: Buoyancy indicates growth in tax revenue for per unit growth in GDP.
We run a regression using the following model:
∆Direct Taxt= αo + β1* Cost of Collectiont+ β2* Buoyancyt
Direct tax time series is non stationary and even a (log) transformation of the same does not make the series stationary. Hence, we have considered change in (log) direct tax as dependent variable. The signs of coefficients explain the relationship with the dependent variable. Buoyancy has a significant positive relationship with the growth in tax collection. The model explains about 80% of variations in direct tax collections with an adjusted R2 of 0.8.
Table 5: Regression Results
| Variable | Coefficient | t-stat | p-value |
| Constant | 0.084 | 2.145 | 0.053 |
| Cost of collection | -9.05 | -2.017 | 0.067 |
| Buoyancy | 0.108 | 7.51 | 0.000 |
The decision of CBDT in publishing direct tax data is laudable as one gets great insight into the growth in tax collection, contribution of states and effectiveness of income tax department in disposing cases. However, a more granular data would help researchers. For example, information on state’s contribution to indirect tax, and service tax collections.
******
*The author acknowledges the help of Ms. Reshma Sinha Ray, TTA of IIM Calcutta in tabulating data.
[1] www.incometaxindia.gov.in/Documents/Time-Series-Data-Final.pdf
[2] http://ec.europa.eu/eurostat/statistics-explained/index.php/Tax_revenue_statistics
[3] Abhijit Sengupta, 2007, Determinants of Tax Revenue Efforts in Developing Countries, IMF Working Paper No. WP/07/184