Tale of Direct Tax Collections in India

The Central Board of Direct Tax (CBDT) has published[1], for the first time, time series data on direct and indirect tax collection in the country, including number of tax payers and pending income tax cases. The publication also provides data on state-wise tax collections. The period covered (2000-2015) includes pre-crisis and post crisis period.  For example, the direct tax-to-GDP ratio reached a peak of 6.3% during 2007-08 (immediately before global financial crisis) and then witnessed continuous decline reporting only 5.47% in 2015-16. Globally, similar trend was observed (Table 1). Tax revenue (% of GDP) was 27.8% in UK during 2008 and the figure was only 25.4% in 2013- five years after the crisis. In other words, the UK economy was struggling regain its business buoyancy. Brazil reported more than 1 percentage point drop in the ratio after recession. There are two principal reasons for rise or fall in this indicator: (a) changes in economic activity (affecting levels of employment, commercial transactions); and (b) changes in tax legislation (affecting tax rates, exemptions, tax base etc.) In order to boost revenue, several governments (e.g., Greece) have increased the tax rates thereby improving the ratio. The tax revenue (% of GDP) of Greece was lower in post-crisis. However, if such steeper tax rates are not backed by improved economic environment it does not augur well for the economy. Latest results show that lower tax regime may fuel economic growth. The argument for higher tax-to-GDP ratio, on the other hand, is to support infrastructure development. Tax revenue (% of GDP) of European Union (aggregate of 28 countries) was 40% in 2014- marginally up by 0.1 percentage point from 2013[2].

Interestingly number of income tax cases did not change much over the last one and half decade. The figure was 32.7 million in 2000-01 and the final count of number of assessments in 2014-15 was marginally lower to 31.8 million. Number of cases reached a peak in 2009-10 at 52.2 million. The efficiency of the income tax department, measured by the proportion of cases disposed during the same year, has reasonably improved during this period. It was 59% in 2000-01 and rose to 68% during 2014-15. Data also show that tax payers were making significant part of tax payments before assessment. Post assessment tax as percentage of total direct tax (excluding other receipts) receipts was 10.8% in 2000-01 and the figure remained almost same at 11.1% in 2014-15. Another interesting feature in the data set is cost of collection of direct tax. It has declined from 1.36% (2000-01) to 0.59% (2014-15). This has been possible mainly due to use of technology in tax administration. During the last four years (2011-12 through 2014-15), number of assessees has increased by around 8 million driven mainly by Individual assessees (7.8 million). Growth in number of corporate and partnership firm assessees during this period was, however, only 13% and the growth rate for Individual assessees was close to 20%. This implies that economic activity in the country was sluggish during the first four years of the present decade.

Table 1: Tax Revenue (% of GDP)

Country 2007 2008 2011 2012 2013
Australia 24.3 20.4 21.3 22.2
Brazil 15.8 15.5 14.9 14.1
China 9.8 10.2 10.4
Denmark 35.1 33.5 33.0 33.6 35.1
Germany 11.3 11.4 11.4 11.6 11.6
Greece 20.2 20.2 21.7 22.9 22.8
India 11.9 10.8 9.0 10.8
Japan 9.8 10.1 10.9
Netherlands 21.9 21.4 20.4 19.6 20.0
Russia 16.6 15.8 15.0 15.1 14.3
Singapore 12.9 13.9 13.3 13.8
South Africa 27.6 26.8 24.6 25.0 25.5
Sweden 28.4 27.0 26.5 26.1 26.3
Thailand 15.1 15.4 16.4 15.4 17.3
UK 26.6 27.8 26.2 25.5 25.4
US 11.5 10.0 9.6 9.8 10.5

Source: World Bank [http://data.worldbank.org/indicator/GC.TAX.TOTL.GD.ZS]

Tax revenue refers to compulsory transfer to the central government for public purposes.


Distribution of Total Tax Collections

Total (direct and indirect) tax collection has grown at a compound annual rate (CAGR) of 14.6% in last fifteen years (Table 2). The growth is not caused entirely by inflation. The real growth in total tax collection was 10.4% suggesting buoyancy in economic indicators during this period. Share of direct tax has increased over the period and the same for indirect tax declined. Wider tax base and rationalization of indirect tax rates have led to fall in the share of indirect taxes. The fall in indirect tax share is more noticeable after 2007-08 when the government had announced financial stimulus package to boost productivity and growth. One interesting feature of indirect tax, which comprise of excise duties, customs duty and service tax, is that the share of service tax is on the rise with the increase in service tax rate and more services being brought under service tax net. In order to promote growth in manufacturing sector, one may witness further reduction in the share of excise duties and increase in the share of service tax. For example, during 2014-15 excise duties contributed 1.52% of GDP and service tax is fast catching up with 1.35% of GDP. Personal tax (% of direct tax) has declined suggesting that share of corporate and (partnership) firm taxes have increased over the past fifteen years. The indirect tax component is steadier with a coefficient of variation lower than direct tax during the past fifteen years.

Table 2: Nominal and Real Tax

1

Nominal and Real tax figures are in Rs. Crore. Real tax figures are WPI-adjusted.

Top Tax paying States

The state of Gujarat has figured in the top five list for the first time in 2014-15 toppling Andhra Pradesh (including Telengana). The other four states have retained their positions over the past five years (Table 3). The top five states have consistently been contributing about three-fourths of national direct tax. Maharashtra led the show with close to 40% share and the next state (Delhi) is way behind with about 14%-16% share. In fact the share of Delhi has declined over the years, whereas Tamil Nadu and Karnataka have maintained their share.


Table 3: Contribution of Top Five States to Direct Tax

2008-09 2009-10 2010-11 2011-12 2012-13 2013-14 2014-15
Andhra Pradesh (5.31) Andhra Pradesh (5.07) Andhra Pradesh (5.27) Andhra Pradesh (5.37) Andhra Pradesh (5.46) Andhra Pradesh (5.15) Gujarat

(5.25)


Karnataka (8.30) Karnataka (7.92) Karnataka (8.17) Karnataka (8.74) Karnataka (8.94) Karnataka (9.54) Karnataka

(8.86)


Maharashtra

(39.40)

Maharashtra (39.42) Maharashtra (39.88) Maharashtra (37.84) Maharashtra (36.84) Maharashra (36.62) Maharashtra (40.62)


Delhi(16.62) Delhi(16.15) Delhi(14.64) Delhi(14.60) Delhi(14.425) Delhi (14.06) Delhi (13.34)


Tamil Nadu(6.27) Tamil Nadu(6.57) Tamil Nadu(6.48) Tamil Nadu(6.04) Tamil Nadu(6.02) Tamil Nadu(6.81) Tamil Nadu

(6.54)


Total(76.33) Total(75.13) Total(74.44) Total (72.60) Total(71.70) Total (72.18) Total

(74.62)


Figures in bracket denote percentage share. Figures do not include collections of Union Territories.


Factors driving Tax Collections

There are several factors that affect tax collection. Notable among them are trade openness, per capital income, tax rates, economic buoyancy, inflation and even corruption/leakage.  Most studies find that per capita GDP and degree of openness is positively related to revenue performance, but a higher agriculture share lowers it[3].  Any emerging economy has to calibrate the tax rate very careful in order not to hurt the sentiments of foreign investors, particularly the FDI. Though higher tax mop is desirable for any developing country committed to build social infrastructure, greater tax incidence is generally accompanied with tax avoidance, lower capital formation by private sector etc. Ideally, lower tax rates and surge in economic activities should generate higher tax collection.  The dataset published by the CBDT has details on three indicators that may have bearing on direct tax collection- indirect tax (% of total tax), cost of collection and buoyancy. The first indicator would imply general economic activity in terms of industrial output, services, and international trade. Cost of collection would naturally have negative impact of tax collection. Tax buoyancy indicates elasticity of direct tax with respect to GDP. It is observed (Table 4) that indirect tax and cost of direct tax collection are highly correlated. There is no rational for such correlation.  Hence, in the regression analysis, the indirect tax variable is dropped.

Table 4: Correlation Matrix

Variables Indirect tax (%) Buoyancy Cost of collection
Indirect tax (%) 1 0.461 0.872
Buoyancy 0.461 1 0.216
Cost of collection 0.872 0.216 1

Note: Buoyancy indicates growth in tax revenue for per unit growth in GDP.

We run a regression using the following model:

∆Direct Taxt= αo + β1* Cost of Collectiont+ β2* Buoyancyt

Direct tax time series is non stationary and even a (log) transformation of the same does not make the series stationary. Hence, we have considered change in (log) direct tax as dependent variable. The signs of coefficients explain the relationship with the dependent variable. Buoyancy has a significant positive relationship with the growth in tax collection. The model explains about 80% of variations in direct tax collections with an adjusted R2 of 0.8.


Table 5: Regression Results

Variable Coefficient t-stat p-value
Constant 0.084 2.145 0.053
Cost of collection -9.05 -2.017 0.067
Buoyancy 0.108 7.51 0.000

The decision of CBDT in publishing direct tax data is laudable as one gets great insight into the growth in tax collection, contribution of states and effectiveness of income tax department in disposing cases. However, a more granular data would help researchers. For example, information on state’s contribution to indirect tax, and service tax collections.

******

*The author acknowledges the help of Ms. Reshma Sinha Ray, TTA of IIM Calcutta in tabulating data.

[1] www.incometaxindia.gov.in/Documents/Time-Series-Data-Final.pdf

[2] http://ec.europa.eu/eurostat/statistics-explained/index.php/Tax_revenue_statistics

[3] Abhijit Sengupta, 2007, Determinants of Tax Revenue Efforts in Developing Countries, IMF Working Paper No. WP/07/184

Bank Board Bureau: A Bold Step or the Old Wine in a New Bottle?

The issue of selection of senior management in the public sector banks has attracted quite a bit of attention in recent times. As part of the Indradhanush proposal for public sector banks announced on Aug 14, 2015, the Ministry of Finance (Department of Financial Services) has decided to separate the post of Chairman and Managing Director. It prescribed that in the subsequent vacancies, the CEO will get the designation of MD & CEO and there would be another person who would be appointed as non-Executive Chairman of PSBs. The proposal also emphasized that the selection process for both these positions would be “transparent and meritocratic”. Consequently, private sector candidates were also allowed to apply for the position of MD & CEO of the five top banks (such as, Punjab National Bank, Bank of Baroda, Bank of India, IDBI Bank and Canara Bank).  But what would ensure professionalism in selection of the senior management of the public sector banks? It is in this context, that idea of Bank Bureau Board (BBB) has been floated in recent times.

To put the matter in perspective, it may be useful to recall that the idea of Bank Bureau Board came from a key recommendation of the Report of the RBI Committee to Review Governance of Boards of Banks in India (Chairman: P J Nayak), which was submitted in May 2014. The Nayak Committee Report mentioned categorically,

“The process of board appointments, including appointments of whole-time directors, needs to be professionalised and a three-phase process is envisaged. In the first phase, until BIC (Bank Investment Company)[1] becomes operational, a Bank Boards Bureau (BBB) comprising former senior bankers should advise on all board appointments, including those of Chairmen and Executive Directors. In the second phase this function would be undertaken by BIC, which would also actively strive to professionalise bank boards. In the third phase BIC would move several of its powers to the bank boards. The duration of this three-phase transition is expected to be between two and three years.”

Subsequently, the Finance Minister Mr Arun Jaitley in his 2015-16 Budget Speech (February 28, 2015) announced an intention to set up an autonomous bank Board Bureau (BBB). It was mentioned, “The Bureau will search and select heads of Public Sector banks and help them in developing differentiated strategies and capital raising plans through innovative financial methods and instruments. This would be an interim step towards establishing a holding and investment Company for Banks.”

Later the Indradhanush proposal for public sector banks of August 2015, it was further announced that, “The BBB will be a body of eminent professionals and officials, which will replace the Appointments Board for appointment of Whole-time Directors as well as non-Executive Chairman of PSBs. They will also constantly engage with the Board of Directors of all the PSBs to formulate appropriate strategies for their growth and development.” The structure of the BBB was conceived to be as follows: a Chairman and six more members of whom three will be officials and three experts (of which two would necessarily be from the banking sector)”. It was categorically stated that the Search Committee for members of the BBB would comprise the RBI Governor, Secretary (Financial Services, Ministry of Finance) and Secretary (Department of Personnel & Training, Government of India) as members and that the members would be selected in the next six months and the BBB will start functioning from the April 1 2016.

More recently, in end February 2016, Vinod Rai, former Comptroller and Auditor General of India, was named the first chairman of the BBB. Finally, the government set up the BBB in April 2016. The other members of the board included, Anil K. Khandelwal, a former chairman of Bank of Baroda; H.N. Sinor, a former joint managing director of ICICI Bank; and Roopa Kudva, a former managing director of rating company Crisil. The tenure of the Chairman and other members of the BBB will be of two years. Besides these members, as announced in the Indradhanus proposals, there are two representatives from the government: Secretary, Department of Financial Services (Ministry of Finance), and Secretary, Department of Public Enterprises. The Deputy Governor of the RBI will also be there in the BBB.

While members of the BBB are people of eminence with impeccable integrity and reputation, there are issues about its potential effectiveness.  Illustratively, presence of a large number of Civil Servants could be an issue. More interestingly, inclusion of the Secretary (Financial Services) both a member of the Selection Committee of the members of the BBB as well as a member of BBB may appear to be odd. After all, how different is the BBB from the current practice of Appointments Board? How can government interference be minimized in the appointment process? Such questions seem to be blowing in the wind.

More fundamentally, at the current juncture when the Indian public sector banks are plagued with the problem of non-performing assets and there are allegations of governance issues in select banks as a factor behind formation of such NPAs, there is an imperative for making the Bank Boards more accountable. But can that accountability come with the formation of BBB? Or, will such accountability need more fundamental reforms like divestiture of public sector banks that can make the banks subject to more market disciplines? Till such accountability process appears, formation of BBB can be a second-best solution. Nevertheless, to drive balance sheet improvement and consolidation in the banking sector, at the current juncture we need to wait for further actions of the BBB.

*****

[1] Nayak Committee recommended that Government should setup a Bank Investment Company (BIC), under Companies act, 2013 as a “Core investment company” and then should transfer its shares of public sector banks, to BIC. Finally, all public sector banks would be registered as ‘subsidiary companies’ of BIC, under Companies act. Since BIC would held more than 50 per cent shares in those company, BIC will be the parent “Holding” company and those banks became BIC’s subsidiary companies.

The Changing Dynamics of Debt Financing in India

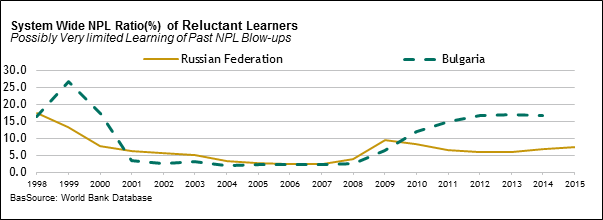
Debt financing basically refers to a business raising capital (operating or other) by borrowing. The global financial crisis (GFC) that originated in the credit markets of advanced economies (AEs) and the massive liquidity enhancing measures taken by the major central banks to counter, it has ironically resulted in higher levels of borrowing in all major economies relative to GDP than they did in 2007. The GFC has also altered the financing decisions of corporates in emerging economies (EMEs) like India with increasing debt financing accompanied by slackening in bank financing.

As per the International Monetary Fund (IMF), gross debt of governments globally has increased significantly since the crisis (end of 2007). General government gross debt as percent of GDP in G20 advances countries have elevated by 46% between 2007 and 2015 to 112.54% and is expected to peak to 114.60% in 2016. IMF, in its World Economic Outlook (April 2016), had expressed deep concern about debt rising to an unsustainable levels in some countries following stagnation in world economy.

  General government gross debt as Percent of GDP
Country 2006 2007 2008 2009 2010 2011 2012 2013 2014 2015 2016 2017 2018
Australia 9.96 9.68 11.74 16.76 20.50 24.24 27.86 30.72 34.26 38.08 40.15 41.38 41.58
Brazil 65.84 63.80 61.91 65.04 63.03 61.23 63.54 62.22 65.22 69.90 74.48 75.78 76.53
China 32.23 34.64 31.59 36.01 35.60 37.05 39.42 41.14 43.20 45.98 48.27 50.04
France 64.24 64.19 67.85 78.76 81.46 84.95 89.23 92.42 95.14 97.01 98.06 97.93 96.94
Germany 66.26 63.46 64.90 72.39 80.25 77.64 79.04 76.86 73.11 69.50 66.63 64.11 61.64
India 77.11 74.03 74.54 72.53 67.46 68.10 67.45 65.81 66.07 65.26 63.89 62.80 61.72
Japan 186.00 183.01 191.81 210.25 215.95 229.84 236.76 242.59 246.42 246.14 246.96 248.58 249.55
Russia 10.50 8.61 7.98 10.63 11.35 11.64 12.66 14.03 17.82 20.40 21.04 21.94 22.78
United Kingdom 42.53 43.63 51.78 65.81 76.39 81.83 85.82 87.31 89.54 91.15 91.65 90.75 88.95
United States 63.64 64.01 72.83 86.04 94.76 99.11 102.39 103.42 104.77 105.06 104.91 104.25 103.62
*Estimates Start after 2015.
International Monetary Fund, Fiscal Monitor Database, April 2016


According to Bank for International Settlement (BIS), while public debt has increased significantly in AEs, private debt has also increased in EMEs. The debt of non-financial companies in EMEs has grown so rapidly that in 2013 it overtook that of AEs, as a proportion of GDP. Since then, the corporate debt of EMEs as a proportion of GDP has pulled ahead of that in the AEs even further. Corporate leverage in EMEs has risen in general while simultaneously the general profitability of EME non-financial companies has fallen. Following tables provide the glimpse of such developments over the years.

Total Credit to the Non-financial Sector as a Percentage of GDP
Country 2011 2012 2013 2014 2015 (till Q2)
Australia 203.7 211.0 220.0 231.5 238.4
Brazil 122.1 130.4 132.8 138.5 142.9
China 187.7 203.0 220.0 234.2 243.7
Euro area 253.9 265.2 263.9 270.8 269.8
India 125.0 126.9 126.4 125.4 126.8
Japan 369.1 374.1 382.4 392.7 387.3
United Kingdom 273.0 276.7 261.9 265.7 260.9
United States 250.5 250.9 247.3 250.0 247.5

Source: Bank for International Settlement

Amount Outstanding of Debt Securities (in $ billion)
  India China US
  Q4-2007 Q4-2014 Q3-2015 Q4-2007 Q4-2014 Q3-2015 Q4-2007 Q4-2014 Q3-2015
Domestic debt securities 425.1 684.4 NA (699.4 till Q2) 1688.1 5772.2 NA (6524.7 till Q2) 28384.7 35797.3 NA (36278.4 till Q2)
International debt securities by National Issuers (in USD)                  
a) Banks 14.0 35.6 35.4 5.0 79.3 90.8 497.8 395.1 432.5
b) Other financial corporations 0.0 2.6 2.6 5.8 32.8 46.0 1279.2 1319.0 1359.0
c) Non-financial corporations 21.2 36.3 39.3 14.0 191.8 229.8 291.3 396.5 453.3

Source: Bank for International Settlement

The GFC in AEs has been accompanied by changes in the financial set-up in EMEs. New sources of finance and investor bases have been opened up for them while the traditional sources like domestic banks have turned more cautious. At the same time proactive measures taken by regulators based on lessons learnt from the experience of AEs has led to increasing confidence in the local debt markets. Curtailment of banks’ easy money policies in countries like India following increased regulatory requirements on account of rising bad loans and corporate defaults has enhanced the importance of alternative sources of funds for corporates. The process is also supported by banks themselves as it helps them to save on capital requirements while at the same time enabling them to maintain relationships with their clients as well as opening up new lucrative sources of revenue in the form of fees earned on advising on and arranging the raising of capital in the markets. The rising reliance on non-bank sources of funds especially in EMEs is proving to be a double-edged sword with reducing reliance on the banking system on one hand and increased market volatility and contagion spillover on the other adding to the complexity in policy making. This write-up studies the changes in India in the light of these transformations taking place across EMEs.

Developments in EMEs

The accommodative monetary policies in major AEs coupled with record low rates has enhanced the interest towards EMs in the search for yields, thereby increasing the demand for debt securities issued there. There is evidence that domestic banks have faced increased competition from debt securities markets in financing some EME borrowers, particularly after 2008 (BIS November 2015). The share of bank credit in total credit has generally declined over the past decade. There has also been a structural shift in the balance sheets of EME banks as sources of their funding and recipients of their credit have changed. While the growth of loans has declined, investments in corporate papers have been rising.

The Indian Banking Scenario

Historically the Indian banking sector has been the major driving force supporting the country’s growth by channelizing domestic savings towards capacity creations and the size of the banking sector in terms of assets and earnings has grown in line with the entire economy. However, over the past decade, Indian financial system has undergone many changes; a higher volume of debt financing, opening up of more venues to borrow funds. Bank credit is gradually losing steam in meeting the funding requirements of the Indian corporate sector with the rising risk averseness of banks and expansion of capital markets. Corporates are no longer hesitant in approaching the market to raise funds either through equity or debt. It has been a beneficial relationship with a wider choice for financial planning for corporates on one side and more choice for diversification for investors including banks themselves on the other. Increasing ease in the primary issuance process for various instruments has benefitted both sides and so has increased awareness and risk appetite among investors. This type of structural shift is likely to have significant implications on the transmission of policy measures as well as financial stability in an increasingly open financial system.

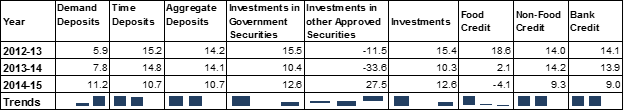
Select Aggregates of Scheduled Commercial Banks – Growth Rates (%)

1

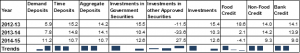
Source: RBI and CCIL

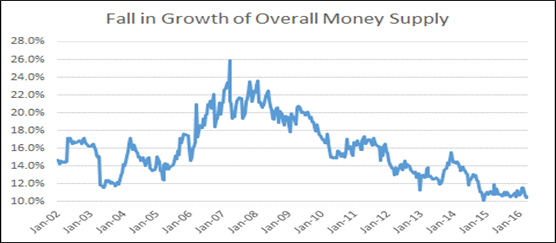
As can be seen clearly, the growth in aggregate deposits with the Indian banking system has witnessed a sharp decline in 2014-15 which is also mirrored in the slowdown in bank credit. In fact, Non-Food Credit (NFC) grew at the slowest pace since 1993-94. Industrial sector which has over one fourth of share in total NFC witnessed gradual decline in the credit disbursal since 2014. Higher lending rates had an adverse effect of the credit directed to economic sectors like industries and services.  Credit directed to industries fell continuously from 24% in FY10 to a single digit in FY15 and FY16 to 5.61% and 2.75% respectively. Service sector too have been witnessing declining y-o-y growth in the credit disbursal from banks, touching multi-year low of 3.19% till December 2015 (picking up in the last quarter of FY16 to take year-end growth to 9.06%). The accelerated growth in the “Personal Loans” has been the driving force in the historic low pace in the total bank credit to the positive territory especially housing and credit card outstanding. Banks’ reluctance to lower the lending rate because of the increasing stressed assets in the system and availability of cheaper sources of funds in the market is acting as a major deterrent to its growth. However, revival is anticipated as average base rate has fallen by 35 bps following constant reminders from the RBI Governor to banks for passing on the advantage of lower policy rates to the economic agents, further monetary policy easing during its First Bi-Monthly Monetary Policy by the RBI in April 2016 along with reducing interest rate on small saving schemes and switch to base rate calculation on the basis of the marginal cost of funds.

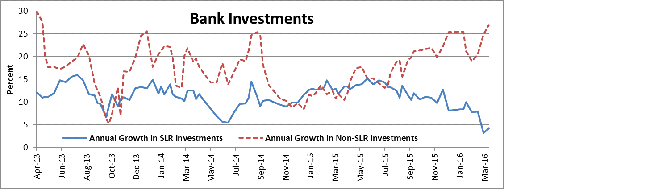
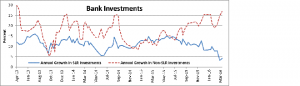
Banks in India still follow traditional business models and are less engaged in investment banking activities than are their AE counterparts. As a result, slowdown in NFC is mirrored by an increase in the share of investments in total bank assets, especially non-SLR holdings which majorly comprise of debt instruments issued by the private sector. Banking sector investments remained at record levels in FY16 resulting from continuous growth in banks’ non-SLR investments. Thus, Indian banks are indirectly supporting the corporate sector by subscribing to their debt instruments rather than extending direct credit to them.

2

Source: RBI

Debt Financing Options in India

Corporate Bonds

Bond markets help diversify the sources of financing and avoid credit risk concentration in the banking sector. A liquid corporate debt market can play a crucial role by supplementing the banking system to meet the requirements of the corporate sector for long-term capital investment and asset creation. Since bank credit has remained prime source of funding for corporates over the years indicates that banks are getting stretched to finance the growth of the economy.

In India, various recommendations announced by numerous committees (R. H. Patil committee 2005, Percy Mistry committee 2007, Raghuram Rajan Committee in 2009 etc) have resulted in a list of reforms to deepen and develop the corporate bond market as listed in the subsequent table.

Impact of Measures Taken by the GoI, the RBI and the SEBI to Develop CB Market in India
Top of Form

Intended outcomes mostly achievedBottom of Form

Intended outcomes partially achieved/ too early to say Intended outcomes not achieved
1) Setting up of reporting platform for post-trade transparency 1) Banks and PDs allowed to become members of stock exchanges to trade in corporate bonds 1) Introduction of Repo in corporate bonds to meet the funding needs
2) Introduction of DvP in settlement of OTC trades to eliminate settlement risk 2) Investment norms for banks and PDs relaxed to facilitate investment in corporate bonds 2) Introduction of Credit Default Swaps to facilitate hedging of credit risk by the holders of corporate bonds, reissuance of bonds permitted by SEBI Bottom of Form
3) Issue of long-term bonds by banks (exempted for NDTL computation) with a minimum maturity of 7 years to raise resources for lending to (a) long term projects in infrastructure sub-sectors, and (b) affordable housing. 3) Final guidelines issued for partial credit enhancements by banks to corporate bonds  
4) The investment limit for Foreign Portfolio Investors (FPI) has been increased to USD 51 billion during the last few years. Withholding tax rate has been reduced from 20% to 5%. They are allowed to invest only in CBs having residual maturity of at least 3 years. 4) Measures taken to encourage investor interest/participation in the corporate bond market in terms of liberalizing the listing requirements; simplification in procedures and processes, simplified disclosure norms and standardisation of market conventions  
5) International financial institutions like IFC were permitted to float a rupee linked bond overseas to deepen the off-shore rupee bond market, to raise rupees to invest in India. 5) Rationalisation of FPI regulations has been put in place for easier registration process and operating framework for overseas entities seeking to invest in Indian capital markets  
6) SEBI has allowed setting up of dedicated debt segment on the exchanges    

Source: RBI. Speech by Shri Harun R. Khan, Deputy Governor on Corporate Bond Markets in India: A Framework for Further Action – November 06, 2015.

The amount of corporate bonds issuance has increased by 76% between 2010-11 and 2014-15, while number of issues leaping by 82%. Net outstanding too amplified by 99% during the same period under consideration. If we extend the period by one more year, bond issuances between  2010-11 and 2015-16 rocketed 101%, issuance amount by 114% and net outstanding by 128%.

Issues and Total outstanding Corporate Debt (Amount in Rs. Crore)
Year Issuance details % change in issuance Net outstanding (As at end-March) No. of outstanding instruments % change in outstanding amount
No. of issues Amount
2012-13 3,023 380,411.62 27.48 1,261,717.15 8,859 23.79
2013-14 3,136 383,320.05 0.76 1,446,057.68 9,186 14.61
2014-15 4,257 466,247.13 21.63 1,702,756.47 10,810 17.75
2015-16 4,696 564,099.70 20.99 1,956,445.64 12,624 14.90

Source: Securities and Exchange Board of India, RBI.

 In the corporate bond market, funds are raised through either public issues or via private placements. In the prior scenario, an offer is made to the public in general to subscribe to the bond. On the other hand, private placement is an issue of securities to a select group of persons (less than 50). While the private placement disclosure and documentation requirements are viewed by the market to be comprehensive, disclosure requirements for public issuance of debt are viewed by the market as being extremely arduous and difficult to comply with. Since the market for public debt does not exist, it does not make any economic sense to spend a good part in issuance.Hence, this market is dominated by the private placements. The limited disclosure, customized structures to cater the requirements of both issuer and investors and the fast speed of raising funds have made this route more attractive for the corporates to raise funds from the market.

Modes of Debt Issues Used by Corporate Sector
Year Debt Issues (Rs. Crore) Total
Public Private Placement
Amt Share (%) Amt Share (%)
2012-13 16982 4.49 361462 95.51 378444
2013-14 42383 13.31 276054 86.69 318437
2014-15 9713 2.35 404137 97.65 413850
2015-16 33812 6.87 458073 93.13 491885

Source: Securities and Exchange Board of India

Slowly and steadily this market is developing in terms of volumes and number of issuances. Over the last couple of financial years, banks rigidity towards lowering of its base rate in line with the easy monetary policy adopted by the RBI has helped corporate bond market to establish itself as an alternative to bank credit as one of the sources of funds for corporates. For example, while RBI slashed LAF Repo rate by 50 bps between December 2014 and March 2015, banks’ inability to replicate this change led corporates to tap the bond market as evident from higher number of issuances (2371 in 2014-15) and lower average fixed rate coupon (from 11.34% in 2012-13 to 11.09 in 2014-15%).

Issuances of Fixed Rate Corporate Bonds
Year Number of Issuances Avg Coupon of fixed rate CB Issuances Avg Base Rate LAF Repo at the end of fiscal
2012-13 1142 11.34 10.13 7.50
2013-14 1717 11.34 10.05 8.00
2014-15 2371 11.09 10.13 7.50
2015-16 2549 11.13 9.68 6.75

    Source: NSDL

Out of total corporate debt issuances, high rated bonds considered to be the safest bet has lion’s share. AAA and AA rated bonds has combined share of over 72% in total CB issuances over the years.

Rating Analysis of the Issuances of Fixed Rate Corporate Bonds
Year AAA AA A1 A BBB BB B C NA
2012-13 433 470 13 117 24 9 0 3 73
2013-14 481 846 9 125 41 26 7 3 179
2014-15 789 929 11 241 126 53 5 0 217
2015-16 907 963 47 204 103 50 8 0 267

    Source: NSDL

Apart from bonds, corporates as well as banks themselves are also increasingly using shorter term instruments like CP/CD that are generally considered to be part of the money market as the maturity is within a year.

Commercial Paper (CPs)

Indian companies generally issue CPs for meeting short-term fund requirements without collateral mainly to purchase inventory or to manage working capital. CPs may also be issued to take advantage of falling interest rates and retiring expensive bank loans and other debt on the companies’ books. CPs can thus, help corporates to diversify their liability books. Since their introduction, primary and secondary market activity in CPs in India has had a chequered history reflecting the overall pace of economic activity and the prevailing interest rate regime or liquidity conditions. Over the years, the segment has gathered support from various regulatory measures especially the delinking with working capital requirements in 2000, changes in the issuer and investor base, reduction of stamp duty in 2004 and other taxes, changes in maturity profile, etc. However, the pace of activity in the CP market has grown rapidly in recent years following the implementation of the base rate system for banks which restrict them from lending at rates lower than their base rates. Banks can bypass these guidelines by investing in the CPs of their corporate clients at lower rates rather than extending them loans directly.
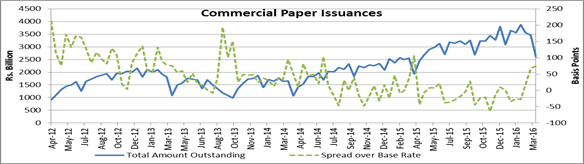
3

Source: RBI, CCIL

CP issuance has ballooned up in the last two years primarily as a reaction to the delay in banks’ passing on interest rate cuts. Highly rated corporates often found it cheaper to raise funds directly from the market through issuing CPs rather than borrowing from banks while CPs also gave corporates the advantage in terms of tenor of issue and flexibility of end-use. The spread between average interest rate of new CP issuances and the average base rate of banks has come down gradually falling from 101 bps in FY13 to 50 bps in FY14, further declining to 17 bps in FY15 before turning to (-) 8 bps in FY16 implying the market driven movement of CP rates as against the stickiness of base rates. The spread remained mostly in the negative territory in FY16 till mid-February 2016, rising significantly thereafter as the latest SEBI norms restricting mutual fund investments in debt instruments such as commercial paper and corporate bonds started weighing in on the yields along with the liquidity shortage during the fiscal year ending. This largely explains the substantial issuances over the past year. Apart from corporates even NBFCs and financial institutions also resorted to enhanced issuance of debt papers such as CPs instead of borrowing from banks at higher rates.

CPs are purchased primarily by institutional investors such as banks and mutual funds which generally invest money from their liquid/short term funds in CPs. Insurance companies also invest in CPs to diversify their portfolio. Retails investors can indirectly participate in this market by buying short term debt funds. Commercial banks have gradually started to increase their investments in CPs, with their holdings of CP exceeding their mutual fund holdings since September 2015. On an average they have held almost 23% of the total outstanding CPs during FY16 which was an increase over their average holding of 15% of the outstanding during FY15. Trading activity in the secondary market has also picked up with issuances as participants try to take advantage of falling interest rates.

Commercial Paper – Trading

Analysis                                                                                                                                                                 

Residual Maturity (Months) 2012-13 2013-14 2014-15 2015-16
Share (%) WAY (%) Spread over G-sec (bps) Share (%) WAY (%) Spread over G-sec (bps) Share (%) WAY (%) Spread over G-sec (bps) Share (%) WAY (%) Spread over G-sec (bps)
1 64.59 8.65 58.77 71.98 8.86 30.31 75.07 8.56 29.50 68.91 7.86 68.48
2 15.35 8.87 75.39 13.60 9.11 52.34 11.11 8.76 42.79 12.39 7.97 72.09
3 11.04 9.04 93.72 5.77 8.85 65.79 5.70 8.75 36.33 8.51 7.82 52.44
4 2.13 9.37 128.04 1.49 9.58 91.90 2.24 8.87 50.10 2.02 7.96 61.36
5 1.47 9.29 124.95 1.16 9.80 87.20 1.06 8.99 52.31 1.52 8.14 74.97
6 0.98 9.51 144.31 1.03 9.64 112.26 1.04 8.91 40.64 1.00 8.22 82.28
7 0.52 9.79 167.24 0.75 10.38 120.16 0.31 8.96 45.56 1.22 8.24 66.82
8 0.79 9.78 170.73 0.55 9.89 107.82 0.36 9.08 55.57 0.97 8.27 72.41
9 0.63 9.73 162.73 0.27 9.75 104.03 0.31 9.18 90.22 0.44 8.28 73.06
10 0.54 9.41 128.35 0.89 9.49 111.34 0.48 9.24 93.71 1.17 8.35 89.07
11 0.43 9.27 128.83 0.63 9.63 111.03 0.86 9.17 92.02 0.96 8.47 95.58
12 1.52 9.37 124.50 1.88 9.81 113.61 1.45 9.15 85.53 0.88 8.59 117.02
Total (Face Value in Rs. Crore) 513864 416598 544449 614951

Excluding Inter Scheme Transfers. Source: CCIL

Secondary market trading is primarily concentrated in CPs rated as A1+, the highest credit quality rating assigned to short-term debt instruments. Wary of the increasing NPAs and the high provisions required to address them while at the same time in an attempt to keep highly rated corporate accounts in their books, banks are increasingly investing in their debt instruments such as CPs and bonds instead of directly lending to them even as corporates are opting to raise funds directly from the market rather than borrowing funds from banks at higher rates. This trend is stronger for public sector banks which have emerged as the largest net buyers of CPs in the secondary market. In terms of overall activity in the secondary market, the Mutual Funds followed by Corporates are the most active participants. Secondary market trading is mostly concentrated in the up to 3 months maturity papers.

NBFCs are important financial intermediaries in India playing a supplementary role to banks. NBFCs include not just the finance companies, but also a wider group of companies that are engaged in investment, insurance, chit fund, nidhi, merchant banking, stock broking, alternative investments etc. as their principal business. Traditionally bank loans were the source of funds for these firms. However, these firms are now increasingly raising funds through market-based instruments such CPs, debentures, or other structured credit instruments. NBFCs accounted for more than 55% of the total CP issues during FY16. Analysis of secondary market CP trading data indicates that CPs issued by NBFCs are the most traded in line with their share in issuances, with CPs issued by NBFCs accounting for 80% of the total traded volumes in FY16.

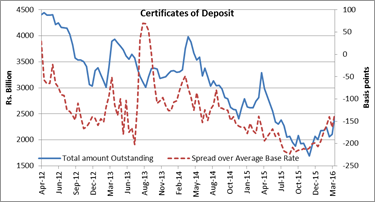
Certificate of Deposits (CDs)

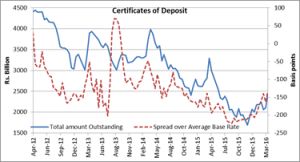
CDs are an important source of raising funds for the banks themselves. CDs are used by banks to meet their temporary asset-liability mismatches. CD rates are higher than yields on government securities as investors are required to deposit funds for a specified term exposing them to credit risks as against the risk-free sovereign securities. CD rates are also higher than retail fixed deposit rates as they are raised when banks face liquidity crunch as well as to account for the stamp duties payable on their issuance.  CD issuances fall amid easy liquidity. Institutional investors like mutual fund houses and banks are the key investors/buyers of these instruments.

4

Source: RBI, CCIL

CD issuances spike up during financial year ends as well as reissuances due to liquidity tightness. To address the spike in the CD rates at financial year-ends as banks rushed to meet targets, the Finance Ministry issued norms that required banks to reduce the proportion of bulk deposits and CDs to 15% of the total deposits by March 31, 2013. This led to a substantial decline in CD issuances with most public sector banks being near their issuance limits. Recognizing that bank investments in liquid schemes of mutual funds would, in turn, be invested in bank CDs, that could lead to systemic risks, RBI banned banks from holding more than 10% of their net worth in liquid schemes of mutual funds from January 2012. At the same time, Sebi’s decision to reduce the threshold for mark-to-market requirement on debt and money market securities of mutual funds from 91 days to 60 days also contributed to reductions in CD holdings. While the market lost some appetite due to the several restrictions imposed on the participants by regulators, the slow credit off take has also been a contributor to the contraction of the CD market. Secondary market trading in CDs has been in a declining trend in line with the decline in issuances.

Certificate of Deposit – Trading Analysis*                                                                                                                                                                                                                           

Residual Maturity (Months) 2012-13 2013-14 2014-15 2015-16
Share (%) WAY (%) Spread over G-sec (bps) Share (%) WAY (%) Spread over G-sec (bps) Share (%) WAY (%) Spread over G-sec (bps) Share (%) WAY (%) Spread over G-sec (bps)
1 22.16 8.49 40.17 20.23 8.75 19.69 26.50 8.37 6.46 28.24 7.61 37.67
2 18.12 8.68 56.55 25.08 8.99 44.04 27.15 8.56 18.01 22.90 7.62 30.66
3 25.87 9.03 87.89 22.18 8.87 53.42 24.64 8.63 25.04 28.76 7.75 41.88
4 6.45 9.05 92.82 3.09 9.00 71.83 4.15 8.70 27.51 2.10 7.69 35.55
5 3.04 8.88 75.30 2.02 8.86 57.19 2.11 8.75 24.89 1.46 7.66 30.11
6 3.97 8.93 83.59 2.93 9.05 56.04 2.24 8.75 25.13 2.99 7.78 47.12
7 2.42 9.10 95.33 1.54 9.73 73.54 1.10 8.75 27.01 1.60 7.79 32.36
8 1.94 9.17 104.51 2.28 9.06 69.07 1.05 8.89 28.67 1.64 7.84 31.04
9 2.16 9.20 108.76 2.82 8.50 74.65 1.17 8.82 30.10 1.54 7.95 37.84
10 2.18 9.46 128.52 2.26 8.59 79.57 1.50 8.92 31.59 1.96 8.09 41.58
11 2.01 9.45 129.00 2.96 8.71 77.20 1.72 8.94 39.50 1.89 8.18 46.30
12 9.67 9.20 118.19 12.60 9.41 72.55 6.67 8.75 46.93 4.92 8.04 69.33
Total (Face Value in Rs. Crore) 1733410 1501309 1322377 1084800

*Excluding Inter Scheme Transfers. Source: CCIL

On an average nearly 80% of the total secondary market trading in CDs has been concentrated in CDs maturing within 3 months, although issuances are mainly concentrated in CDs maturing in 12 months or more. Mutual Funds, Public Sector Banks and Private Sector Banks are the most dominant participants in the secondary market. The spread over g-secs in the secondary market trading of CDs had been narrowing sharply till the last fiscal. However, the spreads have started inching up again in recent months owing to rising liquidity tightness as well as increasing uncertainty in markets due to global developments along with competition from other money market instruments offering higher yields.

CDs can get a boost from with the development of a benchmark Certificate of Deposit (CD) curve for inter-bank lending and borrowing based on dealt rates of various tenors of maturity up to a year. This measure will bring more transparency and lead to better pricing as CDs are currently priced through negotiations with the rates decided according to the demand, supply and credit risks involved.

External Commercial Borrowings (ECBs) / Foreign Currency Convertible Bonds (FCCBs) / Trade Credit

Indian corporates are tapping foreign money via ECBs, FCCBs or trade credits, taking advantage of lower global interest rates and the ability to borrow at longer maturities. ECBs are commercial loans taking many forms like bank loans, buyers’ credit, suppliers’ credit, floating rate notes, fixed rate bonds, non-convertible/convertible preference shares availed of from non-resident lenders with a minimum average maturity of 3 years. There are two routes, through which ECB can be accessed, namely,

  • Automatic Route – Do not require prior approval from the RBI or GoI. Eligible borrowers can raise funds for investment in infrastructure sector, specified service sector, industrial sector, acquisition of shares in the disinvestment process to the public under the Government’s disinvestment programme of PSU shares, import of services etc.
  • Approval Route – Prior approval is needed from the RBI or GoI before availing the facility. Eligible borrowers can raise funds for investment in the real sector (industrial and infrastructure), for working capital for civil aviation sector, general corporate purposes from direct foreign equity holders. Low Cost Affordable Housing etc.

Note: eligibility for an ECB in respect of eligible borrowers, recognized lenders, end-uses, etc. to be read in conjunction and not in isolation (RBI).

FCCBs are bonds issued in foreign currency by an Indian company to be subscribed by non-residents. The principal and interest too is payable in foreign currency and its issuances are governed by the scheme “Issue of Foreign Currency Convertible Bonds and Ordinary Shares (Through Depositary Receipt Mechanism) Scheme, 1993” as amended from time to time. This convertible bond is a mix between a debt and equity instrument as in bond subscribers receives regular coupon and principal payments. However, clauses under FCCB allow the issuer or bondholder to convert the bonds into shares during its term, at a pre-agreed price. The investors receive the safety of guaranteed payments on the bond and are also able to take advantage of any large price appreciation in the company’s stock.

There are certain requirements that needs to be satisfied for the issuances of FCCBs. They are (as per notification FEMA No. 120/RB-2004 dated July 7, 2004);

  1. FCCBs shall have maturity of 5 years and above;
  2. the call & put option, if any, cannot be prior to 5 years;
  3. issuance of FCCBs only without any warrants attached; and
  4. the issue related expenses not exceeding 4% of issue size and in case of private placement, shall not exceed 2% of the issue size.

Since, issuance of FCCBs was brought under the ECB guidelines in August 2005 these are also subjected to all the regulations which are applicable to ECBs. RBI has also made provision for the refinance of FCCBs by Indian companies having difficulty in meeting the redemption obligations. Once terms and conditions set out by the RBI like the amount of fresh ECB/FCCB not to exceed the outstanding redemption value at maturity of the outstanding FCCBs; the fresh ECB/FCCB to be raised with less than six months prior to the maturity of the outstanding FCCB etc (Master Circular on External Commercial Borrowings and Trade Credits – July 01, 2013) are met, designated AD Category – I banks have been permitted to allow Indian companies to refinance the outstanding FCCBs under automatic route. Here, ECB/FCCB beyond USD 500 million for the purpose of redemption of the existing FCCB are considered under the approval route.

Trade credits refer to the credits extended by the overseas suppliers, banks and financial institutions for maturity up to five years for imports into India. Depending on the source of finance, such trade credits include suppliers’ credit or buyers’ credit. Suppliers’ credit relates to the credit for imports into India extended by the overseas supplier, while buyers’ credit refers to loans for payment of imports into India arranged by the importer from overseas bank or financial institution. These are a big source for funding for medium and small scale companies that have relatively less access to bank credit as this leads to the cost of working capital falling sharply. Over the past 2 years RBI has liberalized its policy providing greater flexibility for structuring of trade credit arrangements as well as conversion of trade receivables into liquid funds through setting up of an institutional mechanism for financing trade receivables. In November, RBI granted “in-principle” approval to three applicants to set up and operate Trade Receivables Discounting System (TReDS) under the Payment and Settlement System (PSS) Act 2007. TReDS will allow SMEs to post their receivables on the system and get them financed. This will not only give them greater access to finance but will also put greater discipline on corporates to pay their dues on time.

The following table provides the amount borrowed by corporates under ECB/FCCB from FY2012-13. Amount raised under FCCBs is very negligible – only 3 instances under automatic and approval routes amounting to USD 794 million each during the period under review and mainly for the purpose of redemption of FCCBs or refinancing of earlier ECB.

External Commercial Borrowing (Amt. in $ Mn. Growth in %)
Year Automatic Route Approval Route Total
Amount Growth Amount Growth Amount Growth
2012-13 18395 -28.76 13651 34.57 32046 -10.90
2013-14 12347 -32.88 20892 53.04 33239 3.72
2014-15 19215 55.63 9170 -56.11 28385 -14.60
2015-16 13411 -30.20 10961 19.53 24372 -14.14

Source: RBI

Macro-economic developments, global integration and the experience of administering the ECB regime over many years led RBI, in consultation with the GoI, to review and revise the extant of ECB framework from time to time. RBI reviews and revises all-in-cost ceiling which involves every cost in a financial transaction and can be used to explain the total fees and interest included in a financial transaction. The ceiling for ECB having average maturity of 3-5 years and above 5 years is 350 bps and 500 bps respectively over the 6-month LIBOR for the respective currency of credit or applicable benchmark (A.P. (DIR Series) Circular No. 99 dated March 30, 2012). Similarly, all-in-cost ceiling for trade credits with maximum maturity of 5 years is 350 bps over 6-month LIBOR. The amount of borrowing from trade credit/ECB/FCCB under both the routes along with the average all-in-cost ceiling for different average maturity are listed in subsequent table. Here, for simplification, average maturity is categorized into 5 buckets.

Bucket-wise Summary of Total Amount Borrowed via ECB
  Automatic Route Approval Route
  No Total Amount Borrowed ($ Mn) Average All-in-Cost Ceiling No Total Amount Borrowed ($ Mn) Average All-in-Cost Ceiling
2012-13            
Upto 3 Years 25 181.30 4.0844 13 2275.57 4.0269
3 Years to 5 Years 264 3751.93 4.1284 16 1500.90 4.0756
5 Years to 7 Years 248 4546.74 5.6161 25 2466.28 5.5988
7 Years to 10 Years 192 4965.81 5.6131 16 1487.35 5.5656
Above 10 Years 96 4949.04 5.6070 22 5921.07 5.5986
2013-14            
Upto 3 Years 23 999.89 3.8835 22 6739.40 3.8686
3 Years to 5 Years 181 2465.94 3.8850 21 4434.33 3.8686
5 Years to 7 Years 174 3380.47 5.3805 33 3072.97 5.3712
7 Years to 10 Years 122 1942.83 5.3781 42 2584.99 5.3705
Above 10 Years 73 3557.07 5.3740 23 4059.95 5.3713
2014-15            
Upto 3 Years 37 3279.13 3.8435 11 761.93 3.8363
3 Years to 5 Years 186 4093.33 3.8437 13 2018.31 3.8362
5 Years to 7 Years 167 4942.28 5.3462 18 2493.27 5.3333
7 Years to 10 Years 230 3456.07 5.3469 29 609.62 5.3324
Above 10 Years 116 3444.79 5.3403 17 3285.11 5.3324
2015-16            
Upto 3 Years 47 2243.05 4.1577 3 1113.78 4.1600
3 Years to 5 Years 173 2035.50 4.1058 13 5531.25 4.1562
5 Years to 7 Years 144 2879.89 5.6773 9 547.37 5.6044
7 Years to 10 Years 217 3325.19 5.5890 13 229.90 5.5700
Above 10 Years 91 2927.04 5.6724 9 3539.61 5.5156

Source: RBI

Funds raised by corporates from foreign entities are used for different purposes like import of capital and non-capital goods, for working capital, infrastructural development, modernization, general corporate purpose, refinancing of old debts, redemption of FCCBs etc. Since interest rates in US are far lower than that in India, it seems profitable for an Indian company to borrow money from US or other countries like EU or Japan.

Despite regular modifications and simplification in ECB policies and procedures w.r.t. re-schedulement of ECB (RBI press release May 09, 2014), refinancing of ECB at lower all-in-cost (August 27, 2014), parking of ECB proceeds with designated banks (November 21, 2014), rescheduling/restructuring of ECB (January 23, 2015), inclusion of different sectors to raise ECBs etc, the amount raised failed to pick up over the years. It has remained around USD 32,000 million from FY12 till FY14, falling thereafter to USD 28,385 million in FY15. Till the first half of 2015-16, such borrowing was just 41% of the total amount raised during the previous year, improving during the next two months to reach USD 20,000 million. While ECBs help companies take advantage of the lower interest rates in international markets, the cost of hedging the currency risk can be significant. If unhedged, exchange rate movements can prove adverse to the borrower. Apart from that, lower all-in-cost ceiling (the all-in cost involves every cost in a financial transaction and can be used to explain the total fees and interest included in a financial transaction such as a loan), restriction on end-uses did not make ECB as a favourable option to raise funds.

However, in a recent development, RBI has issued revised framework for ECB on November 30, 2015 by liberalizing end-use of ECBs, higher all-in-cost ceiling for long term foreign currency borrowings to make repayments more sustainable and minimizing roll-over risks for borrowers. It has also expanded the list of overseas lenders to include long term lenders like Sovereign Wealth Funds, Pension Funds as well as insurance companies, reduced the negative list of end-use requirements applicable to long-term ECBs and INR denominated ECBs and raised limits for small value ECBs with Minimum Average Maturity (MAM) of 3 years to USD 50 million from the existing USD 20 million along with few other changes. The revised ECB framework will work depending on the following three tracks:

  • Track I : Medium term foreign currency denominated ECB with MAM of 3/5 years
  • Track II : Long term foreign currency denominated ECB with MAM of 10 years
  • Track III : Indian Rupee denominated ECB with MAM of 3/5 years

Revised ECB guidelines are expected to attract higher flow of funds from foreign entities to calibrate the policy towards capital account management in the changing dynamics of macro-economic conditions. While ECBs help companies take advantage of the lower interest rates in international markets, the cost of hedging the currency risk can be significant. This has given rise to the need for Masala bonds where the cost of borrowing can work out much lower.

Masala Bonds

Masala bonds are Indian rupee denominated bonds issued by Indian entities in offshore capital markets. In 2013, the International Finance Corp. (IFC), an investment arm of the World Bank launched the first ever “Rupee Linked Offshore Bond” programme. The programme created a rupee yield curve in the offshore market through issuances of various maturities i.e. 3, 5 and 7 years. These bonds provided globl investors a substitute for other EME local currency bonds, such as Indonesian Rupiah bonds. In terms of the investor profile, the largest amount was subscribed to by the US investors followed by the European and Asian investors. Subsequently, IFC was permitted to expand the issuance program and it issued a 10-year, Rs.10 billion bond (equivalent to US$163 million) in 2014. These bonds described as “Masala bonds” marked the first rupee bonds listed on the London Stock Exchange and are currently the longest-dated bonds in the offshore rupee markets, building on earlier offshore rupee issuances by IFC. IFC named these “masala bonds” as “masala” is a globally recognized term that evokes the culture and cuisine of India. These proceeds were meant for investment in an infrastructure bond issuance by a commercial bank in India. The IFC has also issued onshore rupee bonds in India to be used for lending to the infrastructure sector. These bonds are referred to as “Maharaja Bonds”.

RBI permitted Indian corporates to issue rupee denominated bonds overseas and issued details guidelines for the same on September 29, 2015. While RBI barred Indian banks from packaging and selling the bonds, any domestic corporate, infrastructure investment trust or real estate investment trust can now issue up to $750 million worth of masala bonds in any calendar year, with a minimum print maturity of five years. The guidelines allow a wide range of potential investors including retail investors as well as big institutions that currently lack a FII license to directly buy Indian securities a chance to tap straight into a relatively healthy and fast-growing market.

While the masala bonds are denominated in Indian rupees, they will be offered and settled in US dollars with international investors making it easier for foreign investors to participate in the issuances beyond the ceiling on their investments in corporate bonds issued onshore in India. The Indian issuers will not have to bear any currency risk as the borrowing and payment both are in rupees. The exchange rate risk thus is borne by the investors for whom the investment and settlement would happen in a foreign currency. Hence, unlike ECBs, in this case Indian companies can raise funds from foreign investors sans the currency risk. In a bid to promote the development of the market for these bonds the government clarified that a reduced 5 percent withholding tax will be applied on these bonds at par with that on ECBs and domestic corporate bonds. At the same time, Indian companies will be exempt from paying capital gains taxes for masala bonds sold by them abroad in case of rupee appreciation.

As of March 31, 2016, not a single masala bond had been issued by Indian companies. RBI has tried to address part of the problem by reducing tenure for these bonds to 3 years and bringing them under the overall limit for foreign investors in corporate bonds. The reduction in tenure is likely to reduce hedging cost for investors thereby reducing the cost of issuance for Indian firms.

Other Instruments

Indian companies are also actively borrowing directly from the general public primarily through corporate fixed deposits and non-convertible debentures (NCDs).

Corporate fixed deposits are basically the same as unsecured loans that do not guarantee anything to the investors in case of a default as these are not regulated by the RBI unlike bank deposits. These instruments are generally issued by NBFCs and corporate borrowers offering much higher interest rates than normal bank deposits and are best suited for investors with a risk appetite looking to diversify their portfolios and increasing their returns. Recent years have witnessed increased interest in these instruments as higher rated corporates can raise funds directly from investors through these deposits at relatively lower rates and at more ease than bank loans that are subject to several diligence checks by the bank. Investor interest has also increased in highly rated corporate deposits especially for the short-term tenors. Majority of these deposits are now being raised in the 12-60 Months basket. More than 80% of the offers for deposits rated AA or AAA although around 8% of the issues are unrated. There is an average spread of nearly 200 basis points between AAA and unrated deposits. Government housing companies typically offers the lowest rates while the highest are offered by lower rated corporates looking to raise funds for 1-3 years.

NCDs are like secured and redeemable bonds issued by corporates (including NBFCs) with original or initial maturity more than 90 days. Recent years have seen more and more corporates issuing NCDs and substituting bank loans. In fact of the 2988 new listings issued by Indian companies in 2015, 827 were NCDs and out of that 813 were issued on private placement basis. With increasing investor awareness, more and more NCDs are also being offered through public issues for retail investors. These NCDs are primarily issued by NBFCs as well as government companies linked to the infrastructure sector. Almost a third of all public issues of NCDs during the last three fiscal years were issued during the month of March. The highest number of public issues of NCDs was during 2013-14 after which the issuances declined significantly. In terms of amount raised, 2015-16 recorded the highest borrowing of funds through NCDs majorly for expansion, working capital requirements and general corporate purposes. Several companies approached the market multiple times for issuing NCDs. Funds were raised via the NCD route majorly by finance and few infrastructure companies, with many issues being oversubscribed at multiple times of the size of the base issue.

Public Issue – NCDs           

FY Number of Issues Final Issue Size (Rs. Crore)
2012-13 20 16982.05
2013-14 35 42382.97
2014-15 25 9713.43
2015-16 20 52089.60

Source: SEBI

Traditionally, infrastructure lenders comprised of a long-term big borrower group for bank loans. However, several budget measures in recent years have opened up alternate sources of funding for these companies in the form of tax-saving and tax-free infrastructure bonds with which they can raise money from the general public. These infrastructure bonds have been accepted as a good investment option in the fixed income category as these are generally issued by government backed infrastructure companies and offer a decent rate of interest plus tax benefits. These developments have also had an adverse impact on expansion of bank credit.

Conclusion

BIS research indicates that financial booms in AEs go hand in hand with a misallocation of resources, depressing productivity on the way. Optimism and the illusion of sustainability makes even large debt levels appear sustainable to both borrowers and lenders when credit conditions are easy and asset prices soar. The levels of debt begin to look much more challenging as the cycle turns with the combination of falling asset prices, decline of profitability and more turbulent markets. The same trend is also currently reflected in the substantial stressed assets of the Indian banking system, especially of corporates in the power and mining sectors. The changes in the balance sheet structure of Indian banks from being mainly lenders of working capital, to being major providers of long term capital for large industrial and infrastructure projects, along with the declining household savings are bound to have significant liquidity implications once the economic cycle turns and demand for credit goes up. With increasing reliance of Indian companies on foreign borrowings, attracted through the super low global interest rates, the exchange rate has taken on an amplification role in generating stress not only in the foreign exchange markets, but also the overall financial system. These changing times call for changes in the formulation of market regulations as well as the system of operation of monetary policy.

******


The Fundamental Reason for drop in Bank Deposit Growth

From January 2016 onwards a fall in growth rate of deposits in Indian banking system has been observed. Some senior banking professionals claimed that this slowdown in growth of deposit has been among the reasons for limiting their ability to support high credit growth.  Immediately economists jumped in with possible explanations for this slowdown in deposit growth. Most persons analyzing the event tended to conclude that the culprit was the public’s preference for holding higher amount of ‘cash’ i.e. notes/currency in circulation.

Some advocated a cut in CRR ratio, with the argument that from whatever deposit growth is happening if a lesser amount is kept aside as reserve, more ‘money’ will be available for lending. It appears very few of such policy advocates may appreciate the fact that banking system creates money, when it disburses loan. Practically (and as per the Modern Monetary Theory-MMT) the constraint to bank lending is not quantum of deposits but availability of capital to the bank.

1

Hunt for explanations: In fact a cursory look at the data, and their corrélations may prompt one to jump into the conclusion that increase in cash with public is causing the drop deposit growth. The ‘fundamental’ reason for the twin observations was ascribed to everything from election related spending, to public’s preference for holding cash since inflation has fallen, to avoidance of service-tax-payment by resorting to cash payment. Some discovered more interesting reasons such as public having prior knowledge of ‘demonetization’ and thus taking out deposit from bank to put aside in safe heaven assets such as gold!

Each explanation did its best to fit into the popular perception that deposit comes from currency-in-circulation and that gives bank the ability to extend credit. Some economists of course struggled to explain how, if real interest rate has improved (thanks to fall in systemic inflation, mostly the WPI), why was the savings growth rate falling?

Here some economists actually deflated the deposit growth, which is nominal, to calculate real deposit growth and suggest that the problem of deposit is not all that severe! Others argued that the relationship between real interest rate and savings is undergoing a change such that the increase in real interest rate is reducing the savings rate, because holding cash is becoming more attractive. So much for fitting the analysis results to provide an explanation that fits the dominant narrative- a classic case of confirmation bias.

Surprisingly, Credit is not identified as a reason: However, none of the reasons suggested that fall in credit growth is the reason for fall in deposit growth. As opposed to popular but incorrect understanding, which unfortunately is also seen in several macroeconomic text books, deposit growth does not lead to credit growth. It is actually the other way round. Credit comes first and then deposit (both demand (M1) and Time (M3) deposit) happens.

To the extent CRR is taken out of deposits, reduction in CRR is unlikely to boost bank’s ability to create credit ie; to lend. What a CRR cut does is to reduce the bank’s own need for cash. Thus bank’s overnight borrowing from each other and from the central bank is reduced. The improved liquidity condition, post CRR cut tends to bring down overnight interest rate. As per the ‘conventional’ thinking if one connects these dots (which are correct) and extends the argument  that to the extent banks themselves would have to borrow less funds, at cheaper cost, for liquidity management, they conclude that the bank has more ‘money’ available for the purpose of lending. It is this conclusion which requires some rethinking. In this argument what is often missed is, as a banking system consisting of the central bank and all banking and lending institutions, the total money available has not changed in any meaningful way. So how is the banking system’s ability to lend increasing post a CRR cut? But more on banking system’s money creation ability later.

The Extent of Deposit Growth Problem

As of 31st March 2016, the growth rate in Demand Deposit (Component of M1) with bank was 11.8%(Y-O-Y). Though , the possible year end deposit collection drive , drove it to 13.7% in First week of April 2016. However, Time Deposit growth (Y-O-Y) for the same time frames were 9.5% and 9.1% respectively. As of 31st March 2016, the Notes in Circulation ie; Currency with Public grew by 14.9% (Y-O-Y). A year back, ie; 31st March 2015 the Y-O-Y growth of Demand Deposit, Time Deposit and Notes in Circulation was 10.7%, 9.8% and 11.3% respectively.

The 10-year average growth rate of Currency/Note in Circulation is ~14% and last 5 year average is ~ 12%. In that light the recent growth of Notes in circulation may also be seen as a reversion-to-mean, which moving back to long term growth of ~14%. It thus appears that the reasoning for crying wolf over increase in growth rate of currency/notes in circulation may be somewhat slim.

One can observe that post September 2015 there has been an uptick in growth of Notes in Circulation. However for the period April 2014 to September 2014, which is the period coinciding with the Lok Sabha election, the notes in circulation growth was around 10%. So the hypothesis that election causes notes in circulation is not supported by the data.

Volatile Nature of Demand Deposit Growth: Demand Deposits and Notes in Circulation typically constitute the M1 or narrow money. Bulk of demand deposit in India consists of current account deposits of businesses and to a smaller extent salary account. If businesses are undergoing liquidity stress, then demand deposit growth will suffer. If the corporates are over leveraged or bank’s risk appetite is low, both of which may be reflective of the current situation, and then growth in working capital credit is limited. This in turn will be reflected as poor demand deposit growth.

 As the long-term trends show demand deposit growth rate are very volatile and almost mimics systemic liquidity positions as well as business performance. So between September-December 2008 demand deposit growth was negative as well as during FY2012.For next 18 months it averaged a moribund 6%. These were periods of FX stresses and business uncertainty.

2

The trend in growth rate of Notes in circulation and Time deposit have been showing a long term falling trend since January 2009. Time deposit typically consists fixed deposit with the bank. So far we have seen nothing to conclude that the public is making structural preference shifts of holding cash as opposed to putting them in deposit.

No Structural Shift in preference for cash: In the overall money supply, the contribution of Time Deposit has actually been growing, while demand deposit has been falling. The proportion of Notes in Circulation has been broadly stable, or at any rate it is not showing a structural uptick.

3

As such the growth of Broad Money Supply; ie M4 has been showing a falling trend since 2007-08 with brief spurts in 2011 and then again in early part of 2014. In part it is due to falling inflation which is causing a slowdown in Nominal GDP.

4

As of now one may hope that the sequential fall in growth of money supply (M4) since 2007-08 is not a sign of something more ominous, such as a structural moderation of growth in India’s economic activity.

Credit Creates Deposit, not the other way round

Joseph Schumpeter in his book ‘History of economic Analysis’ wrote “It proves extraordinarily difficult for economists to recognize that bank loan and bank investment create deposit.” The text book definition of bank is so ingrained and well accepted that it has taken the form of an unquestionable dogma. And that dogma goes something like this-banks accept deposits from public, for the purpose of lending, repayable on demand or otherwise. As per Adair Turner, erstwhile Chairman of Financial Services Authority, UK the above description of banking in modern economies is “dangerously fictitious”. That is because banks do not need deposits to extend credit.

The very process of disbursing credit creates money in the system, some of which remains in the banking system as deposit and some of it gets drawn out of bank deposit and circulate as cash in the hand of public. This is effectively endogenous money creation. Of course the entire money in an economy is not endogenously created. A portion of it is exogenous as well. Exogenous money is created when governments directly distributes subsidies or spends in the economy directly or when foreign savings get transferred into the economy.

To appreciate, what happens at operational level when a credit is disbursed is key to understand how banks create money in the process of lending.  When a bank lends, it creates an asset, by debiting the borrower. Simultaneously the borrower’s deposit account is also credited with the disbursed amount. The borrower’s account can be either in the same bank or in a different bank. If it is in the same bank of course it will become a liability for the lender(remember double entry book keeping!). If the borrower’s account is in a different bank it will be a liability of that other bank. At any rate for the banking system as a whole a simultaneous credit creation as well as deposit creation occurs.

Now the borrower can write a check on that account and make payments, which will form deposit in the account of the receivers of that payment. Alternately the borrower can withdraw cash from cash counter of the bank or ATM and spend. In either scenario money gets created in an economy post credit disbursal. In one scenario it remains as deposit in another it adds to note/currency in circulation.

Specifically in India, since there is no long term shift in preference for cash it may be fair to assume that the deposit growth is falling because of slowdown in credit growth.

The relation between total credit and total deposit (demand plus time deposit) is functional or structural in nature and not stochastic. Thus when correlation is drawn on these two variables they are very close to 1.0 over a long period of time. So here is a case where a fundamental cause and effect relation may be validated by correlation. Of course the author acknowledges that correlation is a dangerous statistical tool and is more often abused than it is used.

5

However, when one tries to correlate a relationship between Deposit and Currency in circulation the relation is more complex, definitely not straight forward and thus very high element of stochastics  creeps in.

6

Given the wildly fluctuating correlation between Notes/Currency in circulation and deposits,analysts trying to explain the trajectory of deposit growth using notes/currency in circulation would sometimes have to resort to some interesting and unique explanations.

Conclusion

Indian banking system is currently struggling with NPA burden and huge credit losses. High amount of provision and write-offs is eroding profits for some banks while for others it is eroding their capital. As such it is not surprising that in general the banks may not have an appetite to lend. A combination of weakening risk appetite and in some cases constrained capital position, the supply of credit in Indian banking will remain muted for some time. The credit growth for next 18-24 months, is likely to be driven by retail lending. As such the overall credit growth is likely to be low since corporate credit accounts for bulk of the banking system loan book.

Corporates are either over leveraged or are struggling with over capacity issues and do not have investment requirement. The bespoke good corporates are unlikely to take credit now and the banks will not lend to over-leveraged corporates. To the extent bulk of the banks’ credit creation, creates money in the economy a chunk of which enters the bank deposit, poor credit growth will translate to poor deposit growth.

However the bigger and possibly more worrisome problem may be there. If a section of senior banking professionals or persons who may have an influence in policy making, do not have an appropriate understanding of bank’s money creation ability then they may cause sub-optimal decision making at policy or business levels. Ascribing inappropriate reason for the malady, will cause them to prescribe wrong medicine which will delay the patient’s recovery.

Reference:

a)Where Does Money Come From? : Ryan-Collins , Greenham, Werner , Jackson

b)Loans First-Explaining Money Creation by Banks :Arnab Kumar Chowdhury

c)Between Debt and The Devil: Adair Turner

d)History of Economic Analysis: Joseph Schumpeter

e)Modern Money Theory: L.Randall Wray

A Bit of Bitcoin

Germany is considering abolishing €500 notes and introducing a €5,000 limit on cash transaction in order to cut off terrorist financing in Europe. In 2012 Spain banned all cash transactions above €2,500. Italy and France have already outlawed all cash transactions above €1,000. Norway declared that it will be cashless by 2020. Many banks in Norway and Sweden do not carry cash. Therefore, increasingly many nations are moving towards electronic payment systems thereby forcing citizens to leave audit trail of every transaction. This is quite useful for the regulators to track any terrorist spend and also for the market analysts to analyse abnormal spending behaviour of consumers. Government would be able, through elective payment systems, to electronically observe and regulate all economic transactions. This would in turn help any government in framing budgets and social schemes. This system of paperless spending would also, hopefully, remove black money from the system. The need for and cost of printing notes will also be reduced. Japan and European Central Bank have lately announced negative interest regime. This implies that banks would charge interest to the depositors. Similarly, the central bank would charge commercial banks for putting money with the central bank. Therefore, negative-interest policy is an effort to force banks to provide more loans and thereby help economic growth. Many investors, in a negative interest territory, would take their money out of the banking system and this is a big worry. Therefore, one way the regulator can force people to keep money with the bank, even in a negative interest scenario, is to make it difficult or illegal to withdraw money. This is possible by banning cash transactions! Another option seriously being considered in Germany is to tax any cash withdrawals in order to encourage people to keep their cash with the banks.

Closer home, the Reserve Bank of India is also contemplating banning older paper currencies (before 2005) and experts are of the opinion that following European examples, India should abolish ₹1000 notes for similar reasons. However, an analysis[1] shows that the cost of banning paper currency of denominations ₹1000 and ₹500 is quite high (Figure 1). It may be observed that the share of larger denomination notes has been on the rise and so is the net increase in the value of currency. Hence if RBI decides to withdraw these paper notes of higher denominations it may have huge impact on the notes in circulation. Also the cost of printing larger denomination paper notes is lower compared to smaller denominations.  However, these arguments do not hold ground against larger cause for banning paper currencies. Higher denominated currencies can always be exchanged for lower denominations. Alternatively, the Reserve Bank may encourage electronic payments for higher value consumption/investments.

Use of plastic (electronic payments) or phone has become more widespread globally to make payments mainly for its convenience. But paper currency is popular among many citizens- those who do not trust the banks or the government. Many individuals consider government’s decision to ban cash transaction as interference with one’s freedom- freedom to hold cash outside the banking system. Freedom from government monitoring and control. The urge for such freedom is more in countries under rule of dictators and with weak banking system. This is true that small investors or ordinary citizens would not be affected much by withdrawal of higher denomination currencies from the system.

ab

Source: http://www.livemint.com/Politics/fhNlITluEPxCOHef3GSA6H/Scrapping-Rs500-Rs1000-notes-a-costly-idea.html (accessed on 29 March 2016)


Problem with third-party payment system

All electronic payments presently have to rely on financial institutions serving as reliable third parties to process payments. Typical examples of trusted third parties are Visa, Mastercard, and American Express. When an electronic payment is made for a transaction between a merchant and a consumer, these third parties act as middlemen to settle the payment. The middleman may at any time and for any reason reverse the payment regardless of the contract between trading partners. For example, a customer, not satisfied with the quality of the product, may ask for refund from the merchant. If the merchant fails to oblige, the same customer may approach the ‘trusted’ third-party (Visa, Mastercard etc.) to reverse the payment and the third-party may oblige the customer. Another problem with third-part payment is exorbitant cost that a merchant (or at times a customer) has to bear. The payment processing fee can be anywhere between 1.5% and 2.5% of the merchandise value which could be quite prohibitive for small traders.

Enter Bitcoin

Money started in modern times in gold and silver. In other words, the famous gold standard would require pledging of physical gold against issue of new currency. Later, gold standard was abolished and today the value of money depends on its purchasing power which is largely subject to the whims of planners and government.  Money (paper currency) is increasingly becoming notional with wire transfers and payments through debit/credit cards. The computer geeks were working since 1990 to come up with digital currency which would not require any vault or storage facility. The problem with initial experiment was that any digital version of currency was reproducible and hence was vulnerable to double and triple spending. Reproducibility may be a good thing for an object of art- a painting or a song. But unlimited use of a digital instrument is a major impediment as a medium of exchange. A currency is useless unless it is scared and its replication is controlled. Enters Bitcoin!

Bitcoin is a digital currency that operates in a peer-to-peer network without the requirement of a third-party vendor. The payment processing costs for such currency is also negligible. Another advantage with Bitcoin system is almost no possibility of reversal of transaction. The absolute privacy of transaction also makes it attractive. How does Bitcoin work?

Traditional currencies are mostly issued by central banks. Bitcoin has no central monetary authority. Bitcoin replaces a trust-based model (Visa, Mastercard etc.) with a payment system based on cryptographic proof. Such a system allows two willing parties to trade directly and settle payments without the need for a ‘trusted’ third party. Bitcoin was launched in 2008 by an unknown Japanese with a pseudonym Satoshi Nakamoto[2]. This represents the first successful implementation of a crypto currency. The electronic payments by the Bitcoin are performed by generating Transactions that transfers the Bitcoin between the two peers of the network. Each owner can transfer the coin to the next by digitally signing a hash of the previous transaction and the public key of the next owner and adding these to the end of the coin. A payee can verify the signatures to verify the chain of ownership[3].  Every Bitcoin has an owner and each owner has access to full ledger of all Bitcoins. This helps anyone in the system to check the title of each Bitcoin and thereby ensures that one coin is not used more than once at the same time.  Nakamoto put a limit on the number of coins that can be mined (21 million by 2140).

ab1

Source: Satoshi Nakamoto, Bitcoin: A Peer-to-Peer Electronic Cash System, https://bitcoin.org/bitcoin.pdf

Interestingly, Bitcoin went live on November 1, 2008 at the peak of financial crisis. Following financial crisis several governments have bailed out companies and banks by printing notes and thereby pumping in more money into the system. It seemed that supply of currency is unlimited and hence lesser purchasing power. But Bitcoins are in limited supply and its public keys are strictly controlled and the ledger updated after every transaction. Its soundness could be checked constantly through instantaneous conversion to other currencies as well as to goods and services. In other words, one can own Bitcoins in digital wallet and use the same for buying goods and services. The market value of Bitcoins change due to demand-supply and also at times due to regulatory intervention. For example, during Greece financial crisis, government seized bank deposits to bail out the system and due to such stress on bank deposits, Bitcoin doubled in value.

Accounting System for Bitcoin

The integrity of the Bitcoin payment system rests on the reliability of the settlement process and ingenuity of every transaction. This is made possible by a robust system of accounting of every transaction in an electronic database, called Blockchain, which uses triple-entry accounting and consensus to establish ownership of bitcoin and validates payment. The traditional double-entry book keeping system mandates that every transaction affects two ledger accounts. Similarly, in double-entry system, a buyer and the seller records the same transaction as ‘payable’ and ‘receivable’ respectively.  Over/under statement of revenue or expenses is rampant in corporate financial statements. Auditors, being an independent entity, have to examine and report that financial statements represent a true state of affairs of a firm. In discharging that responsibility auditors are required to match transaction in the ledger with appropriate documents and records to verify the genuineness of a transaction. One may very well imagine that this may become a humongous task for auditors of large and complex organisations.

The triple entry accounting system, as proposed for recording transactions through Bitcoin, is an improvement over the traditional double entry system. In this system all accounting entries involving outside parties (e.g., purchase of goods, payment of tax, utility bills) are cryptographically sealed by a third entry. Take example of a sale transaction. In a double entry system, the seller ‘debits’ cash and ‘credits’ income in one set of books. The buyer ‘debits’ inventory and ‘credits’ cash in a separate set of books. The matter ends there and there is no third party entering the same transaction. This is where the blockchain comes in to tie these two independent set of books of accounts. In a blockchain system, these entries are recorded in the form of a transfer between wallet addresses in the same distributed, public ledger thereby creating an interlocking system of permanent accounting records. Each transaction is thus entered in a distributed way and cryptographically sealed. Hence, misrepresenting any transaction or over/under invoicing is almost impossible. Therefore, in addition to double entry system (which would be carried out in respective books), a third entry will be maintained in an electronic ledger (blockchain) that is authenticated using cryptography and securely sealed. Auditors would find such system of accounting extremely useful as they need not bother about genuineness of any transaction under blockchain method. Hence, they can send quality time in verifying the internal control system and risk measures of any organization.

Bitcoin or any other crypto currency is not free from security concerns and liquidity issues. Money or currency is still popular because of its liquidity- it is available when you need it and it can be used as medium of exchange in most of the transactions. Since Bitcoin is limited in supply and all merchants do not yet accept Bitcoin, its liquidity is an issue to be addressed. Online wallets are more vulnerable to attacks and hence need to be encrypted.  Double spending is still a major area of concern in Bitcoin. Though encrypted technology makes Bitcoin less vulnerable to abuse, one would need proper regulation to ensure that terrorist do not create a close network (through miners) to undertake transactions using Bitcoin.

[1] http://www.livemint.com/Politics/fhNlITluEPxCOHef3GSA6H/Scrapping-Rs500-Rs1000-notes-a-costly-idea.html (accessed on 29 March 2016)

[2] Satoshi Nakamoto, Bitcoin: A Peer-to-Peer Electronic Cash System, https://bitcoin.org/bitcoin.pdf

[3] Ibid p 2

The Union Budget 2016-17, and the Financial Sector Reforms

The hype and hoopla about any Union Budget in India is phenomenal and almost unheard of anywhere else in this lonely planet.  In consonance with the disproportionate media attention to the annual income expenditure statement of the Central Government, the Union Budget in India is often used as an annual policy announcements of the Government that goes beyond the normal perimeter of fiscal policy and book keeping of the Exchequer.  The Union Budget of 2016-17 was no exception. While in terms of sublime, it was viewed as a a budget primarily with an agricultural or rural thrust, financial sector is an area where this year’s Budget spent some space and tried to give some directions about the shape of things to come in Indian financial sector.

Specific Proposals

In terms of specifics, insofar as Indian financial sector is concerned number of policy prouncements have been done. Illustratively, in the realm of specific legal reforms, the Budget talked of three specific proposals:

  1. introduction of a comprehensive Code on Resolution of Financial Firms;
  2. amendments in the Securitisation and Reconstruction of Financial Assets and Enforcement of Security Interest Act (SARFAESI Act), 2002 so as to “enable the sponsor of an ARC (Asset Reconstruction Company) to hold up to 100% stake in the ARC and permit non institutional investors to invest in Securitization Receipts”; and
  3. comprehensive Central Legislation to deal with the menace of illicit deposit taking schemes.

The Budget announcement of permiting 100 per cent FDI and Sponsor ownership on ARCs is likely to boost the effectiveness of ARCs in resolution of distressed assets. The finance minister also indicated that the Bankruptcy code will be introduced during the year.

Statutory basis for a Monetary Policy framework

The necessity of a monetary policy framework has been emphasized by the RBI for quite some time.  In fact, the government last year had proposed to set up a Monetary Policy Committee (MPC) consisting of representatives from the Finance Ministry and RBI, to decide on interest rate. Last year witnessed some controversy about the composition of the MPC. It was interesting to see that the Finance Ministered has announced to set up a Monetary Policy Committee through the Finance Bill 2016. RBI has already welcomed the move and Governor Rajan in his first Ramnath Memorial Lecture delivered on March 12, 2016 in New Delhi went on to say:

“The RBI’s inflation-focused monetary framework will be strengthened by the constitution of the monetary policy committee mooted in the Finance Bill. While the RBI Governor will no longer be able to set monetary policy unilaterally, I believe shifting the decision to a committee is in the economy’s interest. Not only will a committee aggregate multiple views better than an individual can, it will offer more continuity, and be less subject to undue pressure. I believe the monetary reforms of this Government will stand out as one of its signal achievements”.


Financial Data Management Centre

The idea of a Financial Data Management Centre is not new. It has been mooted by the Financial Sector Legislative Reforms Commission (FSLRC) in 2013. Subsequently a committee was formed by the Ministry of Finance, Government of India for  looking into the creation of a repository of all financial regulatory data  in September 2014.  It is in this backdrop that this year’s Budget proposed to set up a financial data management centre to facilitate integrated data aggregation and analysis in the financial sector. Here again while the idea is indeed welcome, one needs to see action on the ground to evaluate its efficacy.

Other Measures

 Among the other measures, this year’s Budget made the following announcement which have important bearing on India’ s financial sector. First,  the Budget has noted that new derivative products will be developed by SEBI in the Commodity Derivatives market. Second,  RBI will facilitate retail participation in Government securities.  Third, number of members and benches of the Securities Appellate Tribunal will be increased. Fourth, General Insurance Companies owned by the Government are to be listed in the stock exchanges. Fifth, target of amount sanctioned under Pradhan Mantri Mudra Yojana has been increased to Rs. 1,80,000 crore, whrein Micro Units Development and Refinance Agency (MUDRA) would provide funding to the non corporate small business sector for development and refinancing activities.

Bank Recapitalization

Indian public sector banks have been occupying newspaper headlines in recent times for the wrong reasons. Apart from specific corporate’s irresponsible behaviour this is reflected in banking sector’s bad loans. As per official data the gross non-performing assets (NPAs) of the Indian public sector banks have registered a huge increase – from Rs 53,917 crore in September 2008 to Rs 3,41,641 crore in September 2015. As a percentage of the total loans, NPAs has grown from 2.11 per cent to 5.08 percent.  This called for huge need of recapitalizing Indian banking sector.  It is in this context that the Budget announced Government’s intention to allocate Rs.  25,000 crore towards recapitalisation of Public Sector Banks. This has boosted the public sector banks’ stocks in the capital market.  However, allocation of Rs 25,000 crore for recapitalisation of banks is only a patch with the total requirement identified at 1,80,000 crores  by the Economic Survey.

How far are these announcements going to solve the problems of the present ailing financial sector of India? It may be too early to pronounce any judgement on these policy announcements as the devil may lie in implemental and outcome details. Thus, while all these proposals are extremely important, given that the track records of the present Government in terms of implementing legal reforms is not exactly very encouraging, these proposed reforms could suffer from a syndrome of inability to finish the last mile. Hence, apart of treating these as well-intentioned and lofty proposals, there is not enough evidence to evaluate these proposals at this juncture.

*****

Gold Monetization Scheme: An Investment Opportunity

Gold as an alternative investment class is equally important as bond market and equity markets. It has been observed that gold not only provides enough returns to beat the inflation but also involves less risk as compared to equities and other financial instruments. Low or negative correlation of gold returns with the equities and other financial assets’ returns qualifies gold as a natural investment instrument for diversified portfolios. In addition, during economic recession, when equity markets perform badly, it has been observed that gold provides safe heaven for investors and investments moves from equity market to gold market.

In India, gold is used in wedding gifts, religious donations and for investment purposes. India imports around 800 to 1000 tonnes of gold every year which is a major contributor (around 25% to 30%) of trade deficit. This is highest gold demand of any country in the world. As Indian importers need to pay in foreign currency, therefore it has impact on the forex rates as well. In order to control for the trade deficit, Government of India has launched several schemes in the past. In 1992 gold deposit scheme (GDS) was launched by the GoI, but low interest rates on gold deposit and a non-transferrable security feature and low participation of individuals were the two main reasons of the failure of the scheme. In the year 2013, GoI imposed excise duties, banned gold coins import. GoI also launched 80:20 scheme, where 20% of the gold imported must be exported in the same or other form. But reporting of export of substandard jewelry forced government to abandon 80:20 scheme. These schemes are not very successful and had a very little impact on the import of gold.

Why, gold Monetization Scheme?

As we mentioned earlier that India imports around 800-1000 tonnes of gold every year and it contributes significantly in trade deficit and current account deficit. It is expected that India has around 20,000 tonnes of gold worth around $ 800 billion lying idle with the households, banks, temples, trusts etc. Any scheme that can mobilize around 1% of the gold will bring down around 25% of gold import every year. This may help in stabilizing currency and trade deficit.

Earlier gold deposit scheme allowed minimum deposit of 500 grams of gold and therefore it was not attractive for the individuals and low worth investors. In the new scheme named gold monetization scheme (GMS) launched on 5th November 2015, investors are allowed to deposit minimum 30 grams of gold that may be either in the form of jewelry or bullion. Investors are exempted from any tax liabilities such as capital gain, wealth or income tax on the interest payments received on gold deposits. In spite of the benefits mentioned above, GMS had attracted only 0.9 tonnes of gold till 20th January 2016. To make it more successful government with the consultation of other stakeholders has modified the scheme and new guidelines has been issued through master direction on GMS on 21st January, 2016 by the Reserve Bank of India. The modifications allow premature redemption after three years for medium term gold deposits and after five years for the long term gold deposits. Investors can provide gold directly to the refiners or through the purity testing centers. In order to increase the number of licensed refiners, Bureau of Indian Standards (BIS) has relaxed the licensing conditions. Now licensed jewelers are also allowed to act as collection and purity testing centers. This move is expected to increase around 10,000 centers across the country.

Through GMS government is expecting to consolidate gold reserves which may be use for the currency stability and for the other purposes. Government can sell the collected gold in the open market or short the gold in the derivative market with a carry which may reduce the cost of financing for the government.  In future, government can also issue financial instruments backed by gold which may provide cost effective and secure way of financing.

GMS will increase the supply of the gold which will help in decreasing the imports of gold and reduce the cost for jewelers. Investors will get interest on gold deposits which is lying idle. It will reduce the cost of storage of the gold and it will reduce security issues faced by households in keeping physical gold.

How to Invest in GMS?

The first step to invest in GMS is to get purity verification done through the hallmarking centers authorized by the GoI.  Then, investors need to open a gold saving account with banks where investors can deposits the verified gold. The interest rate will be decided by the concerned bank and it will be around 2% per year. Investors can deposit gold for the short term (1-3 years), medium term (5-7 years) and for long term (12-15 years). Interest rate will vary depending on the maturity of the deposit. E.g, for the gold deposit for medium term of 5-7 years interest rate applicable is 2.25% and for the long term deposits for 12-15 years interest rate is 2.5%.

Banks can use the gold deposits for their CRR/SLR requirements and can also sell or trade in commodity market. Jewelers can also take gold loan from the banks after opening gold loan account. Banks can collect gold from investors for a maximum period up to 15 years and can accordingly auction or provide loans to the jewelers or industrialists.

Issues and challenges

As we mentioned earlier that around 20,000 tonnes of gold is lying idle with the households, trusts etc. Around 60% of this is lying with the rural households. However the scheme allowed to deposit minimum of 30 grams of gold but still for the purity test individuals has to come from remote areas to the authorized centers which may be a bit challenging. Individuals enjoy the gold in the form of jewelry as they buy gold not only for the investment purpose but for ornamental value as well. Gold is a very liquid asset and can be sold easily in any form in nearby markets by the household if they want to liquidate it. In GMS there are restrictions for the minimum investment horizon. Investors who buy gold to gift ornaments at marriages or other occasions may find this scheme not very attractive.

Cost of purity verification, melting charges and stone removal charges would be borne by the investors. These costs may account around 2% of the total gold value or may be more than the interest earned in a year on the gold deposits. As customers have been provided the option to redeem either in cash or gold, this may increase the risk of the banks.  However, banks are free to hedge their positions against the short term deposits.

In short, GMS is launched with the objective to mobilize the idle gold for the productive use. Investors can get interest on the idle gold, where banks can use it for the CRR/SLR requirement and to provide gold loans to the jewelers, or can sell in the open market that ultimately help in reducing the gold imports and to maintain trade deficit. Any individual, firm, trusts, mutual funds can invest in this scheme. Minimum 30 grams of quantity of gold can be deposited in this scheme for short, medium and long term. Interest earned and any capital gain would be exempted from income tax. Premature redemption is allowed after a lock in period with some penalty on interest payments. At the time of the redemption investors will have the option to receive the payment either in cash or in gold.

******

India’s Current NPA Mountain: Result of Absence of Institutional Learning

India has been There Before

Last time it took 9 Years: In 1997, India’s banking system’s Non-Performing Loans to Total Gross Loans (NPLTGL) was 15.7 %( Source: World Bank). It took 9 years for the NPLTGL ratio (domestically referred as NPA ratio) to fall below 5 %( 3.2% in 2006). Between 1997 and 2002, the growth rate of Nominal GDP was 4.4%, real interest rate averaged at 7.7% and the NGLPTL reached 8.8% by 2002. Between 2002 and 2006 the nominal GDP of India grew at a rate of 16%, while during the period the real interest rate averaged 5.7%.

Here it must be highlighted that since the loan and NPL are nominal (not adjusted for inflation) the nominal GDP trajectory is more important than the real GDP.

Nominal GDP and Real Interest Rate: If an economy enters into a deflation mode (i.e.; systemic inflation becomes negative) then nominal GDP growth becomes lower than real GDP growth. Economy observers focussing only on real GDP, in such situations, may draw a dangerously incorrect conclusion that the economy is recovering and the economy’s bad debt problem would get resolved. But in practise the opposite happens.

Corporate Earnings (which are of course nominal) tends to come down and more companies find it difficult to service their debt. Thus the NPL (or Non-Performing Assets (NPA) as is often referred in India) actually worsens. While, the attractiveness of prevailing interest rate to business is driven by the real interest rate ie; lending rates adjusted for systemic inflation -The measure often used is GDP Deflator. To illustrate, at the cost of over simplification, if the nominal (prevailing) lending rates are 11% and the inflation is 10%, businesses would expect their revenues and earnings to grow at a brisk pace without presenting much challenge to service debt at an interest rate of 11%. However, if prevailing lending rates are 9% and the systemic inflation is 2%, most businesses would expect their revenue and earnings to grow at low single digit growth rates. They might not find the 9% rate of interest very enticing. However, in popular discourse some experts often focus on exactly the opposite. The focus on real GDP and nominal interest rate!

Almost back to 1997: The formally recognised NPA rate as of 30th September, 2015 was slightly above 5%. However, Mr. S.S.Mundra , Deputy Governor of RBI stated, at a banking summit organised by Confederation of Indian Industries(CII), that as of 30 September,2015 the amount of Gross NPA plus restructured loans plus written off loans stood at 14% of the Indian banking assets. And this may go up further by 31st March,2017 which is the deadline that RBI has set for Indian banks to ‘clean-up’ their books.

With nominal GDP growth hovering at sub 10% level(FYE16:8.6%) and real interest rate at around 7%, one may be forgiven for wondering if it would take a good six to nine years for the current the NPA rates to come down if the previous century’s experience is repeated. But one can always hope that things may not be that bad as they say ‘this time it will be different’.

The ‘NPA Cycle’

An Economic Event: In general bankruptcy/defaults are economic events. It is generally observed in most countries that system wide NPA rates rises when the economic growth moderates and NPA rates starts to fall when the economy revives. The worldwide NPLTGL ratio in recent decades peaked around 2000 (9.65%) and 2001(9.6%). Global economic activity revived post 2002. The global nominal GDP growth rate between 2002 and 2008 was 10.6%. The NPLTGL rate improved and reached its lowest level in 2007(2.7%). Of course it started creeping up and started hovering around 4%, where it remained till the most recent year of available data (2014) in the World Bank Database.

1

Here the point to be highlighted is that despite the Global Financial Crisis (GFC) in 2008, arguably one of the worst economic shocks post World War II, the global NPLTGL has not jumped back to 8%-9% level.

Of course one may argue that the problem of timely identification of default is not limited to India and the NPLTGL at a global level may be higher than the 4.23% reported in 2014. Still this is not even half of the peak NPLTGL levels seen in 2000. Given bulk of the banking assets are in North America and Eurozone, where default identification mechanism is relatively more robust than in emerging markets such as India, even after possible future adjustment the global NPLTGL number is unlikely to come close to 9%. Though it can be higher than 4.23%. However, in India the stressed asset rate is already 14% of banking sector assets and in all probability can move higher.

Questions Maturity of India’s Risk Management Practises: The retracement of systemic stressed assets levels at present to levels comparable to 1997-98 may suggest that the current NPA issues in India are not entirely due to pure economic cycles. Extra-economic factors had a huge role to play. The other doubt that may be raised is whether the Indian banking system had learned and remembered the lessons of the past. Has the improvement in the level of sophistication of Indian banking’s credit risk management systems, kept pace with the growing complexity of Indian economy and Indian corporates?

Previously, the NPA rate fell because economic growth shot up between 2002 and 2006. Likewise the fall in real interest rate also provided the necessary support to credit lead investment growth. Thus the fall in NPA rate till 2006 had a lot to do with the rise in the denominator (total banking system assets) and to a lesser extent on reduction in numerator (absolute level of Gross NPA). Under such circumstances it is possible that the learnings of risk management in Indian banking system has not been as widespread as one would have preferred.

However, the world economy is replete with examples of countries who faced high levels of stressed assets in 1990 and early 2000, but have learned their lessons well. Thus we see for a lot of these countries, the NPA rate (or NPLTGL for that country) has not shot up significantly post 2008.

Systemic Bad Debt Problem not uncommon: During the period 1997 to 2001 several countries had bad assets which were well over one-fifth of their total banking sector assets. Notable among them are Indonesia (1998:48.6%), Thailand (1998:42.9%), China (2001:29.8%), and Turkey (2001:29.3%). However, each of these country’s banking sector had taken the lessons to heart. So in the aftermath of GFC the impact on the banking sector’s stressed asset rate had been in check. While in India the stressed asset rate has kept on increasing since 2011 and is closing in to 1997 levels without showing any signs of a reversal at least over the next few quarters.

I have focussed on 34 prominent economies and studied the behaviour of their respective banking sector’s NPL/NPA rate. These 34 countries were divided into five categories:

  1. Most Steady Hands in Business b)Steady Hands with Minor Hiccups c) Learners d)Slow Learners e) New Students

Most Steady Hands in Business: Even among developed countries one may easily benchmark countries such as Norway, Sweden, Switzerland and Canada against others. These four countries have kept their systemic NPL rate in check over last two decades. To their credit, even post 2008 GFC, the incremental deterioration in their stressed asset ratio was unexceptional. While Norway, Sweden and Canada had consistently low systemic NPL rates, Switzerland has been a sharp learner as may be indicated by only a small spike in NPA rate in 2009 which of course was checked by 2011.

As per World Bank report during the period (2004 to 2014) the average days required for contract enforcement improved from 508 days to 314 days for Sweden and for Switzerland it improved from 417 to 390 days. With the exception of Switzerland (~45%) the other three countries had recovery rate in excess of 75%.

2

Given the maturity of their banking and systems, this controlled NPL rate across economic cycle as well as in response to economic shocks may not have been surprising.

3

Steady Hands with Minor Hiccups: Next would be countries such as Germany, UK, USA and Australia. Over two decades their systemic NPA rates has been in control, however there was significant slippage in 2008-09. USA which was in the epicentre of GFC as well as UK which had a high exposure to US economy showed the highest relative deterioration in stressed asset rate. However over the next six years despite very moderate economic growth the systemic NPL rate came down close to historical average. Of course apart from structurally advanced credit infrastructure the near –zero interest rate and quantitative easing also played their part to boost corporate earnings and reduce NPL rate

Learners: The previous two groups consisted essentially of developed nations with well-established institutions and highly evolved and efficient legal infrastructure. However, the learners essentially consist of emerging nations who have learned their lessons and were able to check the system-wide NPL rate post 2008. However, one should be cautious before singing praises for all these emerging market learners for two reasons. First, at least some of them have issues in prompt identification of distressed asset on similar lines as India. Second, a lot of them are heavily dependent on commodity prices or exports and the last word is yet to be said on their NPL rates. Still one thing that may be noted is that even if their NPL rate goes up post 2015, they are unlikely to come even close to the levels observed in late 1990s or early 2000.

4

One should of course separately mention Singapore and Japan. Post 2008 both these countries had very low to negative GDP growth but still there was no spike in their NPL rates.

5

Among Emerging markets the best learners are South Africa and Turkey. The blip they showed in their respective systemic NPL rate in 2009 were very insignificant and they were corrected in the next 1-2 years. Of Course South Africa is facing a tremendous challenge on its economic front and it will be worthwhile to observe how high the NPL rate goes.

6

Slow/Reluctant Learners: India may have well been part of this group along with Russia and Bulgaria, where NPL rates came down during period of economic boom and shows signs of shooting back to historically high NPL rate levels.

7

New Students: These are mostly Eurozone countries. These are currently having systemic NPL rates way above what they have experienced in the last two decades. Some of them such as Spain have a history of coming out of such crisis. While the problem has been a direct outcome of low economic activity which was a result of fiscal austerity in most instances, still the steps these countries may be taking may have important pointers for India.

8

9

The Indian Situation

 In India the present system is banking on the enactment of the bankruptcy code into law to help the current NPA situation. However, as the latest Companies Act related uncertainties suggests, passage of the bill in the Parliament is only the first step. Equally critical is the notifications of the law which would come up from the ministry. This can take anywhere between six to 24 months if not more. And assuming that the notifications which are the implementation details of the enacted law are reasonably unambiguous, the doubts continue as to how the country’s overburdened legal system would handle this extra burden. In all likelihood India’s current NPA crisis is yet to reach its peak and even if the bankruptcy code is enacted it will not provide any immediate help.

Besides one question that repeatedly gets pushed below the carpet is whether the banking system as a whole have sufficient knowledge and sophistication in the credit risk management sphere? Are they able to handle the complexity of the large Indian conglomerate? Do they have the requisite skills and bandwidth to look through the accounting numbers of Indian balance sheet, with some of them having possible forensic issues? It will be a surprise if the answer is yes.

*******

Debt Management Strategy for India

In the aftermath of the Fourteenth Finance Commission and Seventh Pay Commission reports, debt management has assumed critical importance for the Government to meet its fiscal deficit target. With developed countries being the latest victims of sovereign debt crisis, debt management has come to the forefront of major political and economic discourse. Keeping this in view, RBI has come up with a Debt Management Strategy for the creation of a more vibrant and robust debt market for the benefit of both the investors and the Government.

The fallout of financial crisis compelled the Central Government to augment the issuance of short term securities so as to provide a knee jerk stimulus to the economy.  Securities profile of outstanding debt indicates that 63.04 per cent of the debt fell into the 1-10 years maturity buckets in end-March 2011. However, the outstanding debt in this maturity bucket has plummeted to 58.59 per cent in end-March 2015. This is evident from Average Time to Maturity (ATM) falling from 10.59 years as on end-March 2008 to 9.60 years as on March-end 2012. With recovery we saw a gradual reversal of ATM to 10.23 years by end-March 2015 (Table 2). This can be attributed to the strategy of elongation pursued by the Government from 2010-11 onwards. At the global level, India falls into the category of countries having high ATM of domestic debt. Based on this criterion, India can breathe easy on the subdued rollover risk facing the debt market.

Objective of debt management has been to mobilise financial resources for the Government at low cost with prudent levels of risk attached to the debt portfolio. Scope of debt management strategy is restricted to active elements of domestic debt, marketable debt of the Central Government. With time, there will be a conscious effort to include entire stock of outstanding liabilities such as State Development Loans. External Debt as well as General Government Debt will also be included into the ambit of this debt management strategy. Section I deals with the debt profile of the Central Government while Section II will discuss the medium term debt strategy.


Section I: Debt Profile of the Central Government

The Central Government has accrued internal debt of Rs. 52,78,217 crore as of 2015-16 BE (37.4 per cent of GDP). Dated securities (Rs. 44,17,787 crore, 31.3 per cent of GDP) happen to be the major component accounting for 78.09 per cent of public debt and 83.70 per cent of internal debt. External debt stood at Rs. 3,79,331 crore as in 2015-16 (BE), 2.7  per cent of GDP (Table 1). Too much reliance on internal debt gives the Government space to consider foreign investors in the years to come.

Table 1: Central Government Debt (in Rs. Crore)

2010-11 2011-12 2012-13 2013-14 2014-15

(RE)

2015-16

(BE)

Public Debt (A+B) 2945992 3553519 4096570 4615250 5142284 5657548
A. Internal Debt 2667115 3230622 3764566 4240767 4775900 5278217
     Marketable Debt (i+ii) 2283720 2860805 3360932 3853594 4351684 4838152
(i)                 Dated Securities 2148851 2593770 3061127 3514459 3961381 4417787
(ii)               Treasury Bills 134869 267035 299805 339134 390303 420365
B. External Debt 278877 322897 332004 374483 366384 379331


Cost of Borrowings

The weighted average coupon of outstanding debt of GoI has gone up from 7.81 per cent in 2010-11 to 8.09 per cent in 2014-15. Despite increased borrowings over the years, the weighted average coupon has remained broadly stable.

 Weighted Average Maturity/Average Time to Maturity

A higher weighted average maturity will help in curtailing rollover risk. This is amply evident with the strategy implemented by the Government since 2010-11. WAM has gradually increased from 9.64 years in 2010-11 to 10.23 years in 2014-15 (Table 2).

Table 2: Weighted Average Maturity (in years)

Year Weighted Average Coupon (%)

of outstanding stocks

Weighted Average Maturity

(in years)

Outstanding as on end-March

2010-11 7.81 9.64
2011-12 7.88 9.60
2012-13 7.97 9.67
2013-14 7.99 10.00
2014-15 8.09 10.23

Risk Analysis

Recent events have brought forth the importance to identify the different types of risk the sovereign debt profile is exposed to and take appropriate measures to prevent them from aggravating. Some of them are discussed below:

Rollover Risk: It is the risk associated with rolling over debt under trying circumstances. This could be juxtaposed with harsh clauses for the Government like higher cost. Increasing the share of short-term debt to total debt reflects rise in rollover risk. Elongating the maturity has been the common practice to manage rollover risk.

Market Risks: It is on account of fluctuations in interest rate and exchange rate. This will have a direct impact on the repaying capacity of the Government. Market risks can be analysed through the following parameters:

  1. Fixed-Floating Rate Debt Ratio: While banks and financial institutions prefer to invest in floating rate bonds (FRBs), insurance companies, provident funds, pension funds prefer to invest in long-term bonds, inflation indexed bonds (IIBs) and zero coupon bonds.
  2. Percentage Maturing: This reveals the amount of debt maturing in the next 12 months as a percentage of the outstanding amount. The amount of market debt maturing in the next 12 months has fallen from 4.95 per cent in 2011 to 4.17 per cent in 2015. There has been a significant reduction in the magnitude of debt that needs to be funded at current rates over the last couple of years.

Concentration Risk: Due to the sensitivity of foreign investors to global macroeconomic performance, debt portfolio is dominated by domestic players. In view of getting more foreign participation, investment limit for the Foreign Portfolio Investors (FPIs) has been expanded in a phased out manner to $30 billion in G-sec.

Domestic investors are predominately captured by the commercial banks in short to medium tenor securities (Table 3). They have however reduced their share of Government security holding since 2008. On the other hand, insurance companies and provident funds have a strong hold in the long-dated Government securities market.

Table 3: Ownership pattern of GoI Dated Securities (% of total)

Category Mar 2008 Mar 2014 Mar 2015
Commercial Banks 51.26 44.46 43.30
Non-Bank PDs 0.34 0.11 0.31
Insurance Companies 24.78 19.54 20.87
Mutual Funds 0.79 0.78 1.89
Co-operative Banks 3.22 2.76 2.62
Financial Institutions 0.41 0.72 2.07
Corporates 3.48 0.79 1.25
Foreign Financial Institutions 0.52 1.68 3.67
Provident Funds 6.38 7.18 7.58
RBI 4.78 16.05 13.48
Others 4.38 5.92 2.96

Currency/Foreign Exchange Risk: Easy monetary policy carried out by developed nations has resulted in a fierce currency war with the developing nations running for cover. In the current scenario, exchange risk has acquired limelight due to globalization and interconnectedness. External debt as a percentage of public debt has decreased from 9.5 per cent in 2010-11 to 6.7 per cent in 2015-16 (BE).


Section II: Medium Term Debt Management Strategy (2015-2018)

For the given period of debt strategy (2015-2018), India is expected to continue on the growth trajectory, stay within the range of 4 +/- 2 per cent with regards to flexible inflation targeting as envisaged in the Monetary Policy Framework and stay resilient to international shocks due to sound macroeconomic environment. Medium Term Debt Management Strategy (MTDS) is based on the following assumptions:

  • MTDS has been prepared keeping internal debt into perspective since external debt forms only a small fraction of the total debt. A major part of the external debt is held by multilateral/bilateral agencies like, e.g. IMF, World Bank, which do not pose any serious risk.
  • As per the Medium Term Fiscal Policy Statement (MTFPS), Government of India (GoI) would be on the path of fiscal consolidation by reducing its Gross Fiscal Deficit from the current 3.9 per cent of GDP in 2015-2016 to 3 per cent of GDP by 2017-2018. This will help in restoring investor confidence especially among the foreign investors.
  • Nominal GDP is expected to be at 12.2 per cent and 12.4 per cent in 2016-17 and 2017-18 respectively as per forecast presented in the Union Budget 2015-16.
  • Borrowing cost in domestic market is expected to decline in the coming year in the backdrop of RBI pursuing easy monetary policy due to dwindling commodity prices internationally and clearing of bottlenecks on supply side at home.
  • Consumer Price Index (CPI) inflation will meet its target of 6 per cent in January, 2016 and 4 +/- 2 per cent by the end of 2016-17 thereafter.
  • Exchange rate risk is assumed to be a minor player in the GoI market.

Given these assumptions under different scenarios, RBI will be looking into the strategy to raise debt at low cost, mitigate risk and attach strategic benchmarks to important parameters for sustainable debt management.

Demand Assessment

Banking sector has seen a secular decline of its share of holding Government dated securities (Table 3). Part of this reason could be attributed to the reduction in Statutory Liquidity Ratio (SLR) over the last couple of years (from 25 per cent in November 2009 to 21.5 per cent at present). In view of preparing to align itself with international best practices by the implementation of Basel norms, RBI has permitted the SLR to be lowered further to 20.5 per cent by March 2017.

With cash flows of insurance companies, mutual funds, etc. having improved in the recent past, the time is ripe to focus on long term debt instruments.

Borrowing Strategy

No market borrowing has been proposed in the 0-5 year time bucket with the view of elongating maturity profile. While the market borrowing in the 5-9 years bucket has been proposed to reduce, the market borrowing in the 15-19 years bucket has been increased. Apart from this, borrowing in the 20 years and above has been assumed to increase. All relevant details can be found in Table 4 given below.

Table 4: Borrowing Strategy for different maturity buckets (% of total)

Maturity Bucket 2013-14 2014-15 2015-16 2016-17 2017-18
Less than 5 years 0.4 0.0 0.0 0.0 0.0
5-9 years 24.5 19.4 16.5 16.0 15.5
10-14 years 41.8 45.3 44.5 44.0 43.5
15-19 years 16.5 16.6 19.0 19.5 20.0
20 years and above 16.9 18.8 20.0 20.5 21.0
Total 100.0 100.0 100.0 100.0 100.0

MTDS and Debt Sustainability

If the market borrowing strategy so laid out is followed, there would be an increase in average time to maturity from 14.9 years in 2014-15 to 16 years in 2017-18. Debt-to-GDP ratio would see a decline to 31 per cent by 2017-18 unlike many other countries that are facing a debt trap. Even interest-to-GDP would see a drop to 2.3 per cent (Table 5). These numbers are achievable provided the debt strategy is followed.

Table 5: Debt Sustainability Indicators (Baseline Scenario)

Year Debt/GDP (%) Avg. Time to Maturity (years) Interest/GDP (%)
2013-14 32.7 14.2 2.6
2014-15 32.9 14.9 2.7
2015-16 32.7 15.6 2.6
2016-17 32.0 16.0 2.5
2017-18 31.0 16.4 2.3

There could be two alternate scenarios (Table 6). The first scenario portrays the Indian economy in a favourable situation while the second scenario projects the Indian economy to be in an adverse situation. While these two situations are based under certain assumptions, the baseline scenario is closer to reality.

In the first scenario, the nominal GDP is assumed to grow at the rate of 12.5 per cent, 14 per cent and 14.5 per cent in 2015-16, 2016-17 and 2017-18 respectively. Under these assumptions, debt-to-GDP ratio declines to 29.7 per cent, weighted average cost comes down to 7.08 per cent and the fiscal deficit as a percentage of GDP follows the path of fiscal consolidation.

The second scenario imposes harsh conditions on the Indian economy. This would result in counter-cyclical measures like the ones we saw after the financial crisis. This will lead to Government shoring up higher fiscal deficit in the face of distress thereby derailing the path of fiscal consolidation. This could erode investor confidence as well. As shown in the table below, there is a considerable strain on the major indicators of sustainable debt management.

Table 6: Assumptions and Sustainability Indicators (Scenario I and II)

Year GDP Growth (%) GFD/

GDP (%)

Debt/

GDP (%)

Wtd. Avg. Cost (%) Avg. Time to Maturity (years) Interest/

GDP (%)

Sc.1 Sc.2 Sc.1 Sc.2 Sc.1 Sc.2 Sc.1 Sc.2 Sc.1 Sc.2 Sc.1 Sc.2
2013-14 13.6 13.6 4.4 4.4 32.7 32.7 7.98 7.98 14.2 14.2 2.6 2.6
2014-15 11.5 11.5 4.1 4.1 32.9 32.9 8.08 8.08 14.9 14.9 2.7 2.7
2015-16 13.5 10.0 3.9 4.3 32.1 33.1 7.58 8.58 15.7 15.7 2.4 2.8
2016-17 14.0 10.5 3.5 4.5 31.1 33.2 7.33 9.08 16.2 16.2 2.3 3.0
2017-18 14.5 11.0 3.0 4.8 29.7 33.7 7.08 9.58 16.4 16.4 2.1 3.1

Sc.1 – Scenario 1; Sc.2 – Scenario 2

The above two scenarios along with IMF’s Article IV Consultation Staff Report points in the direction of India’s possible vulnerable situation in the event of slow- down of growth rate. Apart from this, India is poised in a comfortable situation with little downside risk emanating from debt unsustainability.

Raising Debt at Low Cost

Announcement for market borrowing is done in advance for each half year with details of the magnitude to be borrowed, maturity date, etc. put in the public domain. Transparency is a vital prerequisite for a vibrant debt market. Such efficacy promotes successful and competitive bidding thereby reducing the cost. It is necessary for RBI and the Government to engage with the market on a continuous basis. Opening up communication channels will help in faster dissemination of the debt management strategy.

The strategy to attenuate rollover risk by elongating weighted average maturity may seem appropriate but it carries with it the cost-risk trade off. Longer lifespan of debt would result in higher cost thereby increasing the burden on the Government to honour its commitment to stick to its path of fiscal consolidation. On the other hand, reducing WAM would result in an increase in rollover risk.

Risk Mitigation

Rollover/Refinancing Risk: The strategy to elongate maturity will help in truncating rollover risk. An issuance strategy to undertake buybacks/switches for debt with maturity less than 10 years of maturity will blend into MTDS. To take this strategy forward, 40 years bond were issued for the first time in October 2015.

Currency Risk: A diversified pool of investors is essential for the existence of a dynamic debt market. In view of this, a calibrated strategy to include a careful mixture of domestic and foreign currency debt is of paramount importance for the sustainability of the debt market. A careful watch needs to be kept on global macroeconomic factors which could impact domestic stability due to the sensitive nature of foreign investors.

Interest Rate Risk: Instruments such as FRBs and IIBs were introduced with the responsibility to cater to the needs of the investors with regards to alleviating interest rate risk.


Strategic Benchmarks

Strategic structure represents the composition of the important parameters in the liability portfolio of the Government. It sets realistic targets to achieve a well-diversified portfolio with minimum risk undertaking. The benchmarks mentioned below provide a roadmap to attain a sustainable debt portfolio (Table 7).

Share of Short Term Debt: The share of short term debt is set at 10 per cent of total debt. An additional leeway of +/- 3% is proposed to tackle unforeseen developments.

Average Maturity of Debt: In accordance with the strategy to elongate maturity, a benchmark of 10 years has been proposed for average maturity of the debt portfolio.

Indexed and Floating Debt: In view of the minimizing market risk by portfolio diversification, issuance of IIBs and FRBs has been proposed subject to existing market conditions.

Share of External Debt to Total Debt: To continue safeguarding sovereign debt from currency risk, the current level of external debt to total debt seems appropriate. A leeway of +/-3% has been provided due to volatility in currency valuation.

Table 7: Benchmarks for some important parameters

Indicator Benchmark Leeway
Domestic Marketable Debt – Short term debt 10% +/-3%
Weighted Average Maturity of Debt 10 years +/-2 years
Indexed and Floating Debt for Issuances during fiscal year 5% +/-2%
External Debt 8% +/-3%

Market Development

An efficient market is one which provides liquidity to market participants when required and provides Government debt at low cost. An efficient market as a precursor will go a long way in achieving this dual objective. It has been the Government’s constant endeavour to deepen G-sec market.

Objectives of the MTDS strategy (2015-18) can be achieved by the following actions:

  • Transparent issuance process by public disbursement of information on borrowing programme thereby making a level-playing field among market participants and discarding information asymmetry;
  • Diversification of maturity and investor profile;
  • Issuance of different instruments such as IIBs and FRBs to help market participants to handle their portfolio more efficiently;
  • Undertake switches/buybacks for effective liability management.

Masala Bonds: An Innovative Financial Instrument

Indian corporate sector borrowed around USD 20 billion in the first nine months of 2015 through external commercial borrowing (ECB) route and none through foreign currency commercial bond (FCCB) route. These borrowings have maturity anywhere between three and ten years.  The major risk that a borrower availing ECB faces is currency risk and Indian banks have, of late, refused to bail out many Indian corporate by way of refinancing. A couple of year ago (2013) a study by CRISIL had put the outstanding foreign currency loan of Indian corporates at over USD200 billion. What was more alarming was about half of such foreign currency exposure was unhedged.

Corporates typically make use of currency swaps and similar financial instruments to manage currency risk.  With the Indian rupee depreciating, the currency risk looms large and this may trigger possible default. In the past Indian firms were able to roll over their foreign borrowings owing to the willingness of the lenders to do so triggered mainly by easy liquidity conditions in the US. However, with the tapering of quantitative easing by the US Fed, such option may no longer be available.  With the devaluation of Chinese currency (Yuan) and fall in Indian currency, the burden of foreign currency borrowing is felt even more now.

Indian firms (mostly financial institutions) have issued US dollar-denominated foreign currency bonds in to the tune of about US$3 billion in the last six months of 2015 (Table) amd a much lower number (102 million Yuan) in Chinese Yuan. One can easily notice that the main motivation for issuing such bonds is very low coupons. But as mntioned earlier, the impact of falling rupee may overwhelm lower coupn rates.

Table: Issue of US Dollar Bonds.

Issuer Name Cpn Issue Date Maturity Amt ($ Million)
IDBI Bank Ltd/DIFC Dubai 4.25 30/11/2015 30/11/2020 350
Videocon Industries Ltd 4.30 30/12/2015 31/12/2020 97.2
ICICI Bank Ltd/Dubai 3.13 12/08/2015 12/08/2020 500
Adani Ports & Special Economic Zone Ltd 3.50 29/07/2015 29/07/2020 650
Reliance Industries Ltd 2.51 26/08/2015 15/01/2026 225
Prakash Industries Ltd 5.35 30/09/2015 01/10/2020 17.85
Adani Ports & Special Economic Zone Ltd 3.50 29/07/2015 29/07/2020 650
Export-Import Bank Of India/London 2.13 06/11/2015 06/11/2020 42.8
ICICI Bank UK PLC 1.45 28/09/2015 28/03/2017 50
ICICI Bank UK PLC 1.10 30/12/2015 29/06/2016 12
Axis Bank Ltd/Dubai 1.63 29/12/2015 29/12/2017 9
ICICI Bank Ltd/Dubai 1.56 04/12/2015 04/12/2018 100
Axis Bank/Hong Kong 0.00 27/07/2015 27/01/2016 20
ICICI Bank UK PLC 1.10 16/12/2015 16/06/2016 10
ICICI Bank UK PLC 1.05 22/12/2015 27/06/2016 10
ICICI Bank UK PLC 1.77 29/09/2015 29/09/2018 5
ICICI Bank UK PLC 1.42 19/11/2015 19/11/2018 5
ICICI Bank Ltd/Hong Kong 0.85 24/09/2015 24/03/2016 20
ICICI Bank UK PLC 1.77 29/09/2015 29/09/2018 5
ICICI Bank UK PLC 0.98 04/09/2015 06/09/2016 10
Total       2788.85

Source: Bloomberg

Therefore, Indian corporate sector was looking for an option to raise money in foreign currency without necessarily bothering about currency risk. Enter Masala Bond!

Features

Masala bond is a term used to refer to a financial instrument through which Indian entities can raise money from overseas markets in the rupee, not foreign currency. These are Indian rupee denominated bonds issued in offshore capital markets.  The rupee denominated bond is an attempt to shield issuers from currency risk and instead transfer the risk to investors buying these bonds.  Interestingly currency risk is borne by the investor and hence, during repayment of bond coupon and maturity amount, if rupee depreciates, RBI will realize marginal saving.  Experts believe that Indian currency is still a bit overvalued. In a way masala bond is a step to help internationalize the Indian rupee.  Investors in these bonds will have a clear understanding and view on the Indian rupee risks. Therefore, a stable Indian currency would be key to the success of these bonds. It is believed that as the investors in a masala bond will bear the currency risk, they would demand a currency risk premium on the coupon and hence borrowing cost for Indian corporates through this route would be slightly higher. It may still be cheaper if one considers the currency risk. Though raised in Indian currency, these bonds will be considered as part of foreign borrowing by Indian corporate and hence would have to follow the RBI norms in this regard. Under the automatic route, companies can raise as much as $750 million per annum through Masala bonds.

Issue of Masala Bonds

The International Finance Corporation (IFC), an arm of the World Bank, issued the first masala bonds in October 2013 as part of its $2 billion dollar offshore rupee programme. However, no Indian corporate has yet issued any masala bond.

Two prospective issuers, India’s largest mortgage lender Housing Development Finance Corp. Ltd (HDFC) and the nation’s largest power producer NTPC Ltd, have been on the road to secure investors for such bonds since last month but are yet to launch their respective issues. HDFC began talking to investors early November while NTPC concluded it’s marketing a week ago.  HDFC initially wanted to raise USD 750 million. However, following its meeting with the investors, HDFC has decided to raise about USD 300 million in the first tranche with a maturity of five years.  NTPC has not yet announced the date and size of its issue.

Pricing of Masala Bonds

The critical factors for the success of such bond are two: (a) coupon rate and (b) liquidity of Indian currency.  India is rated BBB- by global ratings agencies—a notch above junk rating. Sovereign rating will influence pricing of these bonds.  HDFC, for example, had recently borrowed in the domestic market through a three-year bond at 8.35%. HDFC expects to fix a coupon rate at least 10 basis points lower than the domestic rate for the masala bonds. It was observed (see Table) that Indian banks were borrowing US dollar-denominated loan at under 4% in later half of 2015. If HDFC were able to issue masala bonds at 8.25%, it would imply a currency risk premium of above 4% per annum. Overseas investors are yet to decide their preferred coupon rate for the Indian masala bonds. Generally, given the view on Indian currency, investors are expecting a higher coupon from the issuers, which may make these bonds costly for Indian borrowers. This is the main reason holding back issue of masala bonds. If US Fed increases interest rate, that would make Indian masala bonds less attractive.

Allowing Indian firms to raise rupee-denominated loan from overseas market is a step towards full convertibility of Indian currency and the Indian central bank is supportive of this experiment. Despite initial glitches on pricing, masala bonds have potential to raise $5 billion in next two years. British government is wooing masala bond issuers and would like to position London as the global hub for offshore rupee financing.  The success of masala bonds would demonstrate overseas investors’ confidence on Indian currency. In other words, successful issue of these bonds by Indian corporate would imply faith on country’s macroeconomic fundamentals and the central bank’s role in currency management.