Does Monetary Policy influence Stock Market in India? Or, are the claims exaggerated?

Monetary policy announcements tend to attract to attract huge media attention. Illustratively, the Economic Times of April 5 2016 observed, “The Reserve Bank of India (RBI) on expected lines slashed repo rates by 25 bps and maintained an accommodative stance. The stock market reacted sharply with the benchmark indices losing close to 1 per cent in a hurry soon after the policy announcement”. There are several reasons for such perceived hype on the impact of monetary policy on the stock market. First, monetary policy announcements are much more frequent than their fiscal counterparts. Second, in standard macroeconomic models monetary policy tend to work through influencing private investment via changes in interest rates or through influencing net exports via changes in exchange rates. Thus, unless it is an abnormal time of a recession, the private players (including financial market participants) are far more comfortable with monetary policy actions.  One of the sources of this hype about the monetary policy is perhaps its perceived impact in stock market.  How does it happen? The popular perception is captured in Investopedia which commented, “The impact of monetary policy on investments is .. direct as well as indirect … The direct impact is through the level and direction of interest rates, while the indirect effect is through expectations about where inflation is headed”.

How far are such associations symptomatic in nature? Are the visual effects of the movements in monetary policy rates and the movements in stock price indices unable to decipher the truth (Figures 1 and 2)? Do these claims suffer from the logical fallacy of post hoc ergo propter hoc? Does such association stand rigorous tests? All these questions have huge practical relevance. I, along with two co-researchers, have looked into these questions for India in a recent paper using daily data over the period 2004-2014 and found the answer to be in general negative (with some qualifications).[1] Given this interesting result on lack of relationship between monetary policy and stock market, for the readers of Artha, the present write-up summarizes our findings and tries to make sense of this apparent non-relation between monetary policy and stock market in India.

 2

Methodology

It may be useful to start with a brief digression on methodology. Methodologically, the issue of association between monetary policy and stock market has traditionally been examined either via an event study approach or in a vector autoregression (VAR) framework comprising some monetary policy indicator, stock prices and related variables. While the event study approach looks at the movements in an “effect variable” (in this case, stock prices) in a before-after comparison, of late a new innovative approached have surfaced in. This method, known as, “identification through heteroscedasticity” (IH), uses a key result that, “if the structural shocks have a known correlation (usually 0), the identification problem can be solved by simply appealing to the heteroskedasticity of the structural shocks”.[2] Effectively, it looks at the variance of stock prices on policy days with the variance for non-policy days.[3] In this approach, the total period is divided into two sub samples: (a) policy days (P) and non-policy days (NP). Policy days are those when decisions are announced by the RBI while non-policy day refers to the previous day (over a two-day window). The technical details of the methodology are described in Annex 1.


Monetary Policy Announcements

Monetary policy announcements during the period 2004-2014 can be segregated into: (a) scheduled; and (b) non-scheduled, and (c) within market hours; and (b) after market hours.  The relevant frequency is reported in Table 1.

Table 1: Monetary Policy Announcements 

(April 2004 – March 2014)

Policy Dates Observations Direction Observations Timing Observations
Scheduled 52 Tightening 36 Within market hours 58
Non-scheduled 20 Easing 18 After market hours 14
No Change 18
Total 72   72   72

Interestingly, the literature distinguishes between anticipated and unanticipated monetary policy actions. How to use a proxy for unanticipated component of policy announcements? Since unlike the US there is no repo futures market for India, we use the 91-day Treasury bill rate as a proxy for surprise effect of monetary policy actions. After all, anticipated changes in monetary policy actions are already factored in the Treasury bill yields by the market and any change in yield after the policy announcements reflect the unanticipated component of policy decisions.

Empirical Results

Using both scheduled and non-scheduled policy announcements, we have tried to implement both an event study (ES) as well as IH approaches for estimating the impact of monetary policy on the stock market indices (proxied by three indices, Sensex, Nifty and Bankex). We found that that monetary policy have a negative impact on stock Indices but are these are statistically insignificant (Table 2). This finding is in line with observed trends for Germany, Hungary and Poland.

Table 2: Impact of Monetary Policy on Stock Prices: IV versus ES and GMM Results
IV

coefficients

ES

coefficients

Test of ES

versus IV#

GMM

coefficients

Over Identification Test (GMM)* Test of GMM

versus ES

Sensex -0.008

(0.59)

-0.002

(0.83)

0.324 -0.008

(0.64)

0.665 0.469
Nifty -0.006

(0.68)

-0.002

(0.89)

0.419 -0.006

(0.72)

0.677 0.555
Bankex -0.014

(0.47)

-0.012

(0.46)

0.826 -0.013

(0.54)

0.741 0.878
Note: #: Hausman Test for validity of the underlying assumptions of the event study (ES) estimator tested against instrumental variable (IV) approach. The standard p-values are given in this column.

* : P-value of Hansen’s J chi square value is given in this column.

Table 3 reports the results of the impact of non-scheduled policy announcements on stock market from IH and ES. The results indicate that monetary policy has a negative, albeit statistically insignificant impact, for ES and IH using IV method. The Hausman test statistic rejects the null hypothesis at 10% in favour of IH using IV method. In IH method using GMM, we find weakly significant (at 10%) impact of unanticipated monetary policy on the Sensex and Bankex. Expectedly, the impact on Bankex is higher than the Sensex. This is in line with the dominance of the banking system in the monetary transmission mechanism.

Table 3: Impact of Unannounced Monetary Policy on Stock Prices

: IV versus ES and GMM Results

IV

coefficients

ES

coefficients

Test of ES

versus IH #

GMM

coefficients

Over Identification Test (GMM)* Test of GMM

versus ES

Sensex -0.08

(0.19)

-0.022

(0.40)

0.054 -0.068*

(0.09)

0.311 0.105
Nifty -0.078

(0.20)

-0.020

(0.43)

0.055 -0.065

(0.12)

0.293 0.110
Bankex -0.103

(0.11)

-0.046

(0.17)

0.074 -0.092*

(0.08)

0.553 0.053
Note: #: Hausman Test for validity of the underlying assumptions of the event study (ES) estimator tested against instrumental variable (IV) approach. The standard p-values are given in this column.

* : P-value of Hansen’s J chi square value is given in this column.

The results presented above have found to be fairly robust and stood the test of a longer (viz., a three day) data window[4] and alternative measure of unanticipated monetary policy action by MIBOR FIMMDA-NSE Mumbai Inter-bank Offer Rate (MIBOR) for maturity of 3 months as in T-Bills.

Implications

            How can we interpret the results of relative insignificance of monetary policy to influence stock prices? Several conjectures may be put forward. First, the small and medium enterprises (SMEs), which constitute the bulwark of the industrial sector, continue to rely solely on bank finance as they have limited access to the stock market.  Second, during the period of our study, notwithstanding the impact of global financial crisis, the extent of uncertainty about Indian macroeconomic fundamentals was rather low. After all, with an average growth of above 7% and an inflation of around 6%, the Indian economy showed remarkable resilience amidst the global meltdown.  Third, the Indian stock market is quite open and globalized despite a phased and calibrated move towards capital account convertibility. In that sense, domestic monetary policy can have limited influence on FIIs’ investment decisions in India.[5] Fourth, there are limits to banks’ investment in the equity market limiting banks’ exposure to stock market activities.[6] Finally, the role of the stock market in capital formation in the country, both directly and indirectly, continues to be less significant.


Annex 1: Methodology of Identification through Heteroscadascity

            Following Rigobon and Sack (2004), the relationship between monetary policy (as captured by a short-term interest rate ) and stock price ) can be described by two simultaneous equations:

1

Note that Equation (1) is the monetary policy reaction function whereby the changes in the monetary policy or short-term interest rate (it) respond to the stock market index and a set of variables z, where z can be observed or omitted variables. Equation 2, on the contrary, is the asset price equation and models the changes in the stock market indices as a function of changes in the short-term interest rate and the variable z. Monetary policy shocks are  and stock market shock is ηt  .

The reduced form equations of equation (1) and (2) is given by

2

            The difference in the covariance matrix between the policy day (P) and the non-policy days (NP) then can be shown as:

3

From the above equation (5), we can estimate the desired parameter α using instrumental variables (IV) approach as well as by the generalised-method-of-moments (GMM) method.

            First, we group the changes in the two variables in the two subsamples i.e., policy days (P) and non-policy days (NP) into one vector with dimension of 2Tx1, where T is the number of policy days in the subsample. Since the number of observation is same for policy days and non-policy days, by combining them, the total observation becomes 2T. The new vectors Δi and Δs are given by

4

            The two instruments for estimating the IV approach (Rigobon and Sack 2004) are

5

Here, the instrumental variable wi is correlated with the dependent variable  but is neither correlated with  nor . It is correlated with ∆i because the greater variance in            sub-sample P implies the positive correlation between (∆i ′P) and (∆i ′P) of wi which more than outweighs the negative correlation between (∆i ′NP ) and (∆i ′NP ) of wi. It is neither correlated with zt nor ηt because the positive and negative correlation cancels each other out (Foley-Fisher et al 2013).

Given the two instruments, α which measures the impact of monetary policy on the stock market can be estimated by either of the following equations:

     6

[1] Edwin Prabu, Indranil Bhattacharyya, and Partha Ray (2016): “Is the stock market impervious to monetary policy announcements: Evidence from emerging India”, International Review of Economics & Finance, Volume 46, November 2016, Pages 166-179.

[2] Rigobon R (2003): “Identification through heteroscedasticity”. Review of Economics and Statistics, 85(4), 777–792.

[3] Rigobon R, and Sack, B (2004): “The impact of monetary policy on asset prices”, Journal of Monetary Economics, 51:1553-1575.

[4] In our sample, however, there were three occasions when the policy rates have been changed twice within a span of two to three days. Therefore, we were not able to define policy date and non-policy date without the overlapping of dates. Hence, we have excluded the overlapping dates from our sample.

[5] We have also examined the possible influence of unconventional monetary policy in the US on Indian stock market and were unable to arrive any systematic influence.  In order to estimate the impact of specific events on stock returns (2 day window), we employed an Event Study  methodology using dummy variable for each of the 24 US Fed announcement dates while controlling for surprises in the macroeconomic data releases using Citigroup economic surprise index for the US and the Nomura surprise index for India.

[6] Direct exposure in equities is restricted to 20% of net worth of a bank.

Basel III Framework for OTC Derivatives

The global financial crisis strongly brought forth the need for transparency and reduced risk in all financial transactions. This aspect has become even more important with relevance to transactions undertaken in the OTC derivatives market, which was identified as one of the potential causes of the global financial crisis. At the Pittsburg Summit in September 2009, G-20 leaders agreed that all standardized OTC derivative contracts should be traded on exchanges or electronic trading platforms, where appropriate and cleared through central counterparties (CCP) by the end of 2012 and additionally they agreed that all OTC contracts should be reported to trade repositories (TRs) and further in 2011 stated that non-centrally cleared contracts should be subjected to higher margin requirements. The Financial Stability Board (FSB) published its report on country specific commitments in six areas of reform in October 2012. They are: 1) standardization of OTC derivatives contracts; 2) central clearing of OTC derivatives contracts; 3) exchange or electronic platform trading; 4) transparency and trading; 5) reporting to trade repositories; and 6) application of central clearing requirements. Global regulators have embarked on a policy to encourage and even drive the settlement of all OTC derivatives through a CCP through either stipulating mandatory central clearing or adequate risk mitigation techniques for the OTC transactions which are not cleared centrally.

The Global Financial Crisis – OTC Derivatives

The failure of Lehmann Brothers Group in 2008 was the major driver for the G20s move to reform the global OTC derivative markets.  In addition to this, the bailout of AIG’s loss positions brought forth the absence of regulation in this market which had exacerbated the crisis. Market participants’ losses on account of their exposures to OTC derivatives were largely unquantified as such transactions were not regulated. During the crisis, the lack of transparency in the OTC derivative market and verifiable data on counterparty exposure fueled contagion fears. While CCPs like LCH.Clearnet could smoothly manage the Lehmann positions in the interest rate swaps market by utilizing a small portion of the margins, there were difficulties in unwinding of contracts in areas where CCPs were not involved. The crisis played itself in an acute manner in the market for credit default swaps (CDS), wherein each managed its own counterparty credit risk compared to other derivative markets with CCPs or exchanges.


Genesis of Basel III Norms

The Basel III regulatory set-up is the second major revision in the Basel I rules initially promulgated by the Basel Committee in 1988. Basel norms are a set of standards and practices that were put in place by the Basel Committee of Banking Supervision (BCBS) with the aim of ensuring that banks maintain adequate capital to withstand periods of economic stress and improve risk management and disclosures in the banking sector. The Basel III norms evolved out of the BCBS’s response to the global financial crisis and aimed to strengthen the banking system by eliminating the existing weakness in the Basel II norms. The norms prescribe higher risk weights for risky assets, higher regulatory capital requirements, raising the quality of capital, strengthening the liquidity related requirements and also plugging the weak points in the financial system by promoting CCP clearing of OTC derivatives and reducing dependency on external rating agencies.


Existing Regulatory Frameworks

Currently four regulatory reforms are expected to be relevant to counterparties in OTC derivative transactions: Basel III, Dodd Frank Act, the European Markets Infrastructure Regulation (EMIR) and the Market in Financial Instruments Directives/Regulation (MiFID)/ (MiFiR). Basel III addresses the capital and liquidity requirement of banks and pushes banks towards centralized clearing of their OTC derivative transactions. In the United States, the Dodd Frank Act works towards reducing systemic risk and increasing market transparency by mandating centralized clearing of OTC derivative transactions, margining requirements for such transactions, and improving pre and post trade reporting. In Europe, the European Market Infrastructure Regulation (EMIR) and the Market in Financial Instruments Directives (MiFID) are the two regulatory initiatives sought to be implemented towards reducing systemic risks in the OTC derivatives market. The EMIR focuses on reducing bank’s counterparty risks and mandates increase in margin requirements of bilateral OTC derivative transactions, centralized clearing and trade repository reporting for such transactions. The MiFID which is closely related to the EMIR seeks to address the trading and transparency issues in these transactions.

EMIR (European Market Infrastructure Regulation)

In pursuant to the Agreement between the European Parliament and Council in February 2012 on a regulation for more stability, transparency and efficiency in derivatives, EMIR (European Market Infrastructure Regulation), the Regulation on OTC Derivatives, Central Counterparties and Trade Repositories was adopted and came into force on August 16, 2012. This Regulation helped the European Union to deliver on its G20 commitments on OTC derivatives agreed in September 2009. EMIR affects all entities “established” in the EU (banks, insurance companies, pension funds, investment firms, corporates, funds, SPVs etc.) that enter into derivatives, whether they do so for trading purposes, to hedge themselves against interest rate or foreign exchange risk or to gain exposure to certain assets as part of their investment strategy. The clearing obligation applies to European Union firms which are counterparties to an OTC derivative contract including interest rate, foreign exchange, equity, credit and commodity derivatives unless one of the counterparties is a non-financial counterparty. EMIR has identified the two different groups of counterparties to whom the clearing obligation applies: Financial counterparties (FC) like banks, insurers, asset managers, etc. Entities other than FC are classified as Non-financial counterparties (NFC) which includes any EU firm whose positions in OTC derivative contracts (unless for hedging purposes) exceeds the EMIR clearing thresholds. Any ‘non-regulated’ EU entity will also be an NFC under EMIR. The existing clearing threshold in gross notional value for the various classes of derivatives are EUR 1 billion for equity and credit derivatives and EUR 3 billion for interest rate, foreign exchange and commodity derivative contracts.

The key features of EMIR are as follows:

  • Clearing: eligible OTC derivatives must be cleared through a central counterparty (CCP) if transacted between financial counterparties. Certain non-financial counterparties will also have to clear eligible OTC derivative contracts;
  • Reporting: counterparties (including CCPs and non-financial counterparties) must report derivatives trades (and any modification or termination) to trade repositories within one working day. This applies to both cleared and non-cleared trades;
  • Risk mitigation for non-cleared transactions: financial counterparties and certain non-financial counterparties must have processes which ensure timely confirmation of transactions (where possible, by electronic means) and monitor risk, the latter to include the exchange of collateral or the holding of appropriate capital; and
  • CCPs and trade repositories: the authorisation, supervision and regulation of CCPs and trade repositories are provided for.


MiFiD II

Markets in Financial Instruments Directive (MiFiD), which was implemented in equity markets since 2007 brought about significant changes in this market. The introduction of Multilateral Trading Facility (MTF) led to increased competition among trading venues, increased transparency, lowered transaction costs and bid ask spreads and led to faster trading times in equity markets. MIFID II/MIFIR (Markets in Financial Instruments Regulation) is the review of the MIFID to extend its benefits to a wider class of assets other than equity markets in view of the 2009 G-20 commitments in relation to OTC derivatives.

The key initiatives of this framework are introducing a market structure framework to close loopholes and ensure that trading takes place on regulated platforms. Toward this end it introduces a new multilateral trading venue, the Organised Trading Facility (OTF), for non-equity instruments to trade on organised multilateral trading platforms. It has laid down rules to enhance consolidation and disclosure of trading data and establishment of reporting and publication arrangements. It has provided for strengthened supervisory powers, effective and harmonized administrative sanctions and stronger investor protection. In order to encourage competition in trading and clearing of financial instruments, MiFiD II establishes a harmonised EU regime for non-discriminatory access to trading venues and CCPs. It also introduces trading controls for algorithmic trading in order to reduce systemic risks. It also provides for a regime to grant access to EU markets for firms from third countries. The MIFID II/MIFIR after endorsement by the national governments and the European Parliament officially came into effect on July 2014 and is proposed to apply to Member States by January 3, 2017.

Dodd Frank Act

Title VII of Dodd-Frank Wall Street Reform and Consumer Protection Act addresses the gap in U.S. financial regulation of OTC swaps by providing a comprehensive framework for the regulation of the OTC swaps markets. This Act divides regulatory authority over swap agreements between the Securities and Exchange Commission (SEC) and Commodity Futures Trading Commission (CFTC). It provides that the CFTC will regulate “swaps,” and the Commission will regulate “security-based swaps,” and the CFTC and the Commission will jointly regulate “mixed swaps. The key requirements under this include:

  • No Federal assistance may be provided to any “swaps entity” (i.e. swap dealers and non-bank major swap participants)
  • The CFTC will have jurisdiction over “swaps” and certain swap market participants, and the SEC will have jurisdiction over “security-based swaps” and certain security-based swap market participants. Banking regulators will retain jurisdiction over certain aspects of banks’ derivatives activities (e.g., capital and margin requirements, prudential requirements).
  • The Act creates 2 new categories of significant market participants – swap dealers and major swap participants. A ‘swap dealer” is a person who makes the market in swaps, enters into swaps as an ordinary course of business on his own account and is known in the market as a dealer or market maker in swaps. This term excludes persons entering into swaps for their own account individually or in a fiduciary capacity or depository institutions entering into swaps with their customers in connection with originating loans with those customers. CFTC and SEC also need to prescribe de minimis exception to being designated as a swap dealer. A major swap participant is any person who is not a swap dealer, but maintains a substantial position in swaps for any major swap category, whose outstanding swaps create substantial counterparty exposure or is a highly leveraged entity in relation to the capital it holds and is not subject to the Federal banking agency’s capital requirements and maintains a “substantial position” in outstanding swaps in any major swap category.
  • A swap must be cleared if the applicable regulator determines that it is required to be cleared and a clearing organization accepts the swap for clearing. Mandatory clearing requirement will not apply to existing swaps if they are reported to a swap data repository or, if in case of absence of one, to the applicable regulator in a timely manner. Further mandatory clearing is exempt if one of the counterparties to the swap is not a financial entity, using swaps hedge or mitigate commercial risk and notifies the applicable regulator how it generally meets its financial obligations associated with entering into non-cleared swaps.
  • The extent to which the swap must be cleared, it must be executed on an exchange or swap execution facility, unless no exchange or swap execution makes the swap available for trading.
  • Persons who are not eligible contract participants (ECP) must always transact via a swap only through an exchange.
  • Swap dealers and MSPs must be registered and will be subject to a defined regulatory regime. The relevant regulators will set the minimum capital and initial and variation margin requirements for swap dealers and MSPs.

The Volcker Rule is included as a part of the Dodd-Frank Act and effective from April 2014 onwards. It prohibits banking entities from engaging in short-term proprietary trading of securities, derivatives, commodity futures and options on these instruments for their own account. Exemption is provided for US Treasury Securities and municipal securities. It has also limited bank ownership in in hedge funds and private equity funds at 3%.


Basel III

The Basel III norms were released in December 2010 and were scheduled to be introduced from 2013 to 2015; but the changes introduced in 2013 further extended the implementation to 2018 and again further to 2019. With regard to the OTC derivatives, the interim norms released by the BCBS in July 2012, aim to incentivize centralized settlement of all OTC derivative transactions through CCPs especially qualifying CCPs (QCCP) who are compliant with the CPSS-IOSCO Principles by assigning risk weights of 2% for all derivative transactions cleared through a CCP. These norms also work towards ensuring that the risk arising from banks’ exposure to CCPs is adequately capitalized. The Basel Committee sought to improve on the interim norms in terms of reducing undue complexity, ensure consistency, incorporating policy recommendations of other supervisory bodies and the Financial Stability Board.  Towards this end it released its final policy framework in April 2014 largely retaining features of the interim framework, while adding provisions like a new approach to determine capital requirements for bank exposure to QCCPs, cap on capital charges on their exposure to QCCPs etc.

In addition to this, the Basel III rules following up on the counterparty credit losses incurred by banks during the crisis has introduced a credit valuation adjustment (CVA) in the calculation of counterparty credit risk capital, wherein banks have to calculate an additional CVA capital charge to protect against a deterioration in the credit quality of their counterparty in respect to their OTC derivative transactions. This CVA capital charge is not applicable for the bank’s transactions through a CCP.

OTC Derivative Transactions- Settled Through CCPs

The Basel Committees’ framework for capitalizing exposures to CCPs relies on the “Principles for Financial Market Infrastructures” (PFMIs) released by CPSS-IOSCO to enhance the robustness of CCPs and other essential infrastructure that support global financial markets.  The new Rules have elaborated on the two types of exposure that banks need to capitalize when dealing with CCPs- their trade exposure and default fund exposure. Trade exposure implies the current and potential future exposure of a client or clearing member to a CCP from OTC derivatives, securities financing transactions, including initial margin.  Default funds or guaranty fund contributions are the funded or unfunded contributions by clearing members to the CCPs mutualized loss sharing arrangements.

The Basel Committee released it interim framework for determining capital requirements for bank exposures to central counterparties in July 2012. These norms relied on the current exposure method to calculate the capital requirement of CCP. It also specified an alternate simplified method for clearing members to calculate the risk weight for their default fund exposures to the CCP. However, the interim norms were criticized for a number of reasons. It was stated that the Method I for calculating the default fund exposures relied on a simple capital methodology, the current exposure method (CEM), to define the hypothetical capital required by the CCP. This was designed for simple and fairly directional portfolios of bank and was thought to be too conservative for the diverse portfolios of CCPs. Further the CEM does not fully recognize the benefits of netting and excess collateral and does not differentiate between margined and unmargined transactions.

Taking into consideration the feedback received from respondents and in order to avoid undue complexity and ensure consistency, where possible, with relevant initiatives advanced by other supervisory bodies, the Basel Committee released its  revised standards for capital treatment of bank exposures to central counterparties in April 2014,.  These standards are proposed to come into effect from January 1, 2017 onwards. In comparison to the interim standards, the final standard incorporates a new approach for calculating the capital requirements for a bank’s exposure to QCCPs, caps explicitly the capital charges for a bank’s exposures to a QCCP, use of standardized approach for counterparty credit risk to measure the hypothetical capital requirement of a CCP and includes specification of treatment of multilevel client structures.

The broad framework of the Basel III norms for capital requirements for OTC derivatives is elaborated in the following table

Trade Exposure Activity Risk Weight
1. Clearing Member exposure to CCPs


Clearing Member of CCP for own purposes 2%
Clearing Member offering clearing services to clients 2% also applies to clearing member’s (CMs) trade exposures to CCP in case it’s obligated to reimburse client in case of default of CCP
2. Clearing member exposures to clients


Capitalize its exposure to clients as bilateral trades
Cleared transactions: exposure to clients can be capitalized by applying margin period of risk of atleast 5 days in Internal Model Method (IMM) or Standardized Approach for Counterparty Credit Risk (SA-CCR).
In case the clearing member collects collateral from a client for client cleared trades and the same is passed on to the CCP, then the clearing member should recognize the collateral for both the CCP-clearing member leg and the clearing member-client leg of the client cleared trade.
3. Client exposures In case a bank is a client of a clearing member and enters into a transaction with the clearing member as the financial intermediary or when it enters into a transaction with a CCP, with a clearing member guaranteeing its performance, then the client’s exposures to the clearing member may receive the same treatment of clearing member exposure to CCPs. 1.In case client is not protected due to default of the CM or another client of the CM and all other conditions are met then a risk weight of 4% will apply to the client’s exposure to the CM

2. In case the above conditions are not met and the bank is a client of the clearing member, then the bank’s exposure to the clearing member is classified as a bilateral trade.

4.Treatment of posted collateral


Apply risk weight applicable to the asset –
In case collateral is not held in a bankruptcy remote, then bank must recognize credit risk based on creditworthiness of entity holding the collateral
In case collateral is held by a custodian and is bankruptcy remote then it is not subject to capital requirement for counterparty credit risk.
If the collateral is held at the CCP on a client’s behalf and is not bankruptcy remote, 2%  risk weight is applied
All collateral posted by the clearing member or client, held by a custodian and bankruptcy remote from the CCP in case of the clearing member and also clearing members and other clients in case of clients, is not subject any capital requirement for counterpart credit risk.
In case client is not protected from default of clearing member or client of the clearing member then a risk weight of 4% is applicable
5.Default Fund Exposures


In case there is no segregation between products/business then risk weight for DF contribution to be calculated without apportioning between products
In case segregation exists between product/business types, then risk weight for DF contribution must be calculated for each product/business
In case the sum of a bank’s capital charges for exposures to a QCCP due to its trade and default fund contribution is higher than the total capital charge in case of a similar exposure to a non-qualifying CCP, then the latter total capital charge would be applied. The risk weight to the default fund may be calculated considering the size and quality of the CCP’s financial resources, the counterparty credit exposure to the CCP, the structure of the CCPs loss bearing waterfall. The calculation of the capital requirement for the Clearing Member (KCMi) is as per the steps listed in Box 1
6. Exposures to Non-qualifying CCPs  Banks must apply the Standardised Approach for credit risk for their trade exposures to a non-qualifying CCP. Banks must apply a risk weight of 1250% to their default fund contributions to a non-qualifying CCP.
BOX 1: Capital Requirement for Default Fund Contribution

The Final Standards have now done away with the ‘simplified method’ for calculating the default fund exposure and now specify only one revised ‘risk sensitive approach’ approach to calculate the capital requirement.  These calculations involve the following steps:


The hypothetical capital requirement of the CCP (KCCP) due to its counterparty credit risk exposures to all of its clearing members and their clients is calculated;


KCCP  =∑EADi  * RW *capital ratio    àwhere RW is risk weight of 20% and Capital ratio means 8%


EADi (Exposure at Default) is the exposure amount of the CCP to clearing member CMi, which includes CM’s own transactions and the client transactions that it has guaranteed and all values of the collateral held by the CCP (including the CM’s prefunded default fund contribution) against these transactions, with relation to its valuation at the end of the regulatory reporting date before the margin called on the final margin call of that day is exchanged. This is aggregated over all the clearing member accounts. In case the CM provides client clearing services and the clients’ transactions and collateral are held separately from the CM’s proprietary business, then the EAD for that member is the sum of the clients EAD and the proprietary EAD. In case the sub-accounts hold both derivative and SFT separately then the EAD of that sub-account is the sum of the derivative and SFT EAD. In case the DF contributions of the member are not split with client and proprietary sub-accounts, then the allocation has to be done as per the fraction of the initial margin posted for that sub-account in relation to the total initial margin posted for the account of the clearing member.


In case of derivatives, the EADi is calculated as the bilateral trade exposure the CCP has against the clearing member using the SA-CCR. The collateral of the client with the CCP, for which it has legal claim in event of default of the member or client, including default fund contributions of that member, is used to offset the CCP’s exposure to that member or client through inclusion in the PFR multiplier. In case of SFTs, EAD is equal to max(EBRMi – IMi – DFi;0) where EBRMi is the exposure value to clearing member ‘i’ before risk mitigation, IMi is the initial margin collateral posted by the clearing member with the CCP and DFi is the prefunded default fund contribution by the clearing member upon its default either along with or immediately after his initial margin to reduce the CCP loss.


1.      Second, calculate the capital requirement of each clearing member


2


The approach puts a floor of a risk weight of 2% on the default fund exposure. The KCCP and KCMi need to be computed atleast quarterly and also in case of any material changes to the number of exposure of cleared transactions or material changes to the financial resources of the CCP.

Credit Valuation Adjustment (CVA)

Basel documents describe CVA or the credit valuation adjustment as the fair value (or price) of derivative instruments to account for counterparty credit risk (CCR) or it could also be stated as the market value of counterparty credit risk.  In other words, CVA is the risk of loss caused by changes in the credit spread of the counterparty due to changes in the counterparty’s credit quality. Under the Basel II market risk framework, banks were required to hold capital against the volatility of derivatives in their trading book irrespective of the counterparty. There was no requirement to capitialise any risk due to changes in the CVA, and counterparty credit risk was addressed through a combination of default risk and credit migration risk using the CCR default risk charge.  During the financial crisis, CVA risk was a greater source of losses than outright defaults as banks suffered losses not from counterparty defaults but primarily from loss on the fair value adjustment on the derivatives as it became apparent that the counterparties were less likely than expected to meet their obligations. Roughly two-thirds of losses attributed to counterparty credit risk were due to CVA losses and only about one-third were due to actual defaults.

To address this gap in the Basel framework, the CVA variability charge was introduced as a part of

Basel III standards by the Basel Committee on Banking Supervision (BCBS) in December 2010.  This capital charge is applicable to all derivative transactions that are subject to the risk that a counterparty could default. The CVA capital charge is required to the calculated for all OTC derivative transactions except for transactions with a CCP and securities financing transactions (SFT), unless their supervisor determines that the bank’s CVA loss exposures arising from SFT transactions are material. The framework has set forth two approaches for calculating the CVA capital charge, namely the Advanced CVA risk capital charge method and the Standardised CVA risk capital charge. Both these approaches seek to capture the variability of regulatory CVA that arises solely due to changes in credit spreads without taking into account exposure variability driven by daily changes of market risk factors. Thus the CVA capital charge is calculated on a standalone basis, with no interaction between the CVA book and trading book instruments. The eligible hedges for calculation of CVA risk capital charge are single-name CDSs, single-name contingent CDSs, other equivalent hedging instruments referencing the counterparty directly, and index CDSs. In case CDS spread is not available then proxy spread should be used based on the rating, industry and region of the counterparty.

Another aspect of credit risk is the entity’s own credit risk in derivative transactions i.e. its debit valuation adjustment (DVA), which reflects the potential gain to the entity in its derivative transactions when it defaults as it may not have to post any money to its counterparty in such circumstances. The combination of CVA and DVA is usually referred to as ‘bilateral CVA’. In cases where the counterparty’s and the entity’s risks are independent, firms compute CVA and DVA separately and bilateral CVA is equal to unilateral CVA minus DVA. In case there is dependency between the counterparty risk and the entity’s risk then bilateral CVA is still equal to unilateral CVA minus DVA but their calculations in this case integrate the joint default probabilities of both the counterparty and the entity.

The Basel Committee has released a Consultative Paper, “Review of the Credit Valuation Adjustment Risk Framework” in July 2015 proposing a revision of the CVA framework laid out in the Basel III standards. The existing framework does not take into account the exposure component of CVA risk and therefore does not recognize the hedges that banks put in place to overcome the exposure component of CVA variability. The proposed framework makes is more consistent with the Fundamental Review of the Trading Book (FRTB) regime to better align the regulatory treatment of CVA with banks’ risk management practices. It proposes 2 different proposed frameworks to accommodate different types of banks, first is the FRTB-CVA framework, with 2 approaches- Standardised and Internal Models approaches and the second is the Basic CVA framework with banks not meeting the conditions or not having the internal resources to apply the FRTB-CVA approach. The proposed framework does not recognize the DVA component of bilateral CVA.


Margin Requirements for Non-Centrally Cleared Derivatives

Margin requirements for non-centrally cleared derivatives are required to reduce systemic risk and will help to promote central clearing in these instruments. The Basel Committee along with International Organization of Securities Commissions (IOSCO) in March 2015 released the policy framework which establishes minimum standards for margin requirements for non-centrally cleared derivatives which are proposed to be implemented in a phased manner over a period of four years (starting from September 1, 2016 and implementation fully effective September 1, 2020). The key requirements of the framework are:

  • Appropriate margining practices should be in place for all derivatives transactions not cleared by CCPs except for physically settled FX-Forward and Swaps.
  • All covered entities (i.e. financial firms and systemically important non-financial entities) engaged in non-centrally cleared derivatives must exchange initial and variation margin on a regular basis as appropriate to the counterparty risks posed by such transactions. The initial margin threshold should not exceed €50 million and has to be applied on a consolidated group level. All margin transfers between parties may be subject to a de-minimis minimum transfer amount not to exceed €500,000. Central banks, sovereigns, multilateral development banks, the Bank for International Settlements, and non-systemic, non-financial firms are not covered entities. At the end of phase-in period all covered entities with the minimum level of such derivative activity i.e. €8 billion will be subject to initial margin requirement.
  • Methodologies to calculate Initial and Variation Margin should be consistent across the entities and reflect the potential future exposure in case of initial margin and current exposure in case of variation margin and also ensure that all the counterparty risk exposures are covered with a high degree of confidence. Initial margin should be collected at the outset of a transaction and thereafter in case of changes in the potential future exposure in terms of addition or subtraction of trades in the portfolio. In case of variation margin the entire amount necessary to fully collateralize the mark-to-market exposure of the non-centrally cleared derivatives must be exchanged.
  • Assets collected as collateral for initial and variation margin should be highly liquid and after accounting for an appropriate haircut should hold their value in times of financial stress. The collateral should not have a significant correlation with the creditworthiness of the counterparty or the underlying non-centrally cleared derivative portfolio. Securities issued by the counterparty or its related entities should not be accepted as collateral. List of eligible collateral include Cash, High-quality government, central bank securities, corporate bonds and covered bonds, Equities included in major stock indices and gold. The BCBS and IOSCO have listed a standardised schedule of haircuts for these assets.
  • The initial margin should be exchanged on a gross basis and should be held in such a way that the margin is immediately available to the collecting party in the event of the counterparty’s default. The posting party should also be protected under the applicable law in case of bankruptcy of the collecting party. However cash and non-cash collateral collected as variation margin may be re-hypothecated, re-pledged or re-used.
  • Transactions between a firm and its affiliates should be subject to appropriate regulation in a manner consistent with each jurisdiction’s legal and regulatory framework.
  • Regulatory regimes should interact so as to result in sufficiently consistent and non-duplicative regulatory margin requirements for non-centrally cleared derivatives across jurisdictions.
  • These margin requirements are being introduced in a phased manner to align systemic risk reduction and incentive benefits with the implementation costs.
    • The requirement to exchange variation margin will become effective from September 1, 2016 for any covered entity in a group whose aggregate month-end average notional amount of non-centrally clear derivatives with any covered entity for March, April, and May of 2016 exceeds €3.0 trillion. It will apply to only new contracts and for other contracts it would be subject to the bilateral agreement. From March 1, 2017 onwards all covered entities will be required to exchange variation margin.
    • The stages for the exchange of two-way initial margin with a threshold of €50 million would be as follows: It would apply to the aggregate month-end average notional amount of non-centrally cleared derivatives for March, April, and May of the year under consideration of a covered entity subject to it transacting with another covered entity satisfying similar conditions
      • From September 1, 2016 to August 31, 2017 – €3 trillion
      • From September 1, 2017 to August 31, 2018 – €2.25 trillion
      • From September 1, 2018 to August 31, 2019 – €1.5 trillion
      • From September 1, 2019 to August 31, 2020 – €0.75 trillion
      • From September 1, 2020 onwards – €8 billion

Since the release of this policy framework various regulators in the Unites States, European Union, Australia, Canada and Japan have proposed rules for non-cleared OTC transactions largely consistent with the final policy framework with some divergence.

India-Current regulatory and Infrastructural Framework for OTC Derivatives

One of the key takeaways for India from the global financial crisis has been the relative insularity of the Indian financial system from the unraveling crisis in the global markets. This was even more prominent in the case of the OTC derivative market which faced the brunt of the crisis in those markets. The small size of the OTC derivative market, low level of complexity in products and regulatory structure has resulted in orderly development of the market in India. While OTC derivatives in the forex market have been operational since long, the interest rate OTC market was launched in 1999 for trading in interest rate swaps (IRS) and forward rate agreements (FRA). The RBI Amendment Act 2006 has laid down the regulatory framework for OTC interest rate, forex and credit derivatives. The responsibility for the regulation of all interest rate, forex and credit derivatives, including OTC derivatives, vests with the Reserve Bank of India (RBI). Further with  these markets being dominated by banks and other entities regulated by the RBI, trading in these derivative instruments is restricted to atleast one counterparty being a RBI regulated entity, which has enabled the close monitoring of this market.

The RBI in conjunction with market participants has undertaken many reform measures to implement the vision of the G20 reforms mandate in the OTC derivative market. With a view to guide the implementation of key reforms in this market, an implementation group for OTC derivatives was constituted on the directions of the Sub Committee of the Financial Stability and Development Council (FSDC) with representatives from the Reserve Bank of India and market participants, under the Chairmanship of Mr. R. Gandhi Executive Director, RBI. The
Report of this Implementation Group has served as the roadmap for the implementation of the reform measures in the OTC derivatives in India.

Trading, Reporting and Clearing Structure

In the interest rate derivative market, RBI has facilitated the development of the trading, reporting and settlement infrastructure. In 2007 based on RBI’s requirement, the Clearing Corporation of India (CCIL), the CCP which is regulated and supervised by RBI, started a Trade Reporting platform for all transactions in the OTC interest rate derivatives market. While initially reporting was limited to inter-bank transactions, all client level IRS transactions are also mandatorily reported on CCIL’s Trade Repository since December 2013. Further in order to strengthen and mitigate the risks involved in this market, CCIL operationalized a clearing and settlement arrangement for OTC rupee interest rate derivatives on a non-guaranteed basis in 2008. CCP based clearing for IRS transactions have been operationalized by CCIL since March 2014. The ASTROID trading platform was launched in August 2015 for trading in OTC derivative trades. In May 2016, the RBI acting on in its First Bi-Monthly Policy Statement for 2016-17 permitted entities regulated by SEBI, PFRDA, NHB and IRDAI to trade in interest rate swaps on electronic trading platforms. RBI has also specified that CCIL is the approved counterparty for IRS transactions undertaken on electronic trading platforms, where CCIL is the central counterparty.

In case of standardization, while transactions in the Overnight Index IRS market have been standardized as per the regulatory mandate, standardization has not been mandated as of yet for other interest rates and forex OTC derivative instruments. In case of the forex derivative market, CCIL has been undertaking settlement of inter-bank forex forward trades as reported to it since November 2002 from the Spot date onwards. CCIL started providing guaranteed settlement to forex forward trades from trade date onwards from December 2009. Since June 2014, all forex forward trades are mandatorily settled at CCIL. All inter-bank and client level OTC foreign exchange derivatives are now mandatorily reported on CCIL’s Trade Repository from December 2013 onwards. In case of trading, some maturities of forward trades can be concluded on CCIL’s FX-SWAP trading platform and the platform developed by CCIL and Reuters is available for trading in fx swaps.


Basel III OTC Derivatives Guidelines – Implementation in India

The first initiative with regard to the capital requirements for banks’ exposure to central counterparties was in July 2013, when RBI issued the first set of guidelines aimed at prescribing the capital requirements for bank exposure to central counterparties. For the first time, the guidelines differentiated between the capital requirements in case of banks’ exposure to qualified CCPs (QCCP) and non-qualified CCPs. The notification proposed that the guidelines have become effective from January 1, 2014 onwards. However, the implementation of the Credit Valuation Adjustment (CVA) risk capital charge for OTC derivatives was deferred from April 1, 2013 to January 1, 2014 and further to April 1, 2014 in view of the delay in the operationalization of the mandatory inter-bank forex forward guaranteed settlement through CCIL as the central counterparty.

Pre-existing norms

Under the earlier regulations, the derivative exposures of banks were classified as market related off-balance sheet exposures. These included interest rate contracts, foreign exchange contracts and other market related contracts specifically allowed by the RBI. Only foreign exchange contracts with original maturity of 14 calendar days and instruments traded on futures and option exchanges were subject to mark-to-market and margin payments. The exposures to CCPs, on account of derivatives trading and securities financing transactions outstanding against them were assigned zero exposure value for counterparty credit risk. A CCF (credit Conversion factor) of 100 per cent was to be applied to the banks’ securities posted as collaterals with CCPs and the resultant off-balance sheet exposure were assigned risk weights appropriate to the nature of the CCPs. In the case of CCIL, the risk weight was 20 per cent and for other CCPs, it was as per the ratings assigned to these entities. The credit equivalent amount of a market related off-balance sheet item, whether held in the banking book or trading book had to be determined by the current exposure method. The deposits kept by banks with the CCPs attracted risk weights, 20% in case of CCIL and as per external ratings for other CCPs.


 Current Capital Requirement Norms

The existing guidelines for bank exposure to CCPs came into effect from January 1, 2014. The key features of the existing guidelines are:

Trade Exposure Activity Risk Weight
1. Clearing Member exposure to QCCPs


 Clearing Member of CCP for own purposes  

2% risk weight based on bank’s trade exposure to QCCP, calculated by Current Exposure Method (CEM)

 2. Clearing member exposures to clients Capitalize its exposure to clients as bilateral trades
In order to recognize the shorter close-out period for cleared transactions, clearing members can capitalize the exposure to their clients by multiplying the EAD by a scalar which is not less than 0.71.
3. Client exposures to Clearing Member In case a bank is a client of a clearing member enters into a transaction with the clearing member as the financial intermediary or when it enters into a transaction with a QCCP, with a clearing member guaranteeing its performance, then the client’s exposures to the clearing member may receive the same treatment of clearing member exposure to QCCPs. 1.In case client is not protected due to default of the CM or another client of the CM and all other conditions are met and the CCP is a QCCP, then a risk weight of 4% will apply to the client’s exposure to the CM

2. In case the above conditions are not met and the bank is a client of the clearing member, then the bank’s exposure to the clearing member is classified as a bilateral trade.

4.Treatment of posted collateral


Apply risk weight applicable to the asset  – Banking Book or Trading Book
In case collateral is not held in a bankruptcy remote, then bank must recognize credit risk based on creditworthiness of entity holding the collateral
In case collateral is held by a custodian and is bankruptcy remote then it is not subject to capital requirement for counterparty credit risk.
If the collateral is held at the CCP on a client’s behalf and is not bankruptcy remote, 2%  risk weight is applied
In case client is not protected from default of clearing member or client of the clearing member,

but all other conditions mentioned in paragraph on “client bank exposures to clearing members” then a risk weight of 4% is applicable

5.Default Fund Exposures


In case there is no segregation between products/business then risk weight for DF contribution to be calculated without apportioning between products Clearing Members may apply a risk weight of 1250% of their default fund exposures to the QCCP, subject to an overall cap on the risk-weighted assets from all its exposures to the QCCP (i.e. including trade exposures) equal to 20% of the trade exposures to the QCCP i.e. the risk weighted asset both bank i’s trade and default fund exposure to each QCCP are equal to

* TE)}

Where TEi is bank i’s exposure to the QCCP and DFi is bank’s pre-funded contribution to QCCP’s default fund.


In case segregation exists between product/business types, then risk weight for DF contribution must be calculated for each product/business
6. Exposures to Non-qualifying CCPs  Banks must apply the Standardised Approach for credit risk for their trade exposures to a non-qualifying CCP. Banks must apply a risk weight of 1250% to their default fund contributions to a non-qualifying CCP.

Based on the framework finalized by the Basel Committee on Banking Supervision (BCBS), RBI released the revised guidelines to better capture the risk arising from OTC and also centrally cleared transactions in June 2016. The new guidelines are proposed to be implemented from April 1, 2017.


Comparison- Revised RBI and Basel III norms – Bank Exposures to CCPs

Basel RBI
Applicability Exposure to CCP in case of OTC, exchange traded derivatives and SFTs. –do—
A. Trade Exposure
1. Clearing Member exposure to CCPs Bank acts as clearing member of CCP for its own purposes -risk weight of 2% –do—
Exposure amount to be calculated using SA-CCR Exposure amount to be calculated using IMM or SA-CCR.
2. Clearing Member Exposure to Clients Capitalize its exposure to clients as bilateral trades irrespective of whether it guarantees the trade or acts as an intermediary –do—
Due to the shorter close-out period for cleared transactions, clearing members can capitalize the exposure to their clients by applying margin period of risk of atleast 5 days while computing the trade exposure using the SA-CCR. Due to the shorter close-out period for client cleared transactions, exposure to clients can be capitalized by applying margin period of risk of atleast 5 days in IMM or SA-CCR.
3. Client exposures to Clearing Members


Bank is client of clearing member and the clearing member is the intermediary in the transaction between the bank and the QCCP, then its exposure to the clearing member will receive treatment similar to “a clearing member’s exposure to a QCCP”. Similarly the client’s exposure to a CCP, guaranteed by a clearing member will receive a similar treatment. –do—
The collateral of the bank with the CCP must be held such that there is no loss to the client due to either default or insolvency of the clearing member, or his other clients and also the joint default or insolvency of the clearing member  and any of its other clients
In case of the default or insolvency of the clearing member, then the positions and collateral with the CCP will be transferred at market value, unless the client requests a close out at the market value. In case of the default or insolvency of the clearing member, then the positions and collateral with the CCP will be transferred at market value, unless the client requests a close out at the market value.
When the client is not protected from losses in case default or insolvency of the clearing member and one of its clients jointly, but all the conditions above are met, then a risk weight of 4% is applied to the client’s exposure to the clearing member –do—
In case the client bank does not meet the above requirements, then it would need to capitalize its exposure to the clearing member as a bilateral trade
4. Treatment of posted collateral Apply risk weight applicable to the asset –do—
In case collateral is not held in a bankruptcy remote, then bank must recognize credit risk based on creditworthiness of entity holding the collateral
In case collateral is held by a custodian and is bankruptcy remote then it is not subject to capital requirement for counterparty credit risk.
If the collateral is held at the QCCP or a clearing member on a client’s behalf and is not bankruptcy remote, 2% risk weight is applied to collateral included in the definition of trade exposures. This collateral must also be accounted for in the Net Independent Collateral Amount (NICA) while computing exposure using SA-CCR.
In case client is not protected from default of clearing member or client of the clearing member then a risk weight of 4% is applicable
B. Default Fund
5.Default Fund Exposures In case there is no segregation between products/business, then risk weight for DF contribution to be calculated without apportioning between products –do—
In case segregation exists between product/business types, then risk weight for DF contribution must be calculated for each product/business
a. The risk weight to the default fund may be calculated considering the size and quality of the CCP’s financial resources, the counterparty credit exposure to the CCP, the structure of the CCPs loss bearing waterfall
b. Clearing members need to calculate the risk weight to their default fund contributions on the basis of the risk sensitive formula specified in Box 1 above.  Same computations specified also by RBI also except that the capital ratio has been specified at 9% instead of the 8% as per the Basel norms.
c. In case the bank’s total capital charges for exposures to a QCCP for trade exposure and default fund contribution is higher than the capital charge that would be applied for a similar exposure to a non-qualifying CCP, then the latter capital charge would be applied. –do—
6. Exposures to Non-qualifying CCPs Banks must apply a risk weight of 1250% to their default fund contributions to a non-qualifying CCP. –do—
Margin requirements for Non-Centrally Cleared Derivatives

RBI in its First Bi-Monthly Monetary Policy Statement for 2016-17 had announced the release of a consultative paper outlining the Reserve Bank’s approach to implementation of margin requirements for non-centrally cleared derivatives. The paper was released in May 2016 and most of the proposals here are in line with above mentioned BCBS-IOSCO standards. The key features are:

·      The initial and variation margin will generally apply to all non-centrally cleared derivatives, with atleast one party under the regulatory preview of RBI. Physically settled foreign exchange forwards and swaps and transactions involving exchange of principal of cross currency swaps, will not attract initial margin requirements.

·      Margin requirements to be applied in a phased manner, to all financial entities (like banks, insurance companies, mutual funds, etc.) and certain large non-financial entities (having aggregate notional non-centrally cleared derivatives outstanding at or above Rs. 1000 billion on a consolidated group basis). No margin requirements for derivative transactions with sovereign, central bank, multilateral development bank and Bank for International Settlements.

·      Types of margins

o   Variation margin to protect against change in mark-to-market value of the derivatives and initial margin to protect against potential future exposure. The computation and exchange of variation margin should be done bilaterally on a daily basis.

o   Threshold for exchange of initial margin is Rs. 350 crore and would be applicable on a consolidated group level. Margin transfers between parties would be subject to a minimum transfer amount of Rs. 3.5 crore. The initial margin would be required to be exchanged bilaterally by the counterparties on a gross basis.

o   While initial margin is to be implemented in a phased manner, entities required to fulfill margin requirements need to have notional amount of non-centrally cleared derivative transactions outstanding of atleast Rs. 55,000 crore for initial margin requirements to be made applicable.

·      Margin Computation

o   Initial margin requirements to be calculated through 2 approaches: Standardised method (multiplying RBI specified factors with notional amount of the derivative transactions) and quantitative risk models after due validation by RBI. The Standard method requires computation of initial margin based on following:

            Asset class (derivatives) Initial margin requirement (% of notional exposure)
Credit: 0–2 year duration 2
Credit: 2–5 year duration 5
Credit 5+ year duration 10
Foreign exchange 6
Interest rate: 0–2 year duration 1
Interest rate: 2–5 year duration 2
Interest rate: 5+ year duration 4
Other 15

Initial margin requirement calculated through models should be atleast 80% of the amount computed using the above schedule.

o   Amount of variation margin is dependent on mark-to-market value of the derivative transaction and needs to be exchanged daily on a transaction-by-transaction basis.

·      The eligible collateral for exchange of the margins are Cash, Securities issued by Central Government and State Governments and Corporate bonds of rating BBB and above.

·      Appropriate haircuts, either model based or those specified by RBI, have to be applied to the collateral collected under initial margin.

·      Initial margin collected should not be comingled with other assets of the collecting party and it should be used only for the specific purpose of meeting the losses arising from default of margin giver. There is no need to separate margin collected as variation margin from other assets of the collecting party and it could also be re-hypothecated, re-pledged or re-used without any limitation.

·      Intra-group derivative transactions are exempted from scope of margin requirements, while in case of cross border transactions, RBI would co-operate with other regulators for application of appropriate treatment.

·      Transactions booked in foreign locations would follow margin requirements of foreign jurisdiction in case it is consistent with global standards else follow the requirement specified above.

·      The new requirements would involve operational enhancements and additional amounts of collateral entailing liquidity planning. Hence the new requirements will be implemented in phased manner.

o  Variation Margin: From September 1, 2016 entities whose notional amount exceeds Rs. 200 trillion have to exchange variation margin when transacting with an entity with similar scope for contracts entered into after September 1, 2016. From March 1, 2017 onwards, all entities within the scope have to exchange variation margin for contracts entered after that date.

o  Initial Margin: The requirement to exchange two-way initial margin with a threshold of up to INR 350 crore will be phased in as follows for all entities on the basis of their aggregate month-end average notional amount of non-centrally clear derivatives for the March, April and May of the year under consideration

§ From September 1, 2016  to August 31,2017 – notional amount exceeding INR 200 trillion

§ From September 1, 2017 to August 31, 2018 – notional amount exceeding INR 150 trillion

§ From September 1, 2018 to August 31, 2019 – notional amount exceeding INR 100 trillion

§ From September 1,2019 to August 31, 2020 – notional amount exceeding INR 50 trillion

§ On a permanent basis (i.e. from September 1, 2020) notional amount exceeding INR 550 billion


Impact Assessment of OTC Derivative Regulatory Reforms

The assessment of the macroeconomic implications of the OTC regulatory reforms was undertaken by the Macroeconomic Assessment Group on Derivatives (MAGD) under the aegis of the BIS. Comparing and assessing the long term consequences of the reforms programme the Group finds the main beneficial effect is the reduction of forgone output due to lower frequency of financial crisis and the main costs to be expected reduction in economic activity due to higher price of risk transfer and other financial services.

The main costs associated with the shift to the new regulatory regime are:

  • Costs of complying with new capital and collateral requirements and increases in the operational expenses inherent in central clearing.
  • The increase in capital requirements from the combination of CVA charge for uncollateralized OTC derivative exposures and trade and default fund exposures to CCPS.
  • Additional margin for OTC derivatives for non-centrally cleared trades or reallocation of exposures to CCPs.
  • The fees paid to CCPs for clearing and collateral management.
  • The demand for high quality collateral for central clearing and for margin requirements of non-centrally cleared derivatives could put pressure on pricing of high quality collateral and increase the costs of such transactions.
  • The extraterritorial application of regulatory frameworks for example the prescriptive rules under EMIR and the Dodd-Frank Act may prevent European/US banks from participating in third country CCPs currently not recognized by them. This could lead such CCPs being treated as non-qualifying leading to higher regulatory capital requirements for trade and default fund exposure, acting as a disincentive for OTC derivatives trading.

The benefits are:

  • These regulatory reforms collateralize the vast majority of exposures in the OTC derivatives market.
  • This leads to lower CVAs against these exposures and correspondingly increase the scale of severity of events required to precipitate a crisis.
  • Reduction of counterparty risk results in reducing the too-big-to-fail problem related to systemically important banks.
  • It could lead to better price differentiation and competition as greater standardization of products and lower counterparty risk will facilitate comparison of pre-trade prices.
  • Central clearing and use of collateral will lead to increasing unimportance of individual counterparty information.


Other Implications

An IMF study (Making Over-the-Counter Derivatives Safer: The Role of Central Counterparties), has estimated that collateral requirements related to initial margin and default fund contributions to amount up to $150 billion, assuming that existing bilateral OTCD contracts (credit default swaps, interest rate derivatives, other derivatives) are moved to CCPs. It states that the inability of banks to re-use through re-hypothecation and the possible fragmented CCP space could pose issues with a few sovereign’s debt management strategies. End-users of OTC derivatives could buy less perfect hedges by using cleared or standardised derivatives against bespoke and expensive non-cleared derivatives, exposing themselves to more risk on their balance sheets. The market could move towards Futurization i.e. shift from bilateral OTC markets to centrally cleared exchange-traded futures-style contracts. In addition to this the Basel III regulatory requirements, especially that of the leverage ratio has acted as an incentive for banks to reduce their derivative books and there has been an increase in compression activity in the interest rate derivative activity. This has resulted in a decrease in the notional principal outstanding is this market. As per the Global OTC derivative statistics released by the BIS, the IRD notional outstanding has decreased from USD 584.8 trillion at end 2013 to USD 384 trillion by end 2015.


Implementation Status

As per the final guidelines issued by the Basel Committee in April 2014, the standards for the capital treatment of bank exposures to central counterparties will come into effect on January 1, 2017. However, member countries of the Basel Committee on Banking Supervision (BCBS) seem to be making slow but steady progress in the process of adoption of these norms.

As per the Financial Stability Board’s Tenth Progress Report on Implementation of OTC Derivatives Market Reforms released in August 2016, many countries have put in force the legislative framework or other authority in place to implement the G20s OTC derivatives reform commitments. The implementation framework is the most complete in case of trade reporting and higher capital requirements for non-centrally cleared derivatives (NCCDs). Central clearing frameworks and to a lesser degree margining requirements for NCCDs have been or are being implemented, while trading platform systems were largely underdeveloped in most frameworks.


A substantial share of new OTC derivatives are estimated to be covered by reporting requirements in many jurisdictions, with the coverage most comprehensive for interest rate and forex derivatives. According to the Report, all but four FSB jurisdictions had requirements in force to cover 80-100% of the interest rate derivative transactions. As at end June 2016, TR or TR like entities were authorized and were operating for atleast some asset classes in 21 of the 24 FSB jurisdictions.

There has been progress in the move to promote central clearing, with 14 jurisdictions evolving a legislative framework with respect to over 90% of OTC derivative transactions to determine the products to enforce central clearing. Higher capital requirements for non-centrally cleared derivatives (NCCD) are in place in 20 of the 24 FSB member jurisdictions, which are now currently applicable to over 90% of OTC derivatives transactions. While the BCBS-IOSCO standards for margin requirements as scheduled to be phased in starting from September 2016, only 3 jurisdictions have scheduled to enforce the requirements with several jurisdictions announcing delays in implementation. As at end-June 2016, 19 jurisdictions have at least one CCP that was authorised to clear at least some OTC interest rate derivatives.

In the case of implementing the G20 commitment to promote electronic platform trading, the Report finds that while almost all jurisdictions have established a legislative basis towards this end, less than half of FSB members have evolved comprehensive assessment standards or criteria.

Conclusion

The sheer breadth and depth of new regulations in the OTC derivative market, ranging from Basel III OTC regulations, Dodd-Frank, EMIR etc., create significant challenges for banks, brokers and other major participants in the global derivatives market. The imposition of mandatory margins for both cleared and non-cleared transactions and demand for high quality collateral by CCP could pose collateral management challenges. The bifurcation of the market model between CCP settled and bilateral transactions could increase operational complexity. Finally CCPs could face challenges in holding and servicing the increased amount of collateral in their custody. Despite these challenges, the coordinated effort by global regulators and standard setting bodies in the OTC derivative market following the global financial crises bloodbath is an important milestone in the history of the global derivative market. Implementation of these regulatory measures is expected to be a stepping stone to achieve the goal of maintaining the integrity and stability of the global financial markets, and preventing the recurrence of financial crises in the future.


References:

  • Basel Committee on Banking Supervision: The standardised approach for measuring counterparty credit risk exposures, March 2014
  • The New Standardized Approach for Measuring Counterparty Credit Risk: Sara Jonsson and Beatrice Ronnlund, May 24, 2014
  • Basel Committee on Banking Supervision- Board of the International Organization of Securities Commissions: Margin requirements for non-centrally cleared derivatives, March 2015, September 2013
  • Macroeconomic Assessment Group on Derivatives: Macroeconomic impact assessment of OTC derivatives regulatory reforms, August 2013
  • Bank for International Settlements: Regulatory reform of over-the-counter derivatives: an assessment of incentives to clear centrally- A report by the OTC Derivatives Assessment Team, established by the OTC Derivatives Coordination Group, October 2014
  • JP Morgan: Regulatory Reform and Collateral Management- The Impact on Major Participants in the OTC Derivative Markets, 2011
  • Basel Committee on Banking Supervision – Consultative Document: Review of the Credit Valuation Adjustment Risk Framework, July 2015
  • Capital Requirements Directive IV Framework Credit Valuation Adjustment (CVA): Allen & Overy Client Briefing Paper 10, January 2010
  • Financial Stability Review: OTC Derivatives: New Rules, New Actors, New Risks, April 2013
  • Deloitte- EMEA Centre for Regulatory Strategy: OTC Derivatives – The new cost of trading, 2014
  • Reserve Bank of India: Discussion Paper on Margin Requirements for non-Centrally Cleared Derivatives, May 2016
  • Sea of Change-ISDA – Dodd Frank Act v. EMIR – Business Conduct Rules-Clifford Chance, October 2012
  • Morrison & Foerster: The Dodd-Frank Act: a cheat sheet, 2010
  • Bank for International Settlements: OTC derivatives statistics at end-December 2015- Monetary and Economic Development, May 2016
  • ISDA Research Note: The Impact of Compression on the Interest Rate Derivatives Market, July 2015
  • Shyamala Gopinath: Over-the-counter derivative markets in India – issues and perspectives, Article by Ms Shyamala Gopinath, Deputy Governor of the Reserve Bank of India, published in Financial Stability Review, Bank of France, July 2010
  • Reserve Bank of India: Implementation Group on OTC Derivatives Market Reforms, February 2014
  • PWC: MiFID II Driving change in the European securities markets, 2011
  • Basel Committee on Banking Supervision: Capital requirements for bank exposures to central counterparties, July 2012
  • CVA the wrong way: Dan Rosen and David Saunders, February 2012
  • Baker & Mckenzie: The Basel III Reforms to Counterparty Credit Risk: What these Mean for your Derivative Trades, October 2012
  • Reserve Bank of India: Capital Requirements for Banks’ Exposures to Central Counterparties, July 2, 2013
  • RBI Notifications
  • Basel Committee on Banking Supervision: Capital requirements for bank exposures to central counterparties, April 2014
  • Shearman and Sterling: Basel III Framework: The Credit Valuation Adjustment (CVA) Charge for OTC Derivative Trades, November 2013
  • European Banking Authority: EBA Report on CVA, February 25, 2015
  • Financial Stability Board: OTC Derivatives Market Reforms, Ninth and Tenth Progress Report on Implementation, July 24, 2015, November 4, 2015
  • OECD: Regulatory Reform of OTC Derivatives and Its Implications for Sovereign Debt Management Practices-Report by the OECD Ad Hoc Expert Group on OTC Derivatives – Regulations and Implications for Sovereign Debt Management Practices, OECD Working Papers on Sovereign Borrowing and Public Debt Management No.1

India Emerging: New Financial Architecture

Round Table


India Emerging: New Financial Architecture


Sankarshan Basu

Finance & Accounting, Indian Institute of Management Bangalore, Bangalore, Karnataka, India

⃰Corresponding Author: E-mail: sankarshanb@iimb.ernet.in; Phone: +91 80 26993078


Short Title: India Emerging: New Financial Architecture

Keywords: New financial architecture; Integrated financial architecture; De-regulation; Global Financial Crisis 2007-2008; Banking; Mutual funds;  Non-banking finance companies; Risk management


Abstract  

The global financial crisis of 2007 – 2008 highlighted the need to re-evaluate several well established tenets in the world of finance. Questions have been raised the world over about the existing paradigm, leading to an acceptance that new financial architecture needed to be evolved and that new models need to emerge, keeping in mind the multiplicity of socio-economic realities that exist round the globe. In this context, the imperative for a new financial architecture in India is quite evident, and the ensuing panel discussion throws up some India-specific issues that need to be explored by the various stakeholders involved in this attempt.


Perspective note to round table

The global financial crisis of 2007 – 2008 has questioned many of the beliefs held very strongly in the world of finance, in particular about the way the whole system was developed and sustained. The collapse of most of the large financial institutions in the capitalist capital of the world, the United States of America, and the subsequent requirement of huge governmental support in bailing out these institutions to preserve the stability of the social structure has led to regulators (both national and international), policy makers, researchers as well as practitioners questioning the very model on which they had built their reputation, leading to an understanding of the requirement for a new financial architecture to be followed, going forward.

We are now at the point where the need for the new financial architecture has been more or less universally accepted, but the exact form of the same is yet to be understood and accepted. In fact, it is highly probable that there will be not just one model but multiple models depending on the underlying social fabric and requirements, and hopefully all of the models will coexist.

The financial architecture that has been in use was conceived in the wake of the Great Depression of 1929 and was designed to address the issues arising out the economic conditions at that point. Over the last 70 odd years, the economic conditions around the globe have significantly changed. The Second World War and the development assistance plans that were put in place post the war by the developed nations meant that there was an abundance of capital to rebuild the world. This also meant that a lot of the regulators’ frameworks put in place in the immediate aftermath of the Great Depression were slowly but steadily dismantled; so much so that by the 1990s the entire financial markets globally (particularly the developed world) were subject to very little regulation.

On the other hand, financial markets in countries like India and China were still significantly controlled by the regulators, and in some cases by the governments themselves. In the good years, through till about 2006 – 2007, this meant that the perceived benefit of deregulation that most of the developed markets saw did not really percolate to these markets and hence these markets had a persistent demand for larger levels of deregulation. This has been coupled with the need for relatively high growth rates that these countries would require to sustain their economies – a growth rate of 8% – 9% going forward for a number of years. One of the obvious fallouts of these kinds of needs would be the fact that the standard financial architecture that existed would not be able to sustain this level of growth – in fact no one segment of the financial sector will be able to sustain the growth required; hence the possible need for an integrated new financial order or architecture integrating the banking sector, the mutual funds, and the non–banking finance sector. Another sector that probably would need to be formally included in this new order would be the organisations that collate and provide all the relevant financial information – as, going forward, information will be the key driver and more so in the financial sector.

While the new financial architecture needs to be developed, each segment of the finance industry will be impacted. The banking segment will probably the most impacted as it is the largest contributor to the financial sector. The need for financial inclusion in the country, the push for the same from the government, as well as the additional responsibilities and requirements thrust on them on account of the various regulatory mechanisms, for example the Basel  guidelines, will definitely make banking a whole new ball game when compared to the banking sector that we now know of. Implementation of and adherence to such requirements would also require significant amount of trained human capital and thus trained human capital would also form a pillar in the new financial architecture that is in the process of being developed.

The other major sector that probably has never got the attention due to it is the micro small and medium enterprises (MSME). It seems clear that these MSMEs are going to be the major drivers of growth in the future and hence the entire financial structure would have to give importance and prominence to the capital and fund requirements for such enterprises; this is particularly relevant given that the current share of the non–corporates in the Indian GDP is about 52% and is expected to grow in the coming years. The financial support needs to come from the formal banking sector as well as the non–formal sector represented by the non–banking financial companies (NBFCs). Interestingly NBFCs can also play a significant part in the financial inclusion of all citizens. In a sense, it is now clear that going forward, NBFCs will play an even larger role that it plays currently and such organisations will have to be given a place at the high table of finance on equal terms.

The other pillar of the new financial architecture will be the mutual fund industry. Globally it is already a very important player contributing around 36% of the global GDP. This number is only expected to increase with increased life expectancy and therefore an increase in the superannuated population leading to larger savings during the working life. On the contrary mutual funds contribute only about 7% to the Indian GDP; but as life expectancy increases, the retired population also increases, and thus the need for increased savings will become very important, and the mutual funds will be one of the prime vehicles of this investment going forward. The main driver that will lead to a successful increase in the increased investments in mutual funds will be improved and effective regulation of the capital markets, thereby increasing the confidence of the common investor in capital markets products and, as a consequence, the mutual funds.

The final pillar of this new financial architecture has to be information – information on all counts but in particular channelised towards risk management and risk mitigation. The same is being highlighted by all regulators – Basel guidelines by the Bank of International Settlements (BIS) is a classic case in point. The importance is also growing as better and more efficient analytics tools are available today for users and regulators alike to carry out detailed predictive analysis and hence try and pre-empt adverse market moves. Even if the success of pre-emptive market moves may be questioned, the ability of these data based strategies will give all the stakeholders of the financial system a better chance to have more efficient and robust risk management systems – not that they will be successful all the time but the success rate will definitely improve significantly from the current times and thus improve the efficiency of the entire financial sector.

In this context, the imperative for a new financial architecture in India is evident. The following panel discussion, brings forth some of the issues that would need to be identified, particularly in the Indian case, as the regulators and the policy makers in conjunction with market participants, go about building a new architecture.

India Emerging: New Financial Architecture – Panel Discussion[1]

Chair: R Vaidyanathan

Professor, Finance & Control, Indian Institute of Management Bangalore

Panellists:

T Keshav Kumar, Chief General Manager, Commercial Banking, State Bank of Mysore

Imtaiyazur Rahman, Chief Financial Officer, UTI Mutual Fund

Sriram Ramnarayan, Country Head, Financial Markets, Thomson Reuters

  1. S. Sundararajan, Group Director, Shriram Group.


 R Vaidyanathan

A new financial architecture is emerging in India. We are talking about 8-9% growth in the future. What are the challenges faced by the financial architects? What types of changes are required? To discuss these issues, we have experts from distinct areas — banking, mutual funds, non-bank finance, and risk management. We will have a short presentation from each of them pertaining to their domain, and then open up the discussion to the audience.

We have with us Keshav Kumar, Chief General Manager, State Bank of Mysore, from the area of Commercial Banking. He has been with State Bank of India (SBI) Project Finance, Mumbai, and was DGM Credit, at State Bank of Travancore, Kozhikode.

We have with us G. S. Sundararajan, Group Director of Shriram Group, the largest non-banking finance group in the country. He is the MD of Shriram Capital, the holding company of the group. The company is in the insurance business and financial services, both in India and abroad. As a group director, he is in-charge of subsidiaries, providing oversight in critical areas, primarily in strategic growth opportunities for the country.

We have with us Imtaiyazur Rahman, Chief Financial Officer, UTI. He also supports the global operation of the company and the private equity division of UTI. He has 27 years of experience in management and business leadership. He has been with UTI since 1988. He has served on the board of Invest India Micro Pension, collective investment as well as pension.

The final panellist is Sriram Ramnarayan, Financial Risk Division, Country Head, Thomson Reuters. He has been working in the finance sector for 18 years. Currently, he is the Mumbai Location Head at Thomson Reuters.

 I invite Mr Keshav Kumar to speak first.

Keshav Kumar: Banks and the new financial architecture

The financial sector in India consists of commercial banks — private and public sector, foreign banks, all India financial institutions, and the non-banking finance companies (NBFCs). I will focus on banking and the changes required, the issues to be resolved in the formulation of the new financial architecture.

Banking has undergone a huge amount of change with the regulator playing his role in guiding the banks on the concepts of BASEL-1, 2 and 3, particularly on the need to maintain higher capital. Capital is an important element in strengthening the foundation of the bank and in building a healthy banking system.  We need to ensure that we have enough capital to meet eventualities. This is an area that is going to be of greater prominence in the banking system. We cannot give loans just because there is an appetite for loans; we need to link loans to the capital that is available. Given that public sector banks are managed by the government with more than 51% shareholding, the ability to raise money is one of the main challenges. The government in its own way is trying to bring down the holding levels but this will take time. One of the structural changes that has to be made is for the government to move out, and retain only a controlling interest, leaving the professionals to run the show.

The next issue is streamlining the procedures and upgrading technology in banking. A lot of things have changed in Indian banking. When we got into the banking system in 1984, we had manual systems. As one among those who have gone through the process, I definitely know that we have come a long way. People with no experience in handling computers, who are retiring soon, have been managing systems successfully. The major issue that banks face today, which will impact their efficiency going forward, is that of human resources. Banks, at one point of time were able to attract the best of talent. It was the prime area where employment was being generated. Joining the bank as a probationary officer was not considered any less than joining the Indian Administrative Service. The salary structure was also similar at that point of time. But today, after the IT boom, the best of talent has not come to banks. This is the sector that is going to be very important for the economy. There has to be a distinct look at what needs to be done to attract the best of talent to banking, especially to the public sector. This is the most important part of the whole financial architecture that we are talking about. The challenge will come to a head in the next couple of years when the seniors in the bank retire – all those who joined in the late 70s and early 80s – and there will be a distinct gap in the middle and senior management levels. The seniors will be replaced by officers who have not had that experience. We have to take this challenge seriously and address it if we want banks to be the backbone of the industry and the economy.

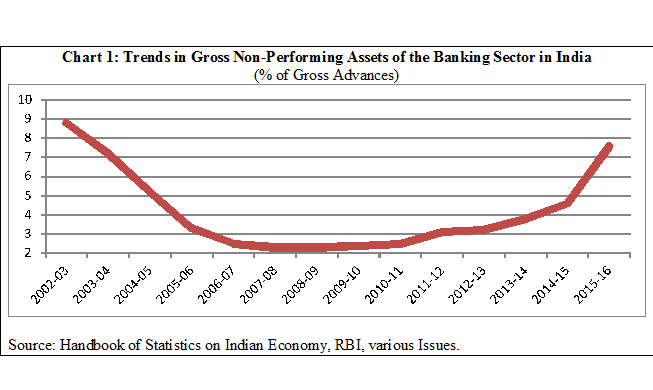
Coming to funding, we are talking about universal banking today, which has its own benefits and disbenefits. We started commercial banking from the short-term lending perspective of the industry and the all-India financial institutions took over the long-term funding of the industry. This created its own problems. Financial institutions did not possess the resources for asset liability management (ALM); they do not have the assets to match their liabilities. Banks moved into term lending and intra-lending. This has caused a major issue as the ALMs do not match. Our liabilities are of short duration whereas the assets needed to carry projects such as airport projects or port projects which are of10-15 year duration or longer, are different. Today, non-performing assets in the banking industry are causing issues. The prime reason for this is that we have not looked at economic length of the project or what the project requires but at a random number of 10-15 features based on ALMs.

We must have the ability to draw from long-term resources. In all other economies, these activities are funded by groups such as pension funds, Public Provident Fund (PPF), and so on through which more long-term funding is available but in our country there are several investment and regulation issues. Insurance companies only invest in AA or AAA rated companies. So when projects come up, they are unable to attract long-term funds and that is why they come to banks. When they come to banks, based on their ALMs, we give them loans for 10-15 years which impacts our profits. This is because such decisions are based on assumptions. A road project is assessed on what the traffic is going to be. These assumptions need not necessarily turn out to be true. You need a mechanism where we can viably assess such projects and change our goal posts. For that, you need ALMs on tenor-wise basis.

Going forward we need to have banks for varied interests and varied causes. A start has been made by the Reserve Bank of India (RBI) with payment banks. A lot of disintermediation is happening and this is a great challenge. There was a time when banks were involved in various activities, now they find that they have to do clear credit activity. You need to see if income comes from non-interest income. In the past banks used to float funds. Today that option is not available in the banking sector. Going forward, we are going to have a layered structure where we will have specific activities given to different banks.

Next, we come to capital constraints and governmental compliance and regulatory compliance that banks have to meet. This is not a level playing field. Public sector banks have crucial social obligations. Public sector banks need to meet their social obligations, and at the same time focus on profitability as they are also accountable for their performance. The banks have to divert 40% of their lending to the priority sector. These are all social objectives. Unless there is a level playing field, you will not be able to judge which banks are doing better.

Information technology (IT) is already a challenge and given the stage that banks have reached, we are confident that the best of IT would come into this sector and we would be able to match the expectation of the customer. When it comes to IT, the objective of the bank will be to take its cues from the public depending upon their requirements.

Banking is in the cusp of change. It is a change which should happen and will happen. Going forward, we will witness various sets of banking improvements. The banking structure needs to be stronger so that it actually becomes the basis on which the economy works.

R Vaidyanathan

Thank you Mr. Kumar for initiating the discussion. Mr Kumar has identified the issue of capital adequately. He has also identified the huge gap that many banks face in terms of their age profile. Quite a number of people are going to retire because in the 1980s in the public sector banks, there was a slackening in the intake. This is a demographic problem in a number of banks. They have a junior level and then there is a huge gap. It is a huge challenge in public sector banks. Banks could leverage IT and overcome the circumstances.

The relation between the government and banks is an age-old issue in India. The government pressure on banks to meet the public obligations and priority sector is phenomenal. All the banks face this.

We will now have perspectives from the non-banking sector which occupies a very large space in the Indian context. I request Mr Sundararajan to highlight some of the issues in that space.

  1. S. Sundararajan: Challenges faced by non-banking finance companies (NBFCs) in India

I am going to focus largely on the Micro, Small, and Medium Enterprises (MSMEs) space, the role that non-banking finance companies (NBFCs) play and how they are or are not facilitated within the regulatory framework; also, what needs to be done in the new financial architecture to ensure that the NBFCs are supported to give credit to MSMEs in a big way, which alone will ensure that we have a sustained GDP growth of 8% or above.

Medium enterprises have a reasonable amount of credit which comes in from the banking sector. Micro and small enterprises are largely unorganised, but they do not like to be called so; they call themselves self-organised. Many of them are not registered. They receive credit from local cooperatives which are often private co-operatives. Some NBFCs have taken the risk over the years to lend to micro and small enterprises, and see that they grow, which has had a multiplier effect in terms of positively developing the community around them. In terms of financing, every bank says it lends to MSMEs. One would think that MSMEs are the most “overbanked” sector, but they are actually the most under-served. The MSMEs rarely get the credit they need for their growth from banks. So MSMEs are largely served by the NBFCs.

 Financial inclusion is a term that has been heard for the last few years, but much more today than before. It is something that some NBFCs have been doing very significantly and they have been niche players in transport finance, equipment finance, small business finance and so on.

The primary challenge faced by the regulators with regard to NBFCs is that that today, of the 12,000 or so NBFCs which are registered with the RBI, only about 20-25 of them account for about 70% of the lending in the marketplace. Many of the other players are either inactive or do small business in their local area. The regulator has a lot more focus when it comes to regulating banks (public deposits are a big concern for regulators and they have to protect the depositors), and NBFCs have been regulated with a very light touch for the first 15-20 years. However, over the last 7-8 years, the regulator has looked at NBFCs with more focussed attention.

The thought process now seems that as in the global environment, NBFCs and banks should have a level playing field. Therefore, NBFCs should be regulated just as banks. Some regulations have come about over the last few years, especially in the last one and half years which I believe are going to have an adverse impact on how NBFCs lend to micro and small enterprises. Perhaps this is why in the last budget announcement, there was a separate committee set up to examine the financial architecture of the MSME sector under K V Kamath[2].

The issue here is that if NFBCs are regulated the way banks are, be it in terms of capital adequacy norms or provisioning norms or anything that affects the advances made by NBFCs, then NBFCs will also target the same customers as banks. Today if there is any financial inclusion happening (when I say financial inclusion I am not focussing on savings bank accounts or insurance, I am focussing primarily on the amount of credit available from the organised institutions to the sector which is deprived of credit) it is through the NBFCs.  There is a lot of mutual exclusivity between the target markets serviced by banks and by NBFCs. Further, there is a significantly higher level of risk which is being taken by the NBFCs because they have light touch regulations and they are allowed to take this risk. On the other hand, banks depend a lot on public deposits for their funding, so the RBI regulates banks more closely. Today, banking is a low risk-low reward business. While there may be no bank which has more than 12% return on equity (ROE), banks have a premium in terms of their valuations, they have a lot of investor interest and the overhang of RBI control and regulations is seen as a safe bet in the financial services space.

In the case of NBFCs, because of the light regulations and some errant players who have misbehaved in the market place, the RBI has decided to regulate all the NBFCs in the format of the “lowest common denominator”. They have decided to regulate the entire NBFC sector in the light of the few failures and with a view to preventing further failures, which has made life much more difficult for these 20-25 NBFCs who are the only ones catering to micro and small enterprises. According to the committees advising the finance ministry, unless we have a separate architecture created for small business financing, financial inclusion will continue to remain a dream; and even the few finance companies which are doing good business will cease to exist. Even if banks start understanding these customer segments, and try to serve them in an effective way, it will take another 15-20 years for them to be effective. Till then, we need NBFCs to flourish continuously and grow. There is a lot of appreciation for the role played by NBFCs from the finance ministry. We are confident that there will be significant changes and some amount of facilitation will happen which will enable NBFCs to continue the process of growing and giving more credit to the micro industries.

To give you a brief background on the character of MSMEs, though they are clubbed in one department and under one acronym, there is a lot of difference in terms of their characteristics. Medium enterprises typically have beyond INR 20-25 crores of turnover. They typically need multiple bank products and they have grown in different sectors of the Indian economy. Their risk is perceived to be relatively lower than the micro and small industries. They are registered companies, some of them are even limited companies. Therefore there is a lot of transparency and their financial documents are available because of which banks have a certain comfort level with them. None of this exists with most of the micro and small enterprises. At the same time, most micro and small enterprises at the lower end do not need any product other than term loans; they have enough collateral available which they are willing to give against loans. Today, when they take loans from NBFCs or local money lenders, their interest rates are much higher. The interest rates are more because there are very few players in this segment and the supply is much lower than the demand. Also there is a perceived high risk on the part of RBI and other players who are in this space. Therefore, there is a higher return which is seen and made available to NBFCs.

The objective of the new architecture for small business finance is to ensure that more and more players come into the open. If more entrepreneurs come into the MSME space the ultimate pricing for these customers will come down, and there will be more inclination to borrow from NBFCs, and therefore there is huge growth opportunity and potential which will be realised as we go along. It is extremely critical and imperative for NBFCs to grow and we hope the new architecture will facilitate this. In the last few years we have seen a lot of regulations coming in, but this has not stopped the NBFC sector from growing. NBFCs have been fighting for survival all along and they know the art of surviving in the most adverse conditions. The new financial architecture is critical to enable NBFCs to play an even more significant role in financial inclusion in the country.

  1. Vaidyanathan

Thank you Mr Sundararajan for an excellent exposition on the issues faced by NBFCs. Though little recognised, NBFCs play a very large role in our economy. This segment includes money lenders and the bigger companies. Of the 58 million small enterprises in the country, most of them are non-corporate. But in a district survey, I found that most of management research is only concerned with corporates. In terms of value addition, the non-corporates constitute around 50% of the GDP, while corporates constitute only 12-13%, but we are all enthusiastic about corporates. NBFCs perform a phenomenally good role in terms of reaching the last man. The usual complaint is that they charge a very high rate of interest but funds are otherwise not available to the average person. It is not so much a rate of interest issue but a question of availability and with the least amount of paper work. Much of these transactions are based on relationship and trust.

There is a general opinion that gold is most unproductive. We do not realise that gold is the single largest collateral in the country today for small businesses. I have a flower vendor near my house. There are times when she wears bangles and times when she doesn’t. When she doesn’t have bangles, the business is down. She would have mortgaged the bangles for working capital. When the business is doing well, the bangles come back. So, gold is not an idle asset. It is one of the largest collateralised items in this country, and that is why gold will occupy an important place. We hope the new financial architecture will factor that in.

We now have Mr Rahman from UTI. He will talk about mutual fund investments and their issues.

Imtaiyazur Rahman: Mutual funds — issues and developments

We will take a few minutes to look at the global perspective of mutual funds and then deal with the Indian mutual fund. So far as global asset managers are concerned, it is a very rich sector. Global asset managers manage the total assets (TA); they manage the traditional mutual funds and also manage the alternative assets, globally.

According to a study, global assets under management (AUM) was $67 trillion (TD) last year. In 2020, it will reach 100 TD. What are the segments that are going to contribute to it? The traditional mutual fund in 2012 was around 65 TD. In 2020 it will go up by 40 TD. The mandated assets in 2012 was 31 TD and that will go up to 47 TD in 2020. Alternatively, private equity was 7 TD; in 2020, it will be 13 TD. There are four broad factors which will drive AUM. In most of the Western countries, there is an ageing population. So they will save more towards retirement benefits. There will be serious shift in the culture of investment in the emerging countries. The culture of saving will move towards investment. High net worth individuals (HNI) will accumulate more wealth by way of ESOPs, creating more organisations, and new entrepreneurs. Financial literacy is going up in a big way and all these factors will lead to 100 TD assets. These assets will help the industry and economy to grow, and to meet growing capital requirements.

It is important for us to see the Indian mutual fund industry in three different perspectives.  In 1963-64, the Government of India (GoI) started the Unit Trust of India (UTI), which dominated the scene until 1987. In 1987, GoI decided to open up this sector and it was available to public sector undertakings. Many public sector banks like Canara Bank and SBI started their own mutual funds. Before 1987, UTI had Rs 4700 crores of AUM. When the sector opened up in 1987, the AUM rose to Rs 47,000 crore. In 1993, when this sector opened completely to the entire public sector, AUM has grown from 47,000 crore to over Rs. 10 lakh crores. But, here we have to introspect. What is the contribution of MF? The allocation of household savings to MF is 3%. Mutual fund in India contributes only 7% of the GDP while global MF contributes 36% of the GDP.

Where does the money go? Bank deposits account for 56% and this trend continues. The allocation to MF is far less. We need to introspect on this growth. Compare 2009 and 2014. In 2009, the investment of corporate holdings in MF was 51%, HNI had 22%, and retail had 21%. This has shifted. In 2014 corporates hold 50% in MF, HNI has gone up from 22 to 27% and retail continues to be at 21%.

There are three important matrices we need to look at. First of all, the investor-mix. There is a lot of concentration as far as the corporate sector is concerned. Other statistics show that there is a large concentration as far as cities are concerned. The top five cities of the country contribute 74% of the ADR and Bangalore is one of them. Next top 10 cities contribute 14%, 88% contribution comes from top 15 cities. Only 12% of the money comes from beyond the top 15 cities. So, we are seeing high concentration in cities as well as the corporate sector. Coming to the third matrix, income funds constitute 56% of the ADR, liquid funds 13%, and equity funds 21% of ADR. This is the latest trend.

By 2020-25, MF will have 10% share in household savings. If this is the goal, what are the things we need to do? Basically, there are four drivers in this industry; one is Product and the other is Customer. There are two types of customers: distributor as a customer and the industry as a customer. The other drivers are Operations and Regulations. If we need to achieve our investment goal, there needs to be a serious shift in the minds of the people from savings to investment.

 As asset managers of MF, we need to play the right role, i.e., we need to come out with the right product. If we look at today’s market, it is really crowded. All of us come out with the same product. Equity funds – large cap – there are 40 large caps in the market. And there is no great differentiation. So we need to launch a product that is relevant, we need to price it well and position it well. Coming to the investor mix, there is high concentration geographically as well as in terms of the participants. We need to diversify quickly.

In the last 7-8 years, there has been a huge amount of investment by the MF industry, including the regulators, in investor education. But it is very fragmented. So we as an industry need to work very hard and ensure that new investors are inducted. The number of folios for investors is only 4 crores. It has not grown. We can see some growth in equity fund only in this financial year. But again if you look at the flow, it is worrisome; Rs 95,000 crore has come in the last 8 months and Rs 55,000 has gone. This is a trend.

The MF industry needs to change its landscape and from mid-MF player, it should become the asset manager. While managing assets, the MF industry players also need to manage the pension fund, insurance and the money in alternative spheres. Only then can we achieve the goal of 10% MF share in household savings.

The next important piece is distribution. The MF industry is heavily dependent upon distribution. We have five different channel partners. Banks have the largest dominance in the top tier cities; independent financial advisors (IFAs) are found across the country; we have national distributors and regional distributors. Apart from the three parties – investors, distributors, and asset managers, there is also the regulator. And in the distribution space their interests are not aligned. The regulator is saying you can’t pay so much of commission. The worry for the small MF player is that the large players have deep pockets and will pay more commission and will take away the entire space. The large player says X has large number of equity elements, we have smaller number of equity elements, so we must buy.

Periodically, there used to be a huge problem in this space. UTI had over 150,000 IFA distributors. Then, there came a regulation that they had to be American National Standards Institute (ANSI)-certified. The number got reduced substantively. Now, there are 60,000 IFAs, and out of them only 5,000 are active. This is worrisome. What we need to do is make sure a new generation of IFAs comes in and they are paid well.

The last important piece in the MF industry is the regulator involvement. This industry is highly regulated. We are required to produce several documents. But there is some welcome development from the regulator side as well.  The regulator came out with the provision that the paid up net worth of asset management needs to be Rs 50 crore. The regulator wanted to send out a message that only serious players will be encouraged here. They increased the capital adequacy requirements from Rs 10 crore to Rs 20 crores. They wanted the asset managers to put their skin into the system and therefore we at UTI are required to invest in all open-ended schemes equivalent to 1% of AUM or Rs 50 Lakhs, whichever is less. This is really welcome. But many of the incentives are non-tax.  If this industry has to grow, we need to get a lot of tax benefits from the Government of India. There has to be necessary provision in the law that MF should be given this benefit.

In conclusion, I would say MF needs to be permitted to become the asset manager for insurance and pension funds. Mutual fund needs to have a large distribution base and the number of regulations needs to be reduced. In this entire space, digital strategy is crucial, and is going to be a big game changer. The better the digital strategy, the lower the cost, and the better the efficiency. With more digitisation and IT initiative, we will be able to serve the customer better.

  1. Vaidyanathan

Thank you Mr. Rahman for highlighting the achievements as well as the travails of the MF industry – 10% of the financial savings going into the MF industry will be a very positive development. As of now, the bank is the most preferred destination for household savings not only in India but all over Asia because the capital market is not much trusted by the household saver. We also hope that the regulatory framework would be much more favourable. Perhaps the developmental role of the regulator should be stressed. The perception of the regulatory authority or regulation should change.

I would now like Mr Sriram to consolidate the whole issue based upon his experience, including the risk management perspective.

Sriram Ramnarayan: The risk management perspective

Going by the presentations of the earlier speakers, everyone is talking in terms of growth in the banking sector. None of us is complaining about regulations, as such. All the presentations spoke about how inevitable growth is and how can we ease the bottlenecks and enable mechanisms to grow faster.

To give an example from the treasury space, ten years ago I was in risk management. At that time, you used to be very happy in the banking and financial sector, if you had a treasury recapture and position keeping system in your books, mainly in forex which runs into billions and billions of dollars on a day-to-day basis. If you could electronically capture the deal, pass it onto mid office and to the back office electronically, untouched by human hand, you were stated to have implemented a risk management framework for your organisation. People would put it in their balance sheets, if you can recall, that they were proud to implement so and so risk management systems in the organisation. This was what risk management constituted 10 years ago.

Today, risk management has taken a completely different hue for the simple reason that most of the trading is done at such a fast pace, and it is governed by things completely beyond your control. If you are aware of the things that are behind that change and the change in trading mechanism, you must be lucky. Therefore, one of the prudent ways to look at the framework for risk management in order to facilitate all the businesses that you want to grow, is to try and put all the processes for known risks together. Unknown risks, you cannot combat. If someone says they have a comprehensive risk management framework or a complete risk operational system, that is a doubtful claim.

For example, if you look at the way equities are trading in most parts or the algo trading or machine trading mechanism that is happening now, 80-90% of the global trading is done by machine. Those machines have a vast amount of historical data built into them comprising simulation, analysis of last 15 years, data of a particular country, climate, political influence, and so on. People used to take a look at the news and past credit and make their decision. Today, the machine does that in a micro second or even a nano second. What do these machines do? They simply take all the historical data, look at all news on BBC or Reuters or Bloomberg that comes in electronic format, read that news, and relate that news to similar events that took place 5 or 10 years ago. They look at questions such as:  How has the market responded? What is the market sentiment, the reaction with respect to such a response? What will be the reaction once such news is out in the market? Which way will the market move? The machines provide a positive or a negative sentiment and then ask “Do you want to trade?” This is a question pertaining to trade in millions of dollars — yes or no? The order is executed in less than a micro second. Before we as human beings can see that news on the machine, the order is already executed between the two extremes.

You need to have good risk management processes in place in order to address those individual applications and markets. It is again a myth when people say they need to have a comprehensive risk management solution that takes care of everything and all the activities of a bank or a financial institution. Such a solution does not exist. If you look at the treasury risk management system, it is so different from the core banking system where the emphasis is on credit. Each bank knows exactly what credit model is best for it. An external credit rating agency can only do so much. The real estimate of the credit risk is done by the person who takes the decision. I have been saying this at various forums – the last man who takes the risks when he gives a loan knows what the probability is of the loan being returned.   Similarly, in infrastructure funding or the trading environment where the trader hits the buy button on the screen and says buy 5 million, he knows in his heart what exactly the impact of his actions could be on the organisation, and collectively five such people know what is the impact of such action is on the state of the economy, which will contribute to systemic change. The herd mentality of five people going in the same direction or going wrong contributes to a systemic risk.

Having said that, what is the new risk management principle? What are people now looking at? I spoke to a compliance officer of one of the big MNC banks recently who said that one of his big worries was how he did risk management. The organisation had all systems in place. The department heads in the organisation had to tick mark on a form that they had complied with all processes. But the compliance officer could not be sure because he was depending on someone else’s tick mark.  Therefore, people are now looking at various processes by which you can capture all the risk, the birth place of those risks and bring them all under one operational framework so that they could be in a position to see the risk. How much you act on that risk, how much you cover is entirely up to you. For example, if you go to the World-Check database[3] the UN gives a list of about 1000 people you should not trade with. If you go to a software company/service provider, they will give you 1,50,000 names you should not deal with. However, these are not blocked deals, they are cautions provided by the service provider. The risk culture is changing due to the very complex business environment. The man on the floor – the man at the end of the cycle where you disburse money in trade – that is where the risk culture has to come from and has to go all the way up to the board. This is the reason why in the New Companies Act, the responsibility is placed on the CFO and at the same time, you have the CRO and the internal auditor who is responsible and answerable to the board.

Having said that, who is most apprehensive about all these regulations? The board of directors. Now, the board of directors is telling us – please equip us to be aware of what is going on, as independent directors in the company. Is there awareness among them? Are the independent directors capable and do they have the time and wherewithal to read the reams of paper they receive and come back with recommendations and decisions points? Physically it is not possible. So, now the board is focussing on how to train the independent directors to have a bigger perspective, of being able to see what others cannot. That is what risk management is about.

 Compliance is another big question in people’s minds. Indian companies are investing all over the world. They are subject to so many compliance laws that the investment and returns expected by investors overseas and in India can be wiped out by one penalty fine. So, the dire need for people is to see, in one place, the compliance laws that they are supposed to adhere to. Even in India, different states have different labour laws, laws with respect to doing business, local taxes, octroi, and so on. The entire framework of risk, governance and compliance now has to take a unified shape and form which is addressed by systems, and by people, most importantly, by people with expertise. You cannot lose people who understand the business. You need people who understand and implement the processes and you need the risk culture to be propagated across the organisation.

 I would like to leave the audience with one thought.  We have several regulators — insurance regulators, financial regulators, forward market commissions, SEBI, RBI, and IRDA. Is there a need to have a wrapper of a regulator? Do you need a unified system in the country as a whole to ensure that the financial systemic exposure is better controlled? Do you need linking between regulators? Do you need a unified regulator who has overall view on at least certain basic principal parameters which then can then boil down to industry-level specifics? The question cannot be answered in a day but it is a thought process for all of us.

  1. Vaidyanathan

Thank you for bringing out this important issue of role of directors. The recent 2013 Companies Act is, in a sense, a draconian act; several independent directors are quitting directorships and companies are desperately in search of good directors.

 What the system has done in its enthusiasm is practically make the independent director more responsible for the affairs of the company than the executive director. They have made conditions very stringent; in a few years, many companies, particularly listed ones, will find it very difficult to get people.

We always have pendulum swings from one extreme to the other. That seems to be the Indian perspective. At one time the entire system was an outcry system, then it became 100% software system. No via media. There should be a re-look at it if you want capable people on the board who have to provide some amount of advice. The second important point concerns the time duration for decision making.  The time perspective should be commonly understood across the board.

We will now open up the discussion to the audience.

Discussion

Q: My question is to Mr Sriram. You mentioned that 80% of the global trading that occurs is electronic in nature. As part of the research at IIMB, we found that the space in India is limited to between 30% and 40%. How aggressive is that space going to be in the coming years?

Sriram Ramnarayan: In India, it is a different scenario in terms of the percentages. But we see that in India, it is growing up slowly, thanks to our regulators and in some manner, the machines. The most important requirement, other than getting the programme, the system or the risks and controls right, is availability of technological infrastructure to such a degree that you are able to rule out any glitches in order to execute your trade once you are sure about your machine tradable capability. I think electronic trading is coming and is unavoidable; but whether it is coming in a big way, and the speed of the change, is something that one needs to see; it is difficult to predict.

Imtaiyazur Rahman: To supplement what Sriram said, SEBI has now allowed direct market access. So, now most of the participants are going directly to the market instead of going through the broker. I think this is the beginning but going from 50% to 80% will not take much time; going from 40% to 50% may take some time. Once it crosses 50%, reaching 80% will not take much time.

Q: I want ask you a question on the human resource policy of public sector undertaking (PSU) banks. I recently conducted a 3-day programme on financial derivatives in the Staff Training College of a major PSU bank. Half the participants were in the age group of 58-60 years and they admitted that there was little incentive for them to learn complicated subjects at that stage.  At another such programme, there was a very bright young participant who was very good in treasury risk management and absorbed everything we conveyed. But a year later he was transferred to a rural branch of the bank and he had to sell agricultural loans to farmers when he has absolutely no talent for it. Why do banks have these kinds of policies?

Keshav Kumar: Coming to the age factor, as I said in my presentation, post 1987-88, the recruitment of officers was totally stopped in PSU banks. There were no new people brought in through the bank recruitments for 10 years. Post 2005-06, more recruitments are taking place and you will see younger faces sitting in the banks. This is an ongoing process.

I also mentioned in my presentation that structured and varied banking is coming in where different sets of banks are assigned different sets of practices. At present banks are doing all kinds of activities at the same time. We are told by government that we have to give priority loans, and so on. There is a major regulatory issue there. The regulations affect all aspects such as recruitment, credit and risk taking. There is a certain mindset that is part of the Indian ethos, especially in earlier times, and I am confident that it is changing and will change for the better.

Q: It is true that when some untoward incidents happen, the regulator starts tightening the belt. However, in the larger perspective of the protection of interests of the general public, how would you take care of such things if these types of regulations were not there? An example from the recent past of companies that have garnered huge amounts of money is the Sarada Group in West Bengal, and the Sahara Group. If you don’t bring in regulations, how will you ensure control?

  1. S. Sundararajan: Where you have people squandering public money, there should be action taken. However, unless it is systemic, you cannot have regulatory changes. If it is sporadic, you have to address it the way sporadic issues are addressed. For example, Sarada was just a corporate collecting deposits. They were not authorised to collect deposits. The moment they got caught, they were labelled as a chit fund company. They were not a chit fund company. If you are a chit fund company, you have to be registered with the chit fund registry.

Sporadic changes cannot have a regulatory undertone. When you apply the rule of the lowest common denominator, it will not facilitate people who are doing well to continue to grow well and contribute to the economy. That is something which needs a mindset change with the RBI and other regulators.

Q: This is regarding the volume of automatic trading in India. The SEBI regulations in the last few years are mainly about having an empanelled auditor and other aspects. What is the next thing? In Europe and in the US they are coming up with more regulations. Are the brokers providing the right platform for the customers? Do you see that coming in future in India?

Imtaiyazur Rahman: This is a real concern for me as a mutual fund asset manager. Let me give you an example. A few years ago UTI was trying to have a strategic alliance with another company. I met a couple of their broker dealers. Whenever they have to meet a client, they have all the records with them. They record each and every discussion including discussions of their clients’ expectations, their age groups, their net worth, what they want to do and how much they want to invest. There was a very open dialogue between investor and the broker-dealer. That is not there in our case. The lack of financial literacy is one of the primary reasons for this.

Mr Sundararajan mentioned the chit fund. I come from the state of Bihar, from a village.  Whenever I go to the village and speak about mutual fund, the only question I am asked is about the returns.  Chit fund offers them 16% returns. Mutual fund cannot offer any assured returns; therefore financial literacy is very important.

When IFAs, who would be selling the products of the top few asset management companies (AMC), interact with the people in the village, the only question the investor asks is where he has to put his signature. There needs to be serious shift about financial literacy. People need to take control of their own money. Unless that comes, it will be very difficult. No matter what regulations you put in place, we will not be in a position to avoid this. So, here, it is not really a bread and butter income for the IFA. They do it as a side income. My sense is unless we all grow, all four of us – bankers, insurance companies, NBFCs, IFAs, and educate the people enmasse, we will not be able to see real light of day.

Sriram Ramnarayan: The other side of the picture is the institutional trading. How much will you practice? How will the regulation work? It is a question of give and take. I do not think even locally in India, institutional players are eager and keen to increase themselves 10-fold because they are aware of the risks to themselves in the architecture that goes into the delivery of such a mechanism. So, as Mr. Rahman said, there will be growth, but the pace of growth will be dictated more by the market conditions and risk mitigation mechanisms rather than the regulators themselves.

  1. Vaidyanathan: Thank you all very much. We have had interesting perspectives from different dimensions of the financial market. I would like, individually, to thank Sriram, Rahman, Sundararajan and Kumar.

[1] The panel discussion was part of the 4th India Finance Conference 2014, December 17 – 19, 2014. This part of the article carries edited excerpts of the presentations made at the panel discussion. The views expressed by the panellists are personal and academic in nature and not necessarily the views of their organisations. The presentations of the panellists were made in an academic context in an academic institution. The data and statistics are as quoted by the panellists in their presentations.

[2] This committee has submitted its report in February 2015. http://msme.gov.in/WriteReadData/DocumentFile/2015_02_MSME_Committee_report_Feb_2015.pdf

[3]  a database  of Politically Exposed Persons (PEPs) and heightened risk individuals and organisations which is used around the world to help to identify and manage financial, regulatory and reputational risk.

Deleveraging Balance Sheet

Leverage in the balance sheet increases financial risks resulting in lower credit rating and higher cost of funds.  A healthy mix of debt and equity is key to debt sustainability. Too much debt increases the marginal cost of borrowing due to expected distress cost and also cost of equity via higher levered beta. Therefore, corporate finance theories suggest that there is limit to borrowing.  Traditionally corporate India borrowed from banks for both short term and long term requirements. Any corporate loan default adversely affects the balance sheet of a bank. Debt default is not always deliberate. Leverage has side benefits too: one, tax shield on borrowing and second, debt, it is said, disciplines management. The benefit of tax shield is immediate for those firms, which make operating profits. An all-equity company will not have any pressure of contractual obligations for timely interest payment and loan repayment. Replacing equity with debt (e.g., share repurchase) puts more pressure on the management to perform as the firm swaps promise (dividend) with obligation (interest). Highly indebted firms face difficulty in negotiating favourable terms with suppliers and even customers put pressure to squeeze extra credit period.

The Reserve Bank of India (RBI), while sympathetic to corporate defaults due to uncontrollable extraneous factors, has come very hard on wilful defaulters by threatening to ‘name and shame’ such borrowers.  RBI has, over the past two years, brought several schemes to help stressed borrowers to restructure their debt and at the same time allowed lending banks to change promoters of wilful defaulters.  Three companies in India together owed more than Rs. 3 lakh crores (US$46 billion) to banks at the end of March 2015. If one takes the top ten indebted companies in India, the figure goes up to Rs. 7.3 lakh crore (more than US$100 billion) for the same period. This alarming proportion of debt puts tremendous strain on the balance sheet of banks.

The main issue, therefore, is to explore how leverage affects a firm, a bank and ultimately a nation. Myers(1977)[1] demonstrated that the outstanding level of debt in a corporate balance sheet can alter the investment decisions of firms. Firms with higher debt will underinvest by not accepting many positive NPV (net present value) projects in pursuit of higher return, as those projects would not leave anything for the shareholders after paying for debt. Typically, bank debts are collateralised on the assets of firms and hence during recession when the market value of assets fall, such firms face structural bankruptcy in the balance sheet. Such apparent bankruptcy threats make firms more conservative with investment. In other words, during economic boom, rising firm income and asset prices boost borrowing and opposite happens during economic bust. This is known as procyclical feature of leverage. Debt overhang in a bank arises when the scale of debt relative to the value of assets distorts lending decisions. At a macro level, leverage is defined by the debt-to-GDP ratio. A nation with higher leverage would face restricted investments, which in turn may adversely affect potential output growth. Therefore, too much debt is bad for everybody and the recent recession in 2008 confirmed this hypothesis. Globally one can observe increasing trend in deleveraging balance sheet, particularly post-recession.

Effect of Deleveraging

Broadly, firms can reduce debt on the balance sheet in two ways- (a) raising equity  and (b) disposing assets. A famous example would be that of BP. After the Gulf oil spill, BP sold billions of dollars in assets and used that cash to pay hefty fines and shore up cash reserves. Deleveraging with equity infusion may be the best course of action for companies that have become over-levered and are flirting with financial distress. Merrill Lynch (now known as Bank of America Merrill Lynch) regularly conducts fund manager and CFO surveys.  In one of such surveys conducted in 2002 (much before the global financial crisis), majority (54%) of respondents said that they prefer repayment of debt as the best use of free cash and the consensus reached 62% in 2003. The same trend is observed post-crisis. In a recent survey on Asia in 2015, CFOs (51%) mentioned that deleveraging is the main motive for change in capital structure.

If debt is cut with fresh equity, the capital structure adjustment may reduce cost of capital. But it does not help in future growth of the company. More damaging is the case when assets are disposed to pay down debt (Table 1). This strategy reduces the overall balance sheet size and hence shrinks output. If majority of firms follow this practice, it would seriously affect economic growth of a country. Thus, deleveraging is good to reduce financial risk. But if higher leverage makes a firm risk averse, the firm would tend to use free cash to reduce debt rather than invest in positive NPV projects. Countries with higher debt-to-GDP ratio may also suffer from the same underinvestment problem.

Burden of financial debt typically leads to cut in capital expenditure and even disposal of assets to bring down debt. This strategy may help a firm in the short-run. However, if this practice is sustained for long it would lead to massive underinvestment hurting economic growth. Tendency to hoard cash would generate suboptimal returns leaving shareholders poorer. Data released for British firms in 2012 showed that, since mid- 2008, firms have cut more debt than they have raised equity.

Table 1: Impact of deleveraging

1

The hypothetical firm (Table 1) was highly levered in Stage 1 and had to significantly dispose of assets to reduce debt (Stage 2). This deleveraging was necessary to improve the financial health of the balance sheet and thereby corporate rating. But in the next stage (Stage 3), the firm gets conservative and starts hoarding cash.  Revenue earning assets of the company shrunk by more than 50%; leading to underinvestment problem. The excess cash is generally invested in government bonds, bank deposits or mutual funds, which earn suboptimal return. As firms stop investing, banks that get such corporate deposits also do not find borrowers. Banks again put this money mostly in government bonds. If the country already has higher debt-to-GDP ratio, it also does not invest. Thus the consequence of leverage cycle is lower future economic growth.  It is not good to have high leverage on the balance sheet. It is equally bad to hoard cash and underinvest.

This trend can be seen in Indian corporate sector. A report[1] shows that companies and banks in India are sitting on cash piles (Table 2). The four banks hold about Rs. 400,000 crores (USD 61 billion) in cash.  Thus, corporate deleveraging exercise is ultimately fuelling cash hoarding.

Table 2: Cash Holdings

Company Cash & Bank (% of Total Liabilities)
Rajesh Exports 150.51
GSK 110.90
MRPL 103.54
Novartis India   95.79
Bharat Electric   83.89
Bank of India   20.67
PNB   11.31
Canara Bank   10.54
SBI     7.98

Cash Hoarding

Hoarding cash has become a popular practice for corporate sector. Top ten US companies held more than $675 billion in cash by the end of 2015[2]. Cash-rich companies in India have decided to use the cash for share buyback rather than investing in new projects. This trend is seen globally too. The Merrill Lynch survey showed that approximately two-thirds or more of all U.S. companies say they intend to hold constant the percentage of free cash flow they allocate to share repurchases (77 percent), dividends (76 percent), research and development (67 percent), and acquisitions (66 percent).  The problem is that the cash so distributed by firms do not reveal itself in investment and employment. It rather shows up in savings. Firms with huge cash balance have negative debt and such a situation is not tax efficient.

Situation in India

Like other countries, India too had launched generous financial stimulus to help corporate sector fight recession. RBI reduced interest rates significantly to offset the increase in private sector risk premium and to underpin aggregate demand. In spite of these efforts credit remained tight-banks were hesitant to lend immediately after recession leading to weak aggregate demand. Table 3 shows leverage situation of three select cement companies in three different economic regime.

Table 3:  Leverage-Growth nexus[3]

Company Name Year Liquidity 5-year Sales CAGR Leverage Asset Build up
A C C LTD. 2005 1.81% 8.02% 35.44% 73.18%
A C C LTD. 2010 8.20% 18.25% 8.64% 41.91%
A C C LTD. 2015 9.56% 8.97% 5.92% 79.68%
AMBUJA CEMENTS LTD. 2005 3.40% 18.36% 37.24% 26.71%
AMBUJA CEMENTS LTD. 2010 15.87% 22.40% 6.37% 43.66%
AMBUJA CEMENTS LTD. 2015 20.04% 5.27% 5.55% 38.22%
ULTRATECH CEMENT LTD. 2005 1.55% NA 58.53% 20.40%
ULTRATECH CEMENT LTD. 2010 1.12% 20.38% 29.39% 17.44%
ULTRATECH CEMENT LTD. 2015 0.79% 27.49% 22.28% 62.89%


Note: Liquidity= Cash & cash equivalents (% Assets), Leverage = Long-term debt (% Assets) and Asset Build up= Capex (% operating cash)

Generally, companies have reduced leverage post global crisis. Such deleveraging exercise has somewhat adversely affected the top line growth of the companies. Companies were also careful in adding physical capacity. The cement industry had severely curtailed its spending immediately after 2008 economic crisis; reduced its debt and built up liquidity in 2010. In next five years, this sector has again witnessed investments in physical capacity. However, interestingly deleveraging continued.  This is mainly due to cyclicality of the industry with general economic growth. So favourable operating cash helped these firms to maintain growth with lower leverage. Indian firms seem to negate the global story that deleveraging also reduces capital expenditure. At least the top three cement companies seem to spend substantial part of operating cash for  growth and debt reduction.


[1] http://www.moneycontrol.com/stocks/marketinfo/cashbank/bse/index.html

[2] A recent Financial Times report states that US companies’ cash pile hit $1.7 trillion.

[3] Computations done by Mr. Bobbur Abhilash Chowdary, a fourth year FP (PhD) student at IIM Calcutta. Data source: Prowess

*************

FinTech and the Indian Banking Sector: Recent Trends

Tautologically, FinTech has two parts, finance and technology. Globally, FinTech is gaining momentum and causing significant disruption to the traditional value chain. In fact, as per the 2015 Global FinTech Report of the PwC, funding of FinTech start-ups more than doubled in 2015 reaching $12.2bn, up from $5.6bn in 2014. Interestingly, apart from affordable technological innovations, globally new regulations in the post-crisis world have played a key role in development and emergence of the FinTech firms. Illustratively, stricter capital requirements leading to reduced credit availability, tighter scrutiny of risky lending, and changes in the consumer market all could have provided an avenue for FinTech firms. In fact, globally the FinTech sector has been seen as a rise of the new shadow banks (Goldman Sachs, 2015).[1]

            Perhaps in line with these global trends, payment system and the Indian banking sector have also been in the media headlines in recent times. Unlike the disturbing trends in non-performing loans by Indian banks, the news on spread of FinTech has been creating the right waves. There are media reports that technology has been disrupting the financial sector in its various segments – from bank transfers, to payments, to loans. Thus, it has various diverse elements – from replacing men by machines in the banking sector to financial inclusion.  How much are of such expectations in nature of hype and how much of it are in tune with reality?

Trends in FinTech Investment

            Interestingly, two recent reports – one by KPMG and the other jointly by BCG & Google have created huge interest in FinTech. The KPMG Report[2] noted that FinTech investment in India increased significantly from USD 247 million in 2014 to more than USD 1.5 billion in 2015. Admittedly, various diverse initiatives of the Government and the RBI have played a key role in enkindling the interest in FinTech; these initiatives and sops include: the January 2016 Start-Up India initiative of the Government establishing a fund of USD 1.5 billion; Jan Dhan Yojana (adding over 240 million unbanked individuals into the banking sector as of September 2016) and various tax and surcharge relief.[3] In fact FinTech firms – the likes of Paytm to Billdesk – have all been attracting huge investments (Table 1).

Table 1 : Some Illustrations of large FinTech funding in India
Players Business category Investment Period Total Deal value

(USD Million)

Paytm M-Wallet/Gateway Feb 2015 890.0
Billdesk Payment Aggregator Mar 2016; 2012, 2006 157.5
Freecharge M-Wallet/Gateway Feb 2015; Sep, 2014 113.0
Mobikwik M-Wallet May 2016; Dec 2015; Apr 2015; 2013; Sep 2012 86.9
A leading Indian FinTech portal Marketplace for loans and insurance products Jul 2016; Jan 2014; Mar 2011 79.0
Policybazaar Insurance Apr 2015; May 2014; Apr 2013; Mar 2013; May 2011 69.6
Financial Software and Systems Financial Planning Oct, 2014 57.0
Source: KPMG (2016).


Shape of things to come

The BCG-Google report is very optimistic about the usage of FinTech in India and noted, “over the last five years, digital transactions have shown steady growth of 50 per cent Y-o-Y, followed by ATM transactions growing at 15 per cent”.[4] A few specific forecasts from the study on the Indian digital payments industry is worth mentioning:

  • India’s digital payments industry will grow to $500 billion by 2020;
  • It will account for 15 per cent of the country’s GDP;
  • More than 50 per cent of India’s internet users will use digital payments by 2020;
  • the top 100 million users will drive 70 per cent of the gross merchandise value (GMV) for these payments; and
  • India’s non-cash contribution (such as, cheques, demand drafts, net-banking, credit/debit cards, mobile wallets and unified payments interface) in the consumer payments segment will double to 40 per cent by the year 2020.


Hype or Reality?

            How much of this trend is hype? Divergent views exist. While industry bodies are normally very euphoric about the shape of the things to come in the FinTech sector, a look at the broad payment system indicators from the recently released RBI Annual Report of 2015-16  is instructive (Table 2).

Table 2: Payment System Indicators – Annual Turnover
Item Volume (million) Value ( Rs. billion)
2013-14 2014-15 2015-16 2013-14 2014-15 2015-16
I. Systemically Important Financial

     Market infrastructures (SIFMIs)

83.7 95.7 101.4 1,355,822 1,426,488 1,545,672
(2.3) (2.0) (1.4) (90.4) (90.2) (89.7)
        1. RTGS 81.1 92.8 98.3 734,252 754,032 824,578
        2. CBLO 0.2 0.2 0.2 175,262 167,646 178,335
        3. Government Securities Clearing 0.9 1.0 1.0 161,848 179,372 183,502
        4. Forex Clearing 1.5 1.8 1.9 284,460 325,438 359,257
II. Retail Payments (A + B+C) 3,627.4 4,620.9 6,945.2 143,748 154,129 177,752
(97.7) (98.0) (98.6) (9.6) (9.8) (10.3)
    A. Total Paper Clearing (5+6+7) 1,257.3 1,195.8 1,096.4 93,316 85,439 81,861
         5. CTS 591.4 964.9 958.4 44,691 66,770 69,889
         6. MICR Clearing 440.1 22.4 0.0 30,943 1,850 0
         7. Non-MICR Clearing 225.9 208.5 138.0 17,682 16,819 11,972
   B .  Retail Electronic Clearing

         (8+9+10+11+12)

1,108.3 1,687.4 3,141.6 47,856 65,366 91,408
        8. ECS Debit 192.9 226.0 224.8 1,268 1,740 1,652
        9. ECS Credit 152.5 115.3 39.0 2,492 2,019 1,059
      10. NEFT 661.0 927.6 1,252.9 43,786 59,804 83,273
      11. Immediate Payment Service 15.4 78.4 220.8 96 582 1,622
      12. National Automated Clearing

House

86.5 340.2 1,404.1 215 1,221 3,802
C. Total Card Payments (13+14+15) 1,261.8 1,737.7 2,707.2 2,575 3,325 4,484
       13. Credit Cards 509.1 615.1 785.7 1,540 1,899 2,407
       14. Debit Cards 619.1 808.1 1,173.5 955 1,213 1,589
       15. Prepaid Payment Instruments 133.6 314.5 748.0 81 212 488
Grand Total (1 to 15) 3,711.1 4,716.6 7,046.6 1,499,570 1,580,617 1,723,425
Notes:

1.        Figures in brackets are percentage to total..

2.        Real time gross settlement (RTGS) system includes customer and inter-bank transactions only.

3.        Settlement of collateralised borrowing and lending obligation (CBLO), government securities clearing and forex transactions are through the Clearing Corporation of India Ltd. (CCIL).

4.        Consequent to total cheque volume migrating to the cheque truncation system (CTS), there is no magnetic ink character recognition (MICR) cheque processing centre (CPC) location in the country as of now.

5.        The figures for cards are for transactions at point of sale (POS) terminals only.

6.         The National Automated Clearing House (NACH) system was started by the National Payments Corporation of India (NPCI) on December 29, 2012, to facilitate inter-bank, high volume, electronic transactions which are repetitive and periodic in nature

7.        ECS: Electronic clearing service; NEFT: National electronic funds transfer

8.        Figures in the columns might not add up to the total due to rounding off.


Source: Annual Report, RBI, 2015-16.

            A look at Table 2 confirms one basic trend – while in volume terms, the lion’s share of the transaction are dominated by retail payments (around 98 per cent), in volume terms these small transactions account for only around 10 per cent of total transactions. In other words, payments system indicators are dominated by what is called “Systemically Important Financial Market infrastructures” (SIFMIs) or the bulky transactions. In fact, more than half of such SIFMIs are accounted for by transactions in the RTGS segment.

            It needs to be noted that these bulky transactions are already in electronic forms. So, the FinTech firms are perhaps looking for exploiting the retail sector, which is quite small in value term as of now. Admittedly, there are two ways of reading such existing numbers – the smallness of the retail segment could be indicative of the huge potential of the FinTech sector or this could connote the hype about the sector. Only the future can tell whether the glass is half-empty or three-fourth full.

            Many of the emerging market economies are now at the forefront of alternative payments system. Assets of M-Pesa, first launched in Kenya in 2007 by Safaricom, at US$24 billion is now equivalent to half of Kenyan GDP. In China, nearly one-in-ten of all payments are now made using Alipay – an online multipurpose banking service provider combining payment, lending, deposit and other functions. With the establishment of payments banks in India and the exuberance in the FinTech sector, in the days to come, it remains to be seen whether India follows this path of Kenya or China and the hegemony of banks are put to test.

*******

[1] Golaman Sachs (2015): The Future of Finance: The Rise of the New Shadow Banks.

[2] KPMG (2016): Fintech in India: A global growth story (Joint publication by KPMG in India and NASSCOM 10,000 Startups), available at https://assets.kpmg.com/content/dam/kpmg/pdf/2016/06/FinTech-new.pdf

[3] The major ones are: tax rebates for merchants accepting more than 50 per cent of their transactions digitally; 80 per cent rebates on the patent costs for start-ups. income tax exemption for start-ups for first three years; exemption on capital gains tax for investments in unlisted companies for longer than 24 months (from 36 months needed earlier).

[4] BCG and Google (2016): Digital Payments: 2020, available at http://image-src.bcg.com/BCG_COM/BCG-Google%20Digital%20Payments%202020-July%202016_tcm21-39245.pdf

Nominal GDP is no less important

The more widespread practise is to focus on ‘real GDP’ or inflation adjusted GDP growth. The benefits of this is well documented and widely understood. Economic activity, when not adjusted for inflation, leads to measures such as Nominal GDP (or GDP at current prices). In any economy with high inflation or gradually accelerating inflation, focussing on nominal GDP growth does not reflect the damage to the economy. However, in economics there are no absolutes.

There are economic scenarios where the focus on Nominal GDP is as important as Real GDP. This scenario is specifically one where the Inflation is slowing down sharply or dis-inflation has set in to such an extent that the year-on-year inflation measure is negative. In such a situation which nearly happened in India a few quarters back, the Real GDP growth ( and also applicable for Real GVA growth)  was higher than the nominal GDP(and GVA) growth.

In fact real GDP showed an improvement while nominal GDP showed a deceleration. The stated recovery in real economy was not being experienced in other measures such as corporate earnings, wage growth, credit growth and reduction in NPA of banks.

Abuse of GDP in Economic and Financial Analysis: In pre-2010 period it was not difficult to come across claims in Indian banking sector that if (real) GDP growth is 8%, the Banking sector assets would grow by 2.5 to 3 times. This almost became a common ‘wisdom’ or a rule of thumb. However, such wisdom is not holding good currently since, the real GDP is growing at around 7.5% while the banking sector asset (credit) growth is just 9% to 10%. Anyone with a basic understanding of ‘dimensionality’ would take it as no surprise. Banking sector credit growth is ‘nominal’ in a sense it is not adjusted for inflation. Any attempt to find a correlation between a nominal value (banking sector credit growth in this case which is not adjusted for inflation) and a real value (GDP in this case which is adjusted for inflation) is unsound mathematics and bad economics.

Banking credit growth in India typically has a 1.1X to 1.5X multiplier with respect to nominal GDP growth. Given that the recent nominal GDP growth has been 8% or below, a 9%-10% banking sector credit growth is in line with historical observation.

However, the malady of comparing a real GDP growth to nominal measures is quite widespread and extends to things such as regressing corporate earnings growth (again a nominal measure) against real GDP growth. The lack of usage of nominal GDP even when it is required is very intriguing. Is it because most analysts (and their economist units) have forecast of real GDP growth but no publicly or consensus view on nominal GDP growth? This is surprising.

Specifically, the surprise arises from the observation that for estimating real GDP, the nominal GDP needs to be estimated beforehand.  At least the government agencies which calculate GDP tends to follow this approach.

Real GDP Estimate Unlikely without Nominal estimate: The steps of estimating GDP are as follows. Firstly, the nominal GDP in INR terms of various sectors are estimated.  Nominal GDP estimation uses the existing and current price of various products and services as of the period of calculation. The prices for significant number of the components of the GDP are directly observable and to an extent is experienced by the people.

Subsequently, for each of these sectors a suitable deflator is used to adjust for the impact of inflation affecting that sector. This gives the real absolute GDP component for that sector. Then the real (inflation adjusted) GDP components are added to get the real GDP of the overall economy.

If the estimate of real GDP growth are done systematically and rigorously, then the forecaster would first come up with the nominal GDP growth estimates. However nominal GDP estimates are rarely, if ever, published. For some reason only the real GDP growth rate is shared by most economic forecasters.

However if the forecaster assumes that the inflation rate remains constant over previous year then one may model the real GDP directly from previous years’ real GDP. The implicit assumption being made in this approach is that the GDP deflator remains unchanged from year to year. However, in years when inflation is rapidly falling or rising this quick fix approach of calculating real GDP will provide estimates which are wide off the mark.

Assumption of Money Neutrality and superiority of ‘real’ measures: A relook at the practise of focussing entirely on ‘real’ measures is clearly required for other reasons as well. It comes from the theoretical premise that money is neutral. Joseph Schumpeter, in History of Economic Analysis explained the concept of neutrality of money succinctly. To quote “Real Analysis proceeds from the principle that all essential phenomena of economic life are capable of being described in terms of goods and services…Money enters the picture only in the modest role of a technical device that has been adopted in order to facilitate transactions…so long as it functions normally, it does not affect the economic process which behaves in the same way as it would in a barter economy: This essentially what the concept of neutral money implies”.

It is important to note Schumpeter’s definition which assumes that the money is functioning normally. But money may not be as neutral as classical economists claim. American economist Hyman Minsky argued, “in a capitalist economy resource allocation and price determination are integrated with the financing of outputs, positions in capital assets, and the validating of liabilities. This means that nominal values (money prices) matter: money is not neutral”.

Classical economists propounded the theory that ‘money’ is a representation of value. As per classical economists, money was considered to be a contrivance which facilitated economic transactions / exchanges in the real economy but itself did not impact the elements of ‘real’ economy such as land, labour and the process of production. In effect it highlights the neutrality of money of the real economic process.

Here it may be mentioned that that the way Minsky defined ‘capitalist’ draws on the way Karl Marx defined ‘capital-ism’. As per Marx, in the capitalist system money/financing is required before the production. Money does not appear mysteriously after production just to make the exchange of the product more convenient. This need for capital before production is one of the features of a system which may be tagged as ‘capital-ist’. One may agree that this is the case in India as well.

Monetarists and the Focus on Real GDP: The world is currently leaning on policies which may be defined as “Monetarist”. The Monetarists, among other thing, have a faith that lowering interest rate or increasing the supply of money(or its alter ego-credit) would increase economic activity. Recall near zero interest rate ( and of course negative interest rates) are adopted in some countries with the expectation of reviving their economic activity.

To be fair, monetarists view money to be neutral only in the long term. So one may expect some of the monetarists to be interested in the nominal GDP.

However this brings us to an interesting question. Most economic analysts tracking Indian economy tend to subscribe to the monetarist view. The author conjectures this since a lot of them create eloquent and verbally pleasing arguments of how interest rate reduction may improve Indian economic growth. However where they deviate from true-blue monetarists is that while analysing/predicting economic activity either of next quarter or next year (technically short-term) they use only real GDP growth. Hardly if ever one would find forecasters predicting the nominal GDP growth rate, forget expected value of nominal GDP in INR terms.

Equity Restructuring: Analysing a new guideline

The principal objective of equity restructuring is to provide adequate returns to shareholders and improve investors’ confidence.  Equity restructuring is also used as a strategic tool to minimise cost of capital, write-off losses and perhaps increase liquidity of stocks. Writing off losses or writing down assets against equity is a well-practiced strategy. What has assumed more significance recently is the use of free cash by a profit-making firm. Free cash is the cash left with a firm after meeting profitable investments requirements. It is the responsibility of the managers to ensure that such free cash is not unproductively used. A natural choice could be distribution of such free cash to the shareholders by way of dividend or share buyback. For example, the free cash flow per share of Apple has grown from USD 2.6 in 2010 to USD 12.6 in 2015. This is after significant share repurchase- the number of shares outstanding has dropped by 13% over the past five years for Apple. Apple has cash and marketable securities worth USD 233 billion out of total assets of around USD 300 billion in March 2016.  Obviously there will be clamour for further distribution of free cash to the shareholders. In India, TCS reported a free cash flow per share of INR 95.7 in March 2016 up from INR 26.4 in 2010. This is after paying INR 26000 crore as dividend in the past two years. TCS got its shares listed in 2004 and has never repurchased its shares. TCS shareholders may soon demand even higher dividend payments. However, managers must ensure that they do not face underinvestment problem due to lack of cash in future. Therefore, an objective assessment of future capital expenditure is to be made before distributing free cash to the shareholders.

Prudent use of free cash is also a controversial issue for public sector enterprises in India. For example, Coal India had generated an operating cash flow of INR 197 billion in 2014-15 and spent only INR 49 billion in capital expenditure during the same period. Recently (May 2016) the Department of Investment and Public Asset Management (DIPAM), Ministry of Finance , Government of India has issued a guideline to all central public sector enterprises (CPSEs) on how to restructure equity and distribute free cash flows to shareholders. The guideline attempts to bring together all equity restructuring options under a consolidated document. The guideline also categorically highlights its binding nature and requires specific approval of DIPAM for any exemption.  A CPSE is an entity where Government of India and/or Government-controlled one or more body corporate have controlling interest.

Table 1: Capital Restructuring Proposal for Central Public Sector Enterprises

Mode Condition/Criteria
Cash Dividend Minimum annual dividend of 30% of PAT (Profit after tax) or 5% of Net Worth, whichever is higher
Bonus Shares (Stock Dividend) Compulsory issue of bonus shares if reserves and surplus is equal to or more than 10 times of paid up capital
Share Buyback Option to buyback should be exercised if Net Worth is at least Rs. 2000 crore and Cash and Bank balance at least Rs. 1000 crore.
Stock Splits Compulsory split if market price or book value of a share exceeds 50 times of its face value.

Source: Guidelines of Department of Investment and Public Asset Management (DIPAM), Govt. of India

Dividend Policy

The guideline of the Ministry of Finance did not require CPSEs to declare their dividend policy in the annual report. It simply mentioned the quantum of minimum dividend to be paid each year. The capital market regulator (SEBI) is contemplating mandatory disclosure of a company’s dividend policy in an initial public offering (IPO) prospectus. Regulators believe that shareholders demand transparency on dividend and have every right to know the expected use of cash, if the same is not distributed as dividend. SEBI has recently made it mandatory for top 500 listed companies to declare a dividend distribution policy to their shareholders. SEBI has also mentioned that if a company decides not to pay out dividend in a particular year, it must explain the reason and how the retained earnings will be used.  A stated dividend policy will remove speculation and help analysts estimate fair value of shares. The Financial Reporting Council of UK has brought out a report[1] suggesting how companies can make dividend disclosures more relevant for investors.

The top ten[2] CPSEs have distributed Rs. 2.5 trillion as dividend over the past ten years (up to 31 March 2015) and spent only Rs. 1.3 trillion for organic growth (net capital expenditure).  The dividend paid is more than 5% of net worth of the CPSEs. Though the gross capital expenditure of the top ten CPSEs was Rs. 3.4 trillion, much of it was funded by depreciation. Dividend paid by these CPSEs over the past ten years is almost equal to the GDP of Odisha as on March 2015. Therefore, even in the absence of such strong guidelines, the profitable CPSEs were paying handsome dividend to the shareholders, the principal beneficiary being Government of India. The top ten NIFTY companies (excluding CPSEs) paid Rs. 1.8 trillion as dividend during the same period- almost 30% lower than the CPSEs.

ONGC paid dividend of about Rs. 764 billion during the past ten years and spent Rs. 181 billion on capital projects. Coal India paid about Rs. 590 billion dividend in last ten years. The capital expenditure (net) incurred by the company during this period was abysmally low at only Rs. 2 billion.  The third highest dividend paying CPSE was NTPC which distributed Rs. 418 billion as dividend and spent more than double of the amount (Rs. 863 billion) for capacity building. Government of India, as principal shareholder of the CPSEs, has directed all profitable CPSEs to follow the minimum dividend guideline.  Is it right for the major shareholder to ‘compel’ companies to pay any pre-announced dividend? Any prudent dividend policy would lay down circumstances when dividend will or will not be paid. The quantum should only be decided after evaluating the following factors: (a) future expansion need; (b) profit earned; and (c) free cash flow. However, in view of huge cash pile up and lack of clear expansion plans, the CPSEs would definitely face the heat of the shareholders for distribution of free cash. The situation equally applies to companies in the private sector.

Table 2: Utilisation of Cash Flows of top 10 CPSEs     (figs in Rs. Crore, unless otherwise stated)

1

Source: Ace Equity.

Net Capex=Capex- Depreciation. OCF= After-tax operating cash flows. Own(%)= Government ownership

Bonus Shares

The guideline directs that a CPSE should issue bonus shares if the retained earnings are more than 10 times paid up capital. The guideline further states that whenever the multiple (retained earnings/ paid up capital) exceeds 5, the concerned CPSE should evaluate the possibility of offering bonus shares. It is generally understood that bonus shares reward shareholders. Typically, whenever retained earnings of a company become disproportionately higher and the concerned firm is unable to reward its shareholder by way of cash dividend, bonus shares prove useful.  However, it is also to be noted that issue bonus shares act as poison pill and create permanent pressure on the treasury of a firm for future dividends. In that sense, bonus debenture could be a better choice.

Seven out of top ten CPSEs are required to issue bonus shares if one follows the diktat of the DIPAM guidelines. Most of these are from energy sector. It may be noted that five of these CPSEs had already issued bonus shares in the last ten years.  If Government of India has plans to disinvest further its stake in these CPSEs, it is always prudent to have lower equity base. The blanket guideline on issue of bonus shares would bloat the paid up capital of many entities thereby making them unattractive to potential investors.

Table 3: Potential Bonus Issuance (figs in Rs. Crore, excepting the multiple)

2

Source: Ace Equity. RE= Retained earnings, Capital= Paid up capital, Multiple= RE/Capital

Share Buyback

Theory of corporate finance tells us that one of the motivations of share buyback is to distribute free cash to the shareholders so that the latter can use the funds profitably. There are examples of shareholders’ pressure for buyback whenever any company holds too much of cash. But the real question is how much cash is too much? The DIPAM guidelines provide that any CPSE with a cash balance of more than Rs. 1000 crore should seriously consider share buyback to distribute free cash. If one considers current investments as part of cash and cash equivalents, all the ten top CPSEs (Table 4) should buyback shares. The main motivation behind the guideline seems to be reducing the budget deficit of the central government rather than enhancing shareholder wealth.  The guideline may also contradict its own recommendations. For example, ONGC is required to issue bonus shares, pay hefty dividend and also buyback shares- all in the same year! Whereas the financial statements of ONGC show that the company has already severely depleted its cash reserve from a high of 18% of total assets to only 1.2% in March 2015.  It is always prudent to consider relative rather than absolute liquidity while taking a share buyback decision. One might of course argue that ONGC has spent only 7% of operating cash of past ten years in capital projects and hence clearly the company does not have any immediate need of hoarding cash.  It has already paid 28% of its operating cash as dividend over the past ten years. Hence, there is no valid reason of ‘forcing’ the company to go for a share buyback with such a low relative liquidity position. The guideline should have specified a relative liquidity criterion (e.g., cash as a percentage of total assets) to trigger share buyback.

Table 4: Share Buyback Candidates      (figs in Rs. Crore, unless otherwise stated)

3

Source: Ace Equity

Stock Split

There are two theories behind corporate motivation for stock split- first, split enhances liquidity of stocks and diversifies the shareholders; and second, it sends a signal of superior performance of the firm. Empirical evidence, however, supports the hypothesis of the liquidity theory. The DIPAM guidelines mention that whenever market price or book value of share of a CPSE exceeds 50 times its face value, the CPSE will split its shares appropriately. Figures for the financial year 2014-15 (not reported here) suggest that three out of top ten CPSEs (ONGC, NMDC and BHEL) is required to split their shares on book value basis. However, if one looks at the market value-to-face-value multiple, there are four companies (BPCL, NMDC, HPCL and BHEL) having such multiple more than 50 and hence are required to split stocks.  If one CPSE has a face value of Rs. 10 per share, the guidelines suggest that the CPSE with a book or market value of share more than Rs. 500 should consider stock split. Isn’t that too predictable?

Equity restructuring is a continuous process and is used by the management as a technique to enhance the net worth of a company. Equity restructuring strategies increase the price-to-book multiple of firms. Share buyback is not that popular in India as the shares so bought back are to be cancelled. Cash dividend, on the other hand, is a more popular form of distribution of cash to shareholders. But dividend is stickier than share buyback. Hence, if a firm has to distribute a large amount of cash to shareholders, it is always prudent to opt for the buyback route. Any restructuring action generally conveys positive signal to the market. But if the actions are pre-defined and follow some cardinal principles, there would be no surprises and market would factor in such actions in the prices much before the actual events. Splitting stock when the market price exceeds INR 500 (with a face value INR 10) is too low a level for such action. For example, 43 out of 50 NIFTY companies have share prices more than 50 times of their respective face values. If these companies start splitting stocks (some of them have already done that), the market will witness a surge in supply which may not always increase the return of the stocks.

********

[1] https://www.frc.org.uk/Our-Work/Publications/Financial-Reporting-Lab/Lab-Project-Report-Disclosure-of-dividends-%E2%80%93-poli.pdf (accessed on 15 July, 2016)

[2] By market capitalization as on 30 June 2016

Non-Performing Assets of Indian Public Sector Banks: Is all Well?

The Financial Stability Report of June 2016, recently released by the Reserve Bank of India (RBI) is an interesting reading. Notwithstanding the standard Central Bank Speak, often couched in terms of what is known as ‘constructive ambiguity’, the report reveals some serious concerns on Indian banking – the most important being the state of non-performing assets (NPAs) of the Indian public sector banks.

The report confirms the already known fact that not all is well in the health of Indian banks. In fact, the gross NPAs rose sharply to 7.6 per cent (of gross advances) in March 2016 – this is 250 basis points increase over the last six months – from 5.1 per cent in September 2015. But this is only part of the story – if one adds the quantum of restructured assets to NPAs, then the overall “stressed advances” rose to 11.5 per cent in March 2016. Stripped of jargon, in simple terms, it reveals that more than 10 per cent of the loans extended by banks in India are bad debt.


Trends in NPAs

But was this expected? In fact, if one looks at the intertemporal behaviour of NPAs of banks in India since 2002-03, numbers show remarkable improvements till about 2009. Since then the NPA situation started deteriorating, so much so that by March 2016, it appears that all the progress achieved during the last one decade or so, has evaporated and Indian banks in 2016 are back to the situation prevailing in 2002 (Chart 1)!

Chart 1: Trends in Gross Non-Performing Assets of the Banking Sector in India

1

(% of Gross Advances)

Source: Handbook of Statistics on Indian Economy, RBI, various Issues.

But this deteriaration is not uniform across all banks. There is great difference in the extent of formation of NPA across ownership-specific bank-groups. Effetively, the derioration in NPA front is primarily driven by the public sector banks; in recent times, the NPAs of private banks are less than one-third than those of public banks (Chart 2). Since the issue is primarily related to the public sector banks, one can go a step further and add that it is beyond the financial sector in India and that it becomes effectively a fiscal risk, imposing a burden on the already stressed State Exchequer.

                             Chart 2: Asset quality of Scheduled Commercial Banks

2

Source: Financial Stability Report, June 2016, RBI


To release or Not to Release (the names of big defaulters)?


Who are responsible behind such deterioration?  Have the banks become more inefficient in recent times? Or, are bank borrowers, of late, going through bad times? Is it effectively a cyclical phenomenon? Such questions are raised. In popular discourse the situation is often seen as a product of Indian variety crony capitalism whereby a coalition of bankers-bureaucrats-politicians-corporates could have generated this unwanted outcome. In fact, there is a larger debate about the desirability (or its lack) of revealing the firm-specific or indutry house-specific data on bad debt. Like any major issue in public policy, in this case too, arguments exist on both sides. Illustratively, in a country where farmers routinely commit suicide on account of debt burden, one can legitimately question the lack of enthusiasm of the authorities to publish such data; at the same time one can also be sceptical about the lack of investigative journalism in this regard. On the other hand, it can be argued that when a particular business venture of a business house goes through a bad patch, leading to its inability to pay back bank loans because of some legitimate and secular reasons, publishing such price sensitive information could be a recipe for an overall corporate disaster. After all, historically, the notion of limited liability came up with the motive of ring-fencing one’s personal property from the assets of a company.


Sectoral Composition

Leaving aside such an issue, in absence of any firm data of industry-group-wise contribution to NPAs, one can only look at some collaborative evidence. What we now know is that small firms or priority sector advances are not responsible behind the NPA mess; and thus, unlike many of our economic malaises, the NPA situation is not an outcome of macroeconomic populism. In fact, bulk of the NPAs have emanated from the industrial sector, in which share of construction, basic metals, infrastructure, and textiles are rather large (Chart 3).

3

In fact, in terms of size class, much of NPAs that sprang during 2015 are concerntrated in the size of Rs 200 million to Rs. 500 million (Chart 4). Apart from the possibility of crony capitalism and laxity on the part of the bankers, several factors seem to be responsbile behind such a phenomenon.[1] First, in the aftermath of the global financial crisis, the regulatory foreberance adpted by the Indian authorities could have been too aggressive.[2] Second, in some of the sectors like steel and basic matels the story is part of the global recession and consequent nose-diving of metal demand. Third, in its over-zealous pursuit of infrastircuture projects under the PPP model, both the government / banks as well as corporates could have kept the old-fashioned calculations of project viability under the carpet. Finally, in general many of the Indian corporates have taken the easy route of debt financing; this is refleted in a 2015 Credit Suisse Report on India that noted a seven-fold increase of indebtedness of ten heavily indebted Indian corporates over the last eight years.

4

Recent Initiatives

However, not all is lost. Some efforts to ease the situation are already under way. The RBI has issued guidelines on a ‘Scheme for Sustainable Structuring of Stressed Assets’ (S4A) on June 13, 2016. The S4A scheme “envisages determination of the sustainable debt level for a stressed borrower, and bifurcation of the outstanding debt into sustainable debt and equity/quasi-equity instruments which are expected to provide upside to the lenders when the borrower turns around”.[3] The Scheme has been criticized on the ground that promoters are not brining any assets. In fact, in a recent interview, the RBI Deputy Governor S S Mundra went on to say:

“… These are not the best solutions; these are the second-best solutions. We don’t have the best solution in place at this point. Hopefully, it will be put in place. once it comes (Bankruptcy Law), things will be dealt with under that structure. It leaves room for a potential upside and when that comes, the one who has sacrificed more should also gain more.”[4]

As part of its Indradhanush Proposal of April 2015, Government of India has earlier proposed revamping the public sector banks by infusing capital worth of Rs.70,000 crores out of budgetary allocations for four years – for Rs 25,000 crore in 2015 -16; Rs. 25,000 crore in 2016-17; and Rs 10,000 crore in each of 2017-18 and 2018-19.[5] During 2015-16, 21 public sectors banks got fund support of Rs 25,000 crore; of this, SBI got the highest amount of Rs 5,393 crore followed by Bank of India at Rs 2,455 crore. More recently, the Finance Minister reiterated the government’s intention to stick to the declared schedule of capital infusion to public sector banks.

But capital infusion and restructuring is part of the immediate solution. End of the day, if Indian public sector banks want to bring back soundness in their balance sheet, professionalism of the management and freedom from interferences from the government / politicians need to be ensured. Besides, the country needs to have systemic procedure for corporate bankruptcy. Otherwise, this pattern of formation of NPAs and rescuing the public secror banks with tax payers’ money becomes a scheme of cross-subsidization of the rich and mighty by the poor and is best avoidable.


*******


[1] Mohan, Rakesh and Partha Ray (2016): “India’s Financial Sector Reforms 2010-2016:  Outcomes And Issues”, presentation at the 17th Annual conference on Indian economic policy, organized by the Stanford Center for International Development (SCID), Stanford University, available at http://scid.stanford.edu

[2] Several such measures were introduced. Illustratively, provisioning requirements for most standard assets reduced to a uniform level of 0.40 per cent and risk weights on banks’ exposures to certain sectors revised downward.

[3] RBI Press Release on “RBI introduces a ‘Scheme for Sustainable Structuring of Stressed Assets”, June 13, 2016; available at https://www.rbi.org.in/Scripts/BS_PressReleaseDisplay.aspx?prid=37210

[4]http://economictimes.indiatimes.com/articleshow/52860383.cms?utm_source=contentofinterest&utm_medium=text&utm_campaign=cppst

[5] http://financialservices.gov.in/PressnoteIndardhanush.pdf

Restructuring Electricity Distribution Companies: The UDAY Scheme

Power has traditionally been the pillar for economic development. Despite its critical role in growth and economic transformation, the Indian power sector has been beset with technical and financial difficulties, with its criticality resulting in several Government bailouts of the sector, the latest of which is the “Ujwal Discom Assurance Yojana” or in other words, the UDAY scheme.

Structure of power sector in India

The Indian power sector governed by the Ministry of Power (MoP) can be categorized into three arms – Generation, Transmission and Distribution. Actual production of electricity, using diversified sources (ranging from conventional sources like coal, oil, natural gas etc. to non-conventional sources like wild, solar and domestic waste) can be regarded as the Generation segment. Transmission facilitates delivery of electricity through high voltage towers and interconnected lines from a generation plant to the distribution point. Distribution is the final stage in the delivery of electric power through which electricity received at the distribution centers is supplied to retain consumers and businesses via poles and wires.

In India, the Centre and the state governments were constitutionally entrusted to lay down the laws, issue licenses for the development of power supply network and to create State Electricity Board (SEB) in each State (Indian Electricity Act, 1910 and The Electricity (Supply) Act, 1948). Over the years, electricity generation and transmission sectors were opened to the private sector (through an amendment to the 1948 act in 1991 and The Electricity Laws (Amendment) Act 1998). However, distribution remained exclusively in the domain of the States, with few exceptions (e.g., West Bengal). Inefficient planning, lack of investment, over staffing, inadequate maintenance, power theft, non-billing or incorrect billing led to mounting losses to SEBs. Mismatch between tariffs and cost of generating power, delay in increasing tariff rates, below-cost tariffs to different consumer groups, and free electricity to agriculture weakened the finances of state utilities, making distribution sector unappealing for private investments. To address problems faced by the power sector especially for the purpose of distancing state governments from tariff determination, the central government, in 1998 passed, the Electricity Regulatory Commissions Act to mandatorily create the Central Electricity Regulation Commission which is designated to set the tariff of centrally controlled generation companies. States too were provided with an option to either set up a commission or function under the existing procedure. Nevertheless, it was only after the enactment of the Electricity Act, 2003, that the power sector underwent significant transformation.

The Electricity Act, 2003 which came into effect from June 02, 2003, replaced some of the previous laws to provide for the development of the power sector as a whole and shift regulated business to competitive business. It is “an Act to consolidate the laws relating to generation, transmission, distribution, trading and use of electricity and generally for taking measures conducive to development of electricity industry, promoting competition therein, protecting interest of consumers and supply of electricity to all areas, rationalization of electricity tariff, ensuring transparent policies regarding subsidies, promotion of efficient and environmentally benign policies, constitution of Central Electricity Authority, Regulatory Commissions..”

The Accelerated Power Development and Reform Programme (APDRP) which was first contemplated by the Central Government in 2002-03 to improve financial viability of the SEBs, reduce losses, improve quality and availability of power supply was modified further by the XI Plan as Restructured Accelerated Power Development and Reform Programme (R-APDRP). The programme was approved for IT enablement and strengthening of distribution sector through up-gradation for which funds are provided through loans to be converted into grant after achieving certain level of loss reduction.

Discoms – The weakest link

Distribution companies (Discoms) are the intermediaries between generators and the end-users of power which purchase electricity from wholesale markets and provide it to retail customers. Discoms charge a mark-up over their cost of supply to earn return in addition to other income they earn from investments. As Discoms are the backbone for the entire electricity supply chain, their debt overhang is seen as a bottleneck for the sector. The Chart given below shows the financial gap per unit of power in Discoms as a difference between average cost of supply (ACS) and average revenue (AR). Since 2008-09, the gap per unit has been consistently on the rise from Rs.0.77 to Rs.1.18 in 2012-13. During 2013-14, however, the gap reduced marginally to Rs.1.15. The primary reason for the ever-increasing gap could be non-equivalent increase in tariff in relation to increase in cost of inputs.

1

Source: Power Finance Corporation Ltd. Note: Average Cost of Supply (ACS) = Total Expenditure/Total input energy (Kwh); Average Revenue (AR) = Revenue from sale of power (excluding subsidy) + other income/Total input energy (Kwh); Gap = ACS – Average Revenue

Financial gap per unit per state for 2013-14 is illustrated in the following Chart. Out of 30 States, just 5 states, namely, Sikkim, Uttarakhand, Delhi, Kerala and West Bengal, were profit making states without state government subsidies. 11 states had a gap of less than Re.1 per unit, while remaining 14 had a gap of more than Re.1 per unit. It can also be observed that 9 states made up 75% of the total loss per unit during 2013-14.

2

    Source: Power Finance Corporation Ltd.


The deteriorating financial health of distribution companies has become an area of concern. They are caught in a vicious circle with operational losses being funded by debt reducing their ability to buy power to satisfy demand. Delayed and inadequate tariff hikes that are quite below the cost can be termed as the main reason for mounting losses. Apart from this revenue side constraint, there are other factors on the cost side such as failure on part of the states to undertake financial restructuring of Discoms in terms of fixing tariff on a regular basis and setting up of the State Electricity Distribution Responsibility Act, unforeseen cost of fuel, a sharp increase in the use of expensive imported coal last minute, rising interest expenses due to Discoms’ increased borrowing to meet cash-flow needs led to escalation in cost that played a crucial role in making finances weak for these companies.

3 

Source: Ministry of Power


Outstanding debt of DISCOMs has increased from about Rs.2.40 lakh crore in 2011-12 to about Rs.4.30 lakh crore in 2014-15, with interest rates up to 14-15% and accumulated losses of approximately Rs.3.80 lakh crore (as on March, 2015).


Reasons behind Discom losses         

Technical losses Technical losses are caused by power theft, overloading of existing lines due to higher demand for power, non-upgradation of equipment, improper relocation of distribution substations and provisioning for additional distribution transformers in the pipeline.
Commercial losses Commercial losses arise due to low metering/billing/collection efficiency, causing persistent gaps between ACS and ARR. Furthermore, faulty meters, billing on average consumption basis, delays in revenue collections and unauthorised usage of power by agricultural and rural consumers also contribute to heavy commercial losses.
Rise in subsidy dependence Delay and nonpayment of subsidies by state governments is a major source of loss for Discoms. These subsidies are meant to be paid to them to compensate for cheaper power supplies to certain segments promised by the state governments. In particular, the subsidy burden for distribution companies is estimated to have increased due to higher costs and cheaper tariff for the farm sector.
Under pricing and reporting lags Selling prices have been historically set significantly lower than the procurement price for electricity, influenced by the political agenda of state governments. Furthermore, Discoms release their financial results with a considerable lag, which complicates the assessment of their financial viability by potential lenders.
Power in concurrent list Electricity is a concurrent subject under the purview of states; as a result, oversight of Discoms is the domain of state governments. Consequently, it is difficult for the Central Government to reform Discoms directly.
Reduction in Power Purchase Agreements (PPAs) The lower energy requirement of Discoms due to their fragile financial health has resulted in fewer PPAs. Going forward, signing of new PPAs will depend on the ability of Discoms to enter into long term commitments. This implies that in the short term market, electricity generating companies will continue to remain exposed to volatile prices.

Source: RBI “State Finances: A Study of Budgets of 2015-16”

Vision for power sector

Revamping power distribution has now become one of the priorities for the government to achieve its ambitious “Power for All” goal as weakness in Discoms results in cascading effect on other sub-sectors of electricity supply. The Government announced several policy actions on distribution front as listed in the Economic Survey 2015-16, including:

  1. Ujwal DISCOM Assurance Yojana (UDAY) – States shall take over 75% of Discom debt outstanding as of September 2015, reduction of Aggregate Technical & Commercial (AT&C) losses to 15% and decrease in Gap (cost – revenue) by 2018-19, increased supply of domestic coal to substitute for imported coal, prohibition to avail short term debt from banks for financing losses.

  1. Deen Dayal Upadhyaya Gram Jyoti Yojana (DDUGJY) – Electrification of all villages, reduction in losses by metering of unmetered connections, separation of feeders to ensure sufficient electricity to agriculture and continuous supply to other categories and improvement of sub-transmission and distribution network to improve the quality and reliability of supply.

  1. Integrated Power Development Scheme (IPDS) – Strengthening of sub-transmission and distribution network, metering of distribution transformers/feeders/consumers in urban areas, IT enablement of distribution sector and strengthening of distribution network.

  1. Domestic Efficient Lighting Program (DELP) – 77 crore LED bulbs to replace household and street light incandescent bulbs.

  1. National Tariff Policy, 2016 – Revision of Cross subsidy surcharge formula and planning by regulator to supply power 24X7 to all consumers latest by 2021-22 or earlier.

The UDAY Scheme

The Union Cabinet approved the UDAY scheme on November 5, 2015 for the financial turnaround and revival of Discoms and ensure a sustainable solution to the problem of distribution losses.


Features of UDAY Scheme               

State Takeover of Discom Debt Debt takeover mechanism UDAY Bonds Treatment of residual debt Future Discom financing
Scheme available only for State Discoms including combined generation, transmission and distribution undertakings Debt of Discom will be taken over in the priority of debt already due, followed by debt with highest cost. Non-SLR bonds issued by States shall have maturity period of 10-15 years with a moratorium on repayment of principal up to 5 years, as required by the State. Up to 25% of the grant can be given as equity where the Discom requires equity support. Bank/FIs henceforth cannot advance short term debt to Discoms for financing losses.
States shall take over 75% of Discom debt as on September 30, 2015. Debt shall be taken over as:
2015-16 – 50%

2016-17 – 25%

Transfer to Discom by State will be as grant with an option to spread the grant over three years (MoP can further relax by 2 years for high debt States). 10 year Bond Pricing: The 10 year UDAY bonds would be priced at the 10 year G-sec + 0.50% spread for 10 year SDLs + 0.25% spread for non-SLR status on semi-annual compounding basis, or market determined rate, whichever is lower. This may be further reduced if the interest is paid on monthly basis. Discom debt to be taken over by the State will include Discom bonds which are committed to be taken over by the State as part of FRP 2012 including bonds already taken over in 2015-16. Working capital loans from Bank/FIs will only be allowed up to 25% of the Discom’s previous year’s annual revenue.
Discom debt is de facto borrowing of States which is not counted in de jure borrowing. Principal debt taken over will not be included in fiscal deficit of States. However, interest has to be serviced within FRBM limits. States will issue non-SLR including SDL bonds in the market or directly to the respective banks /Financial Institutions (FIs) holding the Discom debt to the appropriate extent. Proceeds shall immediately be transferred by the States to the Discoms, which in turn shall discharge the corresponding amounts of Bank/FIs debt. Bonds to be issued against the loans of Fis, including REC and PFC, would first be offered for subscription by the market including pension and insurance companies. Balance, if any, would be taken over by banks in proportion to their current lending to Discoms. For amount transferred as loan, the interest rate payable by the Discoms to the State for the intervening period shall not exceed the rate of interest on the bonds issued by the State. States shall take over the future losses of Discoms in a graded manner.

FY16 0% of the loss of FY15Top of Form
FY17 0% of the loss of FY16Bottom of Form
FY18 5% of the loss of FY17
FY19 10% of the loss of FY18
FY20 25% of the loss of FY19
FY21 50% of the loss of FY20Bottom of Form
Operationalized through a tripartite agreement amongst the Ministry of Power, State Government and the Discom. Banks/FIs shall not levy any prepayment charge on the Discom debt.   Residual Discom debt to be converted into bonds to be offered to market at a likely rate of State Bond + 0.20%. If not converted into bonds, Banks can lend at interest rate not higher than Banks’ Base rate + 0.10%. Loss financing after October 1, 2015 only as per loss trajectory finalized by States with MoP and only through SDLs or Discom bonds backed by State guarantee.
UDAY is optional for all States. Banks/FIs will waive any unpaid overdue or penal interest on the Discom debt and refund/adjust any such overdue/penal interest paid since October 1, 2013.   Half of residual debt shall be taken over by the State by 2016-17. States shall guarantee repayment of principal and interest payment for balance debt remaining with Discoms/ bonds issued by Discom.  

Source: Ministry of Power, Coal and New & Renewable Energy                                              


Expectations from the scheme

The UDAY scheme will not only serve at improving the financials of Discoms, it will also account for huge capital savings for the Indian banking sector, especially the Public Sector Banks which have maximum exposure to the power sector. The UDAY scheme rather than being a scheme doling out free funds without accountability is more of an attempt at financial restructuring for all the parties involved – the States, Discoms and their creditors. It is essentially a mechanism of converting outstanding Discom debt to tradable instruments rather than NPAs, thus, freeing up further funding channels. This will reduce the financial pressure on the Discoms and the resultant reduction in the cost of power can be passed on to the final consumers. Discoms will be forced to improve their operational efficiency to avail further financing. UDAY comes with strict budgetary constraints, provisions for monitoring by Central teams and binding operational milestones for the State governments and Discoms. Operational efficiency improvements like compulsory smart metering, upgradation of transformers, meters etc., energy efficiency measures like efficient LED bulbs, agricultural pumps, fans & air-conditioners etc. will reduce the average AT&C loss from around 22% to 15% and eliminate the gap between Average Revenue Realized (ARR) & ACS by 2018-19. Reduction in cost of power would be achieved through measures such as increased supply of cheaper domestic coal, coal linkage rationalization, liberal coal swaps from inefficient to efficient plants, coal price rationalization based on GCV (Gross Calorific Value), supply of washed and crushed coal, and faster completion of transmission lines. NTPC alone is expected to save Rs.0.35/unit through higher supply of domestic coal and rationalization/swapping of coal which will be passed on to Discoms/consumers.

The UDAY scheme will force fiscal prudence on the part of the States as it requires them to absorb a part of future losses of the Discoms while providing for the cost of servicing their subsidies in their Budgets. Financial liabilities of Discoms are the contingent liabilities of the respective States and need to be recognized as such. States shall take over 75% of Discom debt as on September 30, 2015 over two years – 50% of Discom debt shall be taken over in 2015-16 and 25% in 2016-17. This will reduce the interest cost on the debt taken over by the States to around 8-9%, from as high as 14-15%; thus improving overall efficiency. Further provisions for spreading the financial burden on States over three years, will give States flexibility in managing the interest payment on the debt taken over, within their available fiscal space in the initial few years. A permanent resolution to the problem of Discom losses will be achieved by States taking over and funding at least 50% of the future losses (if any) of Discoms in a graded manner. It also provides incentives for performing states.

Benefits of UDAY

Government Industry & Consumers Banks & Investors Additional Benefits for States Discoms
Achievement of 24X7 Power for All Availability of 24X7 power improving quality of life and efficiency Avoid banking contagion (Rs.40,000 crore of repayments due to banks in 2015-16) which will create significant NPAs States accepting the scheme and performing as per operational milestones will be given additional/ priority funding through DDUGJY, IPDS, Power System Development Fund (PSDF) or other such schemes of MoP and MNRE Enabling quarterly tariff increase to mitigate cost increase burden
Power to 5 crore households without electricity Lower cost of power -Typical 3,000 MW NTPC plant running at 60% Plant Load Factor (PLF) has a fixed cost of Rs.2.67/unit, vs Rs.1.80 at 90% PLF Lower risk for existing investments and loans in power, coal and renewables sector Such States shall also be supported with additional coal at notified prices and, in case of availability through higher capacity utilization, low cost power from NTPC and other Central Public Sector Undertakings (CPSUs) Operational efficiency
Speedy achievement of electrification of remaining 18,500 villages Global competitiveness of industry Lower capital adequacy provisions as direct exposure to state governments would attract 0% risk-weight, compared to 20% for state government guaranteed exposure to Discoms, thus freeing up substantial amount of risk-weighted capital. The remaining Discom loans would attract lower provisioning as they would be classified as standard   Lower cost of power
Energy security through coal and renewables   Increased procurement of power by Discoms revives existing power projects suffering from low PLFs   Reduction in interest cost
Reduce Current Account Deficit (CAD) from higher diesel import (current annual imports of around Rs.50,000 crore)   Reduces investment uncertainty across the sector   Opportunity to break even in the next 2-3 years
Meet ambitious renewable energy commitments as a responsible global citizen       Enforcing financial discipline through alignment with State finances
Revive investments in power sector to create jobs       Future bank lending channels opened

Source: Ministry of Power, Coal and New & Renewable Energy                                                                                                                                      

UDAY- Issuance Mechanism

In March 2016, RBI asked for bids from market participants interested in subscribing to the UDAY bonds through private placement route. Given non-SLR status by RBI, these securities were issued by eight State Governments under the Government Securities Act, 2006 and are eligible for market repo.


State-wise issuance of UDAY Bonds during 2015-16 (Rs. Crore)


Sr. No. States Bonds issued (Face Value) Average Coupon of Issue
1 Rajasthan 37,349.77 8.35
2 Uttar Pradesh 24,332.47 8.55
3 Haryana 17,300.00 8.21
4 Punjab 9,859.72 8.51
5 Jharkhand 5,553.37 8.51
6 Jammu & Kashmir 2,140.00 8.51
7 Bihar 1,554.52 8.51
8 Chhattisgarh 870.12 8.54
  Total 98,959.97  

Source: RBI, CCIL


Profile of UDAY bonds issued in 2015-16

UDAY bonds have added substantially to the future debt liabilities of the participating States for the next decade and a half. The near-term liability for these bonds is the highest for Rajasthan, which also has the highest proportionate share of UDAY bonds in total debt.

Maturity Profile of UDAY Bonds (Face Value in Rs. Crore)

4

         Source: CCIL (SDLs Outstanding as of May 31, 2016)

UDAY bonds have been issued at multiple maturities to suit the appetite of various investor groups. The higher yields compared to the central government securities is expected to attract investments. In general, Uttar Pradesh has had to offer the highest yields for these bonds.

Coupon Profile of UDAY Bonds issued in 2015-16 (%)                       

FY/State Rajasthan Uttar Pradesh Haryana Punjab Jharkhand Jammu & Kashmir Bihar Chhattisgarh
2017-18 8.35
2018-19 8.35
2019-20 8.35 8.32
2020-21 8.35 8.50
2021-22 8.35 8.60 8.21 8.51 8.53 8.53 8.53 8.55
2022-23 8.35 8.52 8.21 8.45 8.45 8.45 8.45 8.48
2023-24 8.35 8.56 8.21 8.48 8.50 8.50 8.50 8.53
2024-25 8.35 8.52 8.21 8.50 8.50 8.50 8.50 8.50
2025-26 8.35 8.30 8.21 8.22 8.22 8.22 8.22 8.27
2026-27 8.64 8.44 8.45 8.45 8.45 8.64
2027-28 8.72 8.65 8.65 8.65 8.65 8.67
2028-29 8.48 8.48 8.48 8.48 8.48 8.46
2029-30 8.69 8.62 8.62 8.62 8.62 8.60
2030-31 8.79 8.72 8.72 8.72 8.72 8.70
Total 8.35 8.55 8.21 8.51 8.51 8.51 8.51 8.54

Source: CCIL

Despite the worsening in their fiscals, most States managed to issue the UDAY bonds at lower coupons than their existing securities for the respective tenors, primarily as a result of the rally in the benchmark 10-year central government bond following the Budget, which was the basis for the pricing of these bonds. As a result States such as Rajasthan were able to issue UDAY bonds at coupons lower than the cut-offs in the primary auctions for their 10-year SDLs.

Average Coupon Non-UDAY SDLs (%) and Spread of UDAY Bonds (bps)

5

Source: CCIL


Impact on Primary Market

Overall indebtedness of States has been on an upward trajectory, especially during the last financial year when market borrowings jumped more than 22% over the previous fiscal. While the RBI was able to conduct market borrowing operations in a smooth manner without undue disruptions, the apprehensions about the incremental supply of state bonds due to the UDAY issuances led to the hardening of the cut-offs in the SDL auctions in the last quarter of 2015-16. Lack of clarity on the RBI provisions regarding the bonds also added to the negativity made especially severe due to the prevailing liquidity tightness. The increased supply was also blamed for the lack of FPI interest in SDLs despite enhancement of limits on fears of supply outstripping demand. The market received some support after the RBI clarified that the UDAY bonds would be issued on private placement basis and could be considered for classification under the held-to-maturity (HTM) category.

Primary Market Borrowings (10-year SDL) (Rs. Crore)                                     

Month/State Rajasthan Uttar Pradesh Haryana Punjab Jharkhand Jammu & Kashmir Bihar Chhattisgarh
Apr-15 1000 4000 1000
May-15 1000 2000 1900 900 500
Jun-15 1000 2000 1000 600
Jul-15 1000 2000 1900 600 1000 500 700
Aug-15 1000 1000 1500 450
Sep-15 500 2000 2000 1300 2000
Oct-15 1750 3000 1500 500 1500
Nov-15 2250 2000 800 500 1000 300 800
Dec-15 1500 1900 600 500 150 1500
Jan-16 3000 4000 1100 300 500 700
Feb-16 1800 5000 2500 1000 1850 350 5000
Mar-16 2500 1500 1000 3000 1150
2015-16 15800 30000 14100 10800 5350 2250 11500 4850
Apr-16 750 2400 1200
May-16 750 4500 800

Source: CCIL

While the investors were able to lock in higher yields, the interest costs for the borrowers were higher despite a downward trajectory in policy rates. Impact of the UDAY issuances was observable with investors differentiating between states based on their fiscal position and the quantum of losses accumulated by their Discoms. Yields started declining post RBI’s clarifications.

Primary Market Cut-offs (10-year SDL) (%)       

Month/State Rajasthan Uttar Pradesh Haryana Punjab Jharkhand Jammu & Kashmir Bihar Chhattisgarh
Apr-15 8.05 8.09 8.05
May-15 8.29 8.27 8.21 8.32 8.18
Jun-15 8.22 8.20 8.22 8.27
Jul-15 8.29 8.31 8.29 8.34 8.30 8.30 8.32
Aug-15 8.28 8.29 8.26 8.28
Sep-15 8.23 8.20 8.20 8.22 8.17
Oct-15 7.97 7.99 8.01 7.98 7.99
Nov-15 8.15 8.16 8.15 8.14 8.17 8.17 8.19
Dec-15 8.23 8.27 8.24 8.25 8.26 8.23
Jan-16 8.33 8.37 8.38 8.31 8.42 8.32
Feb-16 8.56 8.68 8.51 8.56 8.82 8.63 8.68
Mar-16 8.27 8.58 8.17 8.60 8.35
Apr-16 7.98 8.02 7.97
May-16 8.00 8.03 8.00

Source: CCIL


Impact on Secondary Market

SDL yields spiked in January-February 2016 as the market, already apprehensive due to the enhanced State borrowings through incremental supply of SDLs, waited for clarity on the UDAY issuances.

Secondary Market Yields of SDLs >9 year (%)          

Month/State Rajasthan Uttar Pradesh Haryana Punjab Jharkhand Jammu & Kashmir Bihar Chhattisgarh
Apr-15 8.12 8.07 8.03 8.10 8.08 8.12
May-15 8.17 8.20 8.18 8.24 8.22 8.16 8.16
Jun-15 8.21 8.24 8.22 8.24 8.25 8.24 8.28 8.29
Jul-15 8.24 8.26 8.24 8.30 8.29 8.22 8.31
Aug-15 8.23 8.20 8.26 8.23 8.21 8.28 8.24 8.21
Sep-15 8.25 8.18 8.19 8.20 8.18 8.23 8.17 8.20
Oct-15 8.01 7.98 7.97 7.98 7.96 7.97 7.96
Nov-15 8.12 8.14 8.10 8.12 8.14 8.08 8.16
Dec-15 8.18 8.20 8.22 8.16 8.18 8.26 8.21
Jan-16 8.30 8.33 8.33 8.24 8.40 8.30
Feb-16 8.59 8.63 8.49 8.40 8.68 8.75 8.62 8.34
Mar-16 8.29 8.46 8.17 8.22 8.33 8.12 8.46 8.43
Apr-16 8.04 8.04 8.01 8.06 8.06 8.06 8.03
May-16 8.02 8.02 8.03 8.03 8.04 8.03 8.05 8.03

Source: CCIL. Excluding Special Bonds   

Commensurate to the spike in yields of SDLs, spreads over g-secs also rose during the last quarter of 2015-16, peaking in February 2016, and declining thereafter throughout March as the market got increased clarity from the RBI over the implementation of the scheme.


Secondary Market Spread of SDLs >9 year (bps)    

Month/State Rajasthan Uttar Pradesh Haryana Punjab Jharkhand Jammu & Kashmir Bihar Chhattisgarh
Apr-15 30 26 21 28 24 28
May-15 24 26 29 29 29 36 26
Jun-15 29 28 30 29 24 27 28 24
Jul-15 30 32 29 31 34 29 38
Aug-15 30 32 30 33 32 35 34 30
Sep-15 36 34 32 33 31 39 32 34
Oct-15 33 28 30 27 30 29 29
Nov-15 31 32 30 31 32 34 32
Dec-15 30 31 32 29 29 31 31
Jan-16 54 55 56 41 62 53
Feb-16 63 71 63 55 75 70 71 53
Mar-16 55 65 47 49 57 39 66 63
Apr-16 43 43 44 39 45   44 40
May-16 41 41 41 42 39 39 44 42

Source: CCIL. Excluding Special Bonds                                                                                                                          

Despite the initial negativity in the market over the non-SLR status of these bonds, they have found sufficient liquidity in the secondary market – both outright and market repo segments unlike power bonds issued earlier by States. The share of UDAY bonds in total trading of SDLs during April-May 2016 was almost 32% in the outright and a substantial 68% in the repo segment.

Trading Summary UDAY Bonds in 2016-17        

State Outright Repo
Trades Value (Rs. Cr) % Share in Total SDL Trades Value (Rs. Cr) % Share in Total SDL
Rajasthan 218 2208.65 3.25 146 15700.00 32.65
Uttar Pradesh 121 1173.46 1.73
Haryana 8 42.75 0.06 66 11825.00 24.59
Punjab 905 9864.30 14.52 81 3500.00 7.28
Jharkhand 47 329.23 0.48
Jammu & Kashmir 233 1979.00 2.91
Bihar 77 668.48 0.98 99 3962.00 8.24
Chhattisgarh 120 860.33 1.27 17 960.00 2.00
Total 1729 17126.20 25.21 409 35947.00 74.76

Source: CCIL                                                                                                                                                                   

NBFCs followed by Mutual Funds have been the most active participants in secondary outright market for UDAY bonds. However, in terms of net activity, Provident Funds have been the most active buyers with Insurance companies being a distant second. Public Sector Banks have been the most active sellers.

Conclusion


UDAY is being projected by the government as a shining example of the utilization of the best principles of cooperative and competitive federalism. The journey so far for the UDAY bonds has been relatively smooth sailing as investors have gained appetite for these bonds, with default risk akin to SDLs, in a bid to lock in higher yields. The improvement in the financials of the Discoms, on the other hand, is expected to help overcome the critical hurdle in the government’s ambitious goals for the power sector.


******


Revival of Profitability of Indian Corporates: Will it happen?

At least for the last two years several analysts have been predicting a strong revival in earnings growth of Indian corporates. However the earnings growth in FY16 has been anaemic and elusive. The aggregated EBITDA earnings of BSE500 (Excluding Banks and financial Services) and also BSE200 have shown a marginal uptick in FY16 over FY15 levels. However it is not close to the fantastic growth rate of 12%-15% that has been doing the rounds for last couple of years. However most analysts usually focus on PAT. The aggregated growth rate of PAT is lower than that of EBITDA.

The more popular reasons for this uptick in earnings, in the recent past, are fall in commodity prices benefitting input costs of corporates as well as low base of previous years. However one reason that is often missed is that the market index of corporates usually have positive selection bias. To elaborate, companies which have significantly lost their market capitalisation were periodically removed from the index and their place was taken by companies with better performance. Thus if one is tracking the earnings growth(y-o-y) of any stock market index by considering the earnings of the corporates which are part of the index at that point of time, it is possible that the earnings growth may appear better. Ideally to track the earnings trend one may have to consider the same set of companies over time. One possible way may be that if one is tracking aggregated earnings growth for a five year period one may consider taking the corporate in index three years back and monitor their earnings performance. This may control for the positive selection bias in market index. It may be noted that considering the latest constituents of market index and tracking the earnings for the same companies for the past five years may not fully eliminate the positive selection bias.

A common approach, at least , in Indian markets is to take a set of companies and perform a bottom up analysis ie; expected earnings growth of each of the companies are first predicted and then rolled up to predict the aggregate earnings growth of a group of companies. Nothing per se wrong with this approach. Even in bleak economic scenarios it is possible to find a handful companies whose earnings growth will be much higher than other companies. However, the criticism of this approach of aggregate earnings growth prediction is that such approaches do not, explicitly and methodologically, consider macro-economic factors. Neglecting these macro factors while modelling the future aggregate earnings growth may be one of the reasons, why the aggregate earnings prediction has been way off the mark in most instances.

Macro-Economic Framework for Aggregate Earnings Predictions:

The anaemic earnings growth of Indian corporates may be better explained by a framework known as Kalecki Levy Profit Equation (KLPE). This possibly is the only equation, discovered way back in early 1900, which explicitly connects and explains aggregate corporate profit in terms of macro-economic variables. Unfortunately and surprisingly, most macro-economic text books as well as books on investment management do not even make passing reference to KLPE. This equation is more on the lines of an identity and has been found to have a high success rate in predicting corporate earnings across a wide variety of economies and at various points in the business cycle.

The relationship between aggregate corporate earnings and macroeconomic variables were first recognised by Jerome Levy. Levy, as the story goes, sold his stock holdings in 1929 just before the US stock market tanked. The analytical basis for his decision was provided by the above referred equation. However, credit goes to polish economist Michal Kalecki, who in 1930s, independently rediscovered the relationship. Further his explanation and derivation of the identity contributed significantly to broaden the appeal and usage of the equation.

 KLPE is expressed as follows:

Aggregate Corporate Profits (in an economy) equals(=) Investment less Foreign Savings less Household Savings less Government Savings add Dividends add Corporate profit tax. So as per KLPE the aggregate Corporate Profits will increase as economy-wise Investment (in real assets) increases; similarly if more Foreign Savings come into the economy in the form of spend (export income) or foreign investment it increases corporate profits. If households start saving more, which is consume less, it will drag corporate profits. Less intuitive may be the aspect that increase in government savings (i.e.; reduction of government’s fiscal deficit) adversely affects corporate profits, which is to say what is good for government balance sheet may not be good for private corporate’s balance sheets. Likewise dividend and corporate taxes of the equation may appear counter-intuitive at first glance. So let’s take a look at KLPE in more details.

The Ground Rules:

Let’s start with a simplistic economy with just two sectors, businesses and households. Businesses supply goods and services which are purchased by households and other businesses. Households provide labour to business and earn wages. Households are also consumers and help businesses generate revenues and earn profit. In this hypothetical closed economy, the total income of the business (corporate profit) and the household (wage) is equal to the total expense of the business (investment) and the expenses of household (consumption). So, Corporate Profit + household wage = Corporate Investment + Household Consumption. Acknowledging that for the household sector, wage net of consumption is household savings, the above equation becomes: Corporate Profit = Corporate Investment + Household Consumption – Household Wage. So Corporate Profit = Corporate Investment – Household Savings. If the economy-wide, businesses do not invest in physical asset creation, the investment’s contribution to aggregate corporate profit is zero. In such a situation, even if households spend their entire wages on consumption, there is zero household saving and, thus, incremental profit still remains zero.

How Investment gives ‘Birth’ to Profit:

Investment leads to creation of physical assets which did not exist previously. When a firm buys an asset, in the year of purchase there is hardly any revenue expense for the buyer. In the process of buying, one form of asset (cash) gets converted to another (plant and machinery). Subsequent to purchase, expense arises as depreciation attributable to the economic aspect of the asset’s value erosion, owing to wear and tear. For the firm selling the asset the selling price includes the profit for the seller firm. The investment transaction between the buyer firm and the seller firm not only created investment but also ‘gave birth to’ profit in the economy, which otherwise would not have been there during that period. The bumper profits enjoyed by the Indian corporate sector during the period FY05 to H1FY09 were driven mostly by investments created in the economy.

Currently the investment growth in India is quite discouraging on the private corporate side and most investment in the economy is driven by government. However, historically private investment has been the bulk of the investment in India. Given this, the current investment level is unlikely to give a boost to aggregate corporate profit.

The Karma of Corporate Short-Term Decisions:

Corporate actions that may be driving short­term profitability of one firm, if adopted by all firms in the economy may be detrimental to the overall profitability of the corporate sector. For example a firm may decide to boost its profits by reducing wage outflow and/or raw material consumption. This very ‘reasonable decision’ if replicated by all firms in the economy, would start restricting profitability possibly more and for a longer period of time than the short term benefit of cost savings. This is because as overall wages in the economy is constrained, consumption will fall, corporate revenue growth will be muted, systemic capacity utilisation starts signalling overcapacity, thereby slowing capital investment in the economy. Similarly, raw material suppliers are themselves firms. If their users reduce raw material purchase, then the revenue of raw material suppliers will fall. Thus a vicious downward cycle of overall low corporate revenue growth and constrained profitability arises because of an otherwise ‘sensible’ (from a micro perspective) decision of cutting cost at a firm level.

For the business sector, the aggregate profit net of corporate profit tax and dividend of all corporates is a measure of corporate savings. Given that savings are the accumulation of wealth, corporate savings represent the corporate sector’s ownership on incremental wealth created in the economy during that period. Thus at a firm level, distributing dividend or paying taxes tends to reduce the wealth of the firm.

But if one broadens the argument to an economy-wide level, then the aggregate dividend paid by all firms in the economy will provide more spending power to their shareholders. These shareholders would then be able to spend more on goods and services. This will add to the revenue of the business segment within the economy.

Similarly, higher corporate tax outflow may be detrimental to a specific firm in that time period, but it will provide more spending power to the government, which may then be used for capital expenditure and other consumption related spending. Of course a government can always create money to spend in the economy. If the government does spend, then this would benefit the overall revenue and profitability of the business sector.

The Household Decision and Corporate Profit:

In the current scenario in India where corporate, particularly private corporate investment is somewhat muted, what may possibly boost corporate profit? One of the drivers of corporate profitability can be household dissaving’s. Which is if households start spending their past savings or taking a step further if households borrow to pay for their consumption. Thus if abundant and cheap credit is made available to households who then spend it, it would give a boost to corporate profitability. Moderation of consumer inflation may also provide higher consumer surplus. Thus households may be better placed to drive corporate profitability. However since the size of that spend is much limited compared to investment size (as has been the case in the past) it may not push up the corporate profit growth by a large extent.

Lowering Fiscal Deficit limits Corporate Profits:

Government spending in the economy — be it for the creation of public utilities or even direct transfers to the households — ultimately creates revenues and aids profitability. However, at a time when the other big driver of corporate profit, i.e., investment is struggling, the check in fiscal deficit may further aggravate the corporate earnings pressure. The boost in aggregate corporate profitability during FY10­FY11 owes a lot to the spike in government spending in H2FY09 in response to the global financial crisis. Of course the government’s fiscal deficit rose sharply around that time but what were the other choices post the Lehman Shock?

Current Account Surplus Boosts Profits:

Current Account Deficit (CAD) is technically foreign dis-savings. When payments to foreign participants in a domestic economy exceed the receipts from them, then there is a net outward transfer of wealth from domestic economy. This transfer of wealth drags down economy wide profitability. In case of Current Account Surplus just the opposite happens. It may be noted that reduction of CAD as is the case currently in India creates a base for revival of corporate profit growth.

What Does KLPE Tells About Future Corporate Profitability of India:

If savings/surpluses of sectors such as household, government, foreign investors/trade partners are not circulated back to the economy for consumption or real assets creation, the aggregate corporate profitability will be dragged lower. Economic uncertainty may discourage household from spending and persuade them to put money in savings deposit. Likewise banks struggling with corporate NPA may adopt a very conservative approach to lending. One will limit consumption the other will limit investment and creation of real asset. Both these feed into systemic low capacity utilisation which reduces corporate appetite for investment. The vicious cycle in private sector has potential to limit profitability/ growth for next two-three years. Government spending may have saved the situation in the medium term that would have caused government’s fiscal deficit to rise. While fiscal discipline has long term benefits it does not help the corporate profitability in the short to medium term. What may significantly save the day is heavy duty transfer of foreign savings in India in the form of Investment. But that may not be easy, given the global uncertainty and the ensuing reduced risk appetite for emerging market investments such as India.

Thus unless government spends heavily on the economy and households too spend, the aggregate corporate profit growth of India may continue to remain lukewarm. The profit growth is less likely to fall to FY13 and FY14 levels given some spending by government on Seventh Pay Commission, but believing that alone and an improving CAD situation will boost corporate profit in next two years is possibly a bit optimistic.

**************