Developing a Comprehensive Earnings Management Score

It is believed that capital markets do not like (earning) surprise and hence companies systematically resort to earnings management practices to smoothen the effect of ‘surprise’. The regulatory requirements for publication of quarterly financial results have made management of firms myopic resulting in supposedly greater earnings management. While the intention of the regulator in seeking frequent financial information from listed firms was to protect investors, markets have become increasingly unforgiving of companies that miss their estimates. For example, annual earnings (profits) of Dr. Reddy’s Laboratories Ltd. (DRL) for 2016-17 was reported on 12 May 2017 at Rs. 72.61 compared to an estimate of Rs. 82.88 for the same period-, resulting in an earnings surprise of -12.4%. Market reaction was severe- the share price tumbled from Rs. 3097 in early February 2017 to Rs. 2414 on 26 May 2017- a fall of 22%. This kind of market reaction may create undue pressure on the management to ‘perform’. A popular way to avoid such severe market reaction is to manage earnings in such a way that the earnings surprise is limited and at the same time disclosures are within regulatory limits.  But why should an unlisted company manage earnings? There is no ‘market’ expectations that need to be managed for unlisted firms. The possible reasons could be institutional ownership and leverage.  A study[1] finds that firms with higher institutional holdings report better earnings quality. Foreign institutional ownership also has a negative relationship with the degree of earnings management by firms, the study reports. Another study[2] looks at the relationship between the level of corporate governance and earnings management of firms. Using a sample of 2315 non-financial listed companies, the study finds a negative association between corporate governance attributes and earnings management.  The study also observes that the relationship between institutional investors and earnings management indicated existence of a ‘short horizon’ problem. Firms with higher leverage have tendency to manage earnings to ‘delay’ any bad news to the lenders. Our study finds that managing earnings is not a monopoly of listed companies.

Experts believe that accrual basis of accounting is the source of earnings management. Historically, accountants have argued that accrual based of financial reporting enables the firm to recognize the timing of cash flows in sync with its performance, inclusion of accruals in earnings presents a more accurate portrayal of firms’ economic performance. However, accrual basis of accounting allows managers of a firm grater ‘discretion’ in reporting financial elements in the financial statements. While managers resort to income increasing or decreasing earnings management to minimize ‘shock’ or reduce cost of capital, any news of earnings management result in adverse consequences for investors. Regulators are, therefore, worried about this practice. For example, the Securities and Exchange Commission (SEC) of USA periodically reviews companies’ filings and monitors compliance with regulatory disclosure and accounting requirements. Similar practices are also followed by SEBI in India. However, whether such regulatory oversight improves earnings quality (i.e., reduces earnings management) of firms is an open question. Empirical evidence in this regard are mixed.

In 2013, SEBI released a study by its Development Research Group on earnings management[3] which examines and quantifies the extent of earnings management in India. The study looked at a cohort of 2229 listed Indian (non-financial) companies during 2008-11. The study finds that average earnings management in Indian corporate sector was 2.9% of total assets. The study also finds that small firms indulge in greater earnings management (around 10% of total assets).

Measuring Earnings Management

Earnings management ranges from ‘manipulation to opportunism’. Earnings management refers to adjustment of financial reporting numbers for managerial self-interests. Technically speaking earnings management is not illegal as the accounting principle provides the firm management to use their discretion and judgment in financial reporting. The research on accrual management focuses on separating managed accruals from normal accruals. It is not easy to identify the managed accruals. Elgers, Pfeiffer and Porter[4] mention that a ‘fundamental issue in assessing earnings management is the un-observability of the managed and un-managed components of reported earnings’. The part of the accrual normal to an industry is called non-discretionary component of accrual. Discretionary accrual refers to the difference of actual accrual and non-discretionary accrual. The use of discretionary accrual as a measure of earnings quality is widespread in the literature.  We briefly describe the methodology of earnings management.

Formally accrual can be defined as difference between accrual earnings and cash earnings. In the absence of accrual earnings both types of earnings would result in same figure. Cash earnings can be stated as

On the other hand, the accrual based earnings can be stated as,

One can express accrual as

This is the expression used in the present study to calculate balance sheet accrual (BS accrual).

Moreover, Hribar and Collins[5] point out that BS accrual is vulnerable to non-articulation events. They define non-articulation events as non-operating events such as divestiture, mergers and acquisitions and foreign currency translations.  They show that mergers and acquisitions have positive bias whereas divestiture and discontinued operation have negative bias in BS accrual. Thus they recommend measuring total accrual directly from cash flow statement. Following their methodology we calculate CF accrual as:

To estimate discretionary accrual first we have to estimate non-discretionary accrual component and then subtract the non-discretionary part from total accrual to obtain discretionary accrual. The non-discretionary accrual is computed using modified version of cross-sectional Jones model[6], where plant, purchase and equipment, change in revenue less receivable, return and cfo(operating cash flow) has been considered as control variable.(all variables are scaled by lagged total asset).

First the non-discretionary component of accrual is estimated by the following expression-

Then the discretionary accrual ratio is computed by subtracting non-discretionary component from total accrual.

This discretionary accrual measures that part of accrual which is manipulated by the management for inflating or deflating profit. Therefore, larger proportion of discretionary accruals denotes higher earnings management.

Earnings Management Score (EMS)

We have developed a proprietary earnings management score (EMS) where a higher number indicates greater earnings management.  Thus EMS quantifies the magnitude of each firm’s earnings management. The score is calculated using six variables for each firm- balance sheet and cash flow total accruals, balance sheet and cash flow discretionary accruals, the correlation between net income (profit after tax) and balance sheet and cash flow total accruals. For each year the total range of each variable is divided into six quintiles obtained from 16.66, 33.33 50, 66.67 83.33 and 100 percentile values of the variable. A firm-year observation is given a weight between 0.25 and 4 based on the following scheme:

Table 1: Weighting Scheme

Quintile Range Weight
First (<16.66) 0.25
Second (16.66- 33.33) 0.50
Third (33.33-50) 1
Fourth (50-66.67) 2
Fifth (66.67-83.33) 3
Sixth  (>83.33) 4

The above range of values is obtained for each firm twice based on its position – one at the overall level (based on 1691 companies) and again at industry level (based on number of companies in an industry). For example, a firm may have a value of discretionary balance sheet accrual at the third quintile based on the entire sample of 1691 firms and at the fifth quintile based on values of firms from the same industry. Thus for each of the 6 variables we have created two weights (one for its position at the overall level and the other for its position at the industry level). So we have 12 weights for each firm-year observation.  Finally, earnings management score is calculated following a proprietary method using the weighted variables of the six variables.

Shareholding Pattern and EMS

Our study uses data of 1691 non-financial companies, covering 37 industries, for which complete information are available from 2005-06 through 2015-16. Necessary financial data for each firm is obtained from Ace Equity database. Our results show that any EMS above 2000 indicates strong earnings management. Table 2 shows that more than 50% of firms in our sample have an EMS of greater than 2000. More than 10% of firms have EMS greater than 5000. Thus, earnings management is rampant in India.

Table 2: Frequency Distribution of EMS

Range No of companies Cumulative Frequency
0-100 120 7.09%
100-1000 221 20.16%
1000-2000 364 41.69%
2000-3000 348 62.27%
3000-4000 248 76.93%
4000-5000 188 88.05%
>5000 202 100%
Total 1691

The relationship between promoters’ holding and EMS (table 3) is not straightforward. Initially EMS increased linearly with increase in promoters’ holding (entrenchment hypothesis) and thereafter (promoters’ holding beyond 75%) EMS decreases with increase in holding (alignment hypothesis). Entrenchment hypothesis states that controlling shareholders (read promoters) entrench by managing earnings upwards as their control rights becomes greater than their cash flow rights. As cash flow rights (i.e., ownership) of promoters increase, the level of discretionary accruals of the controlled firms tends to decrease.  Alignment hypothesis suggests that the incentive for earnings management decreases as inside owners interests are aligned with interest of ‘outside’ shareholders. It is observed that beyond 30% of promoters holding, EMS is almost static till 70% and then declines. There was a sharp fall in the score beyond 75% implying thereby that promoters do not resort to much earning management when a company becomes private.

Table 3: Relationship between Promoters’ Shareholdings and EMS

Promoter Shareholdings No of Companies EMS
<1% 26 340
1-10% 17 2230
10-20% 32 2225
20-30% 118 2355
30-40% 227 2340
40-50% 296 2360
50-60% 364 2350
60-70% 286 2355
70-80% 178 2400
80-90% 46 1840
90-100% 79 1920

Results for Institutional holdings are more pronounced (Table 4). The average EMS is high when there is less monitoring by institutional owners. But once institutional holding crosses 25% (signifying some level of monitoring with voting rights), EMS decreases. Our EMS is designed in such a way that any score less than 2000 signifies lower level of earnings management which should not invite legal scrutiny.

Table 4: Relationship between Institutional Shareholdings and EMS

Institutional Shareholdings No of Companies EMS
<1% 557 2340
1-5% 312 2585
5-10% 245 2330
10-15% 189 2360
15-20% 126 2335
20-25% 83 2230
25-30% 51 1370
30-35% 42 2240
35-50% 45 1240
>50% 19 1560

Financially Stressed Firms and EMS

Some studies[7] show that lenders’ monitoring would lead to lower earnings management. Hence, firms with higher institutional (bank) debt should observe lower earnings management (discretionary accruals). The opposite view suggests that in order to avoid debt covenant violation, firms with high debt are more likely to apply discretion in its reported earnings.  Our study supports the latter view.

We have compared credit ratings of Indian firms and the EMS score (Table 5).  Median EMS of AAA rated firms in our sample is 1450 while median EMS of D rated firms is 2340. Table 5 shows a sample set of ten AAA-rated and similar number of D-rates firms and their corresponding EMS. It clearly shows that firms with financial distress (lower ratings) resort to greater earnings management to delay the bad news and perhaps to satisfy certain debt covenants.

Table 5: Credit Ratings and EMS

Panel A: EMS of AAA rated firms

Company Name Rating Rating Date Ugrade/downgrade EMS Score
Cairn India Ltd. AAA 5/13/2015 Withdrawn 0
GSPL India Gasnet Ltd. AAA 10/18/2016 Reaffirmed 0
GSPL India Transco Ltd. AAA 10/18/2016 Reaffirmed 0
Unique Estates Devp. Company Ltd. AAA 2/27/2017 Reaffirmed 0
Aditya Birla Telecom Ltd. AAA 2/19/2010 Revised 10
Gulf Oil Lubricants India Ltd. AAA 2/13/2017 Reaffirmed 10
Indian Petrochemicals Corporation Ltd. [Merged] AAA 3/16/2007 Reaffirmed 10
Mazagon Dock Ltd. AAA 10/12/2015 Withdrawn 10
ONGC Mangalore Petrochemicals Ltd. AAA 3/10/2017 Affirmed 10
Bombay Burmah Trading Corporation Ltd. AAA 4/5/2017 Reaffirmed 20
GAIL (India) Ltd. AAA 4/10/2017 Affirmed 20


Panel B: EMS of D rated firms

Company Name Rating Rating Date Ugrade/downgrade EMS Score
LML Ltd. D 12/26/2016 Reaffirmed 10100
Paramount Communications Ltd. D 9/17/2015 Suspended 8990
Hiran Orgochem Ltd. D 5/19/2011 Suspended 8880
Facor Alloys Ltd. D 2/14/2017 Reaffirmed 8210
Shreyas Intermediates Ltd. D 12/16/2013 Suspended 8110
Vimal Oil & Foods Ltd. D 12/30/2016 Reaffirmed 8000
ICSA (India) Ltd. D 11/23/2011 Downgraded 7990
Omnitech Infosolutions Ltd. D 6/8/2015 Suspended 7990
Quintegra Solutions Ltd. D 12/4/2013 Withdrawn 7990
Tecpro Systems Ltd. D 10/27/2016 Reaffirmed 7780
Refex Industries Ltd. D 5/15/2014 Suspended 6990

We have also looked at the EMS of firms experiencing various stages of financial stress using a proprietary dataset that classifies firms into three buckets- highly stressed, vulnerable, and non-vulnerable. Our results (Table 6) again supports the hypothesis that financially stressed firms resort to greater earnings management.

Table 6:  EMS and Level of Financial Distress

Classification Median EMS
Highly Stressed 3570
Vulnerable 2370
Not Vulnerable 1460

Conclusions

Opportunistic earnings management by firms is a matter of concern of regulatory authorities. Therefore, a comprehensive measure of earnings management would help regulators in identifying firms that resort to greater degree of earnings management. The difficulty in developing such a measure is that the variable (earnings management) itself is unobservable. It is easy to define the concept of earnings management. But it is extremely difficult to identify a suitable proxy for it. Experts have so far used total accrual or more popularly, discretionary accrual as a proxy for earnings management. Our study uses a list of six variables to estimate a comprehensive earnings management score.  Our study provides insights into the relationship between earnings management and shareholding pattern. Further our study shows that financially stressed firms resort to greater level of earnings management. We believe that regulators, financial institutions and even investment managers would find our EMS effective and useful.


*********

[1] Institutional Ownership and Earnings Management in India, Ravitha Ajay, R. Madhumathi. Indian Journal of Corporate Governance, Vol 8 Isue 2 pp 119-136

[2] Exploring the Relation between Earnings Management and Corporate Governance Characteristics in the Indian Context, Jaiswall Manju, Ashok Banerjee. Corporate Governance in India. A report by the Indian Institute of Corporate Affairs , Thought Arbitrage Research Institute and Indian Institute of Management Calcutta

[3] Earnings Management in India, SEBI DRG Study 2013 (http://www.sebi.gov.in/sebi_data/DRG_Study/EMiM.pdf accessed on 30 May 2017)

[4] Anticipatory income smoothing: a re-examination. Elgers, P.T., Pfeiffer, R.J. and Porter, S.L. 2003, Journal of Accounting and Economics, 35(3), pp.405-422

[5] Errors in estimating accruals: Implications for empirical research, Hribar, P. and Collins, D.W., 2002 Journal of Accounting research, 40(1), pp.105-134

[6] Detecting earnings management, Dechow, P.M., Sloan, R.G. and Sweeney, A.P., 1995. Accounting review, pp.193-225.

[7] Earnings Management and Financial Distress: Evidence from India, Khusbu Agrawal and Chanchal Chatterjee. 2015, Global Business Review, Vol 16, Issue 5_suppl pp 140S-154S

Sniff Test on the New IIP Series

The new Series of Index of Industrial Production (IIP) which was launched with the Base Year 2011-12 provided a much needed refresh to 2004-05 Series. As such, these are periodic updates which are made so that macroeconomic indices, in this case, IIP represent the goods which reflect the changes in the economy while removing goods which are no longer relevant to the economy. However the new Series is not just about swap-in of relevant goods and swap out of economically irrelevant goods.

In terms of overall construct the weight of Manufacturing Sector has gone up in the updated IIP in comparison to the old Series, while the sector weight of Electricity has come down by a comparable amount. The higher weight on manufacturing is more representative of the higher importance of private sector manufacturing in the Indian economy in comparison to sectors which are heavily regulated by the government.

The Manufacturing Sector in the New Series has 809 items as compared to 620 in the old Series. As per Ministry of Statistics and Program Implementation (MOSPI), 149 new item are added in the new Series and 120 items from the old series has been removed.

Further to improve the granularity of sectoral focus within industry, the New Series splits up Basic Goods into Primary Goods and Infrastructure/Construction Goods. This is a good move as it will give economy watchers an idea of economic activity associated with sustaining the economy.  On the other hand, tracking Capital Goods and Infrastructure/Construction Goods IIP is expected to provide a better view of Capex activity.

Changes in Methodology: Certain changes made in IIP estimation methodology makes the output of the new series difficult to compare with that of the old series. In fact prima facie, one may have to wait for more values to come out of the new series in future to conclude whether these changes in the New Series improved the accuracy of tracking economy or they replaced one set of estimation errors and data issues with another set. Of course it must be borne in mind that no macro-economic measures or indices can be error free. An improvement in methodology for estimating these measures mean lesser estimation errors than in the past. The three changes which need to be understood to appreciate the output from the new Series are explained below.

Capital Goods Related Adjustment: Capital Goods form ~8% weight of IIP (both series). Capital Goods IIP, in the past, usually caused furore among market watchers whenever it was released. The market watchers criticised the lumpiness of the Capital Goods IIP number, often neglecting the fact that this was the nature of the animal. Units of most capital goods takes more than a month to produce so there are months when the goods are not finished so the IIP is low and in months when the production is complete the Capital Goods IIP number shoots up. This is a problem, possibly, with no perfect solution. However, responding to popular (which need not always be correct) criticism in the NEW Series, the approach adopted is one of calculating a measure called Operating Work-in-Progress (WIP) of Capital Goods. In fact companies use this type of accounting treatment to capture the value of unfinished capex or capital goods manufacture in their annual balance sheet. Companies calculate WIP typically once a year but at a company level. Larger well established companies may track WIP quarterly but mostly for internal purposes. It is difficult to conceive how mid-sized to small companies will calculate this on a monthly basis that too at a factory level to furnish the data for IIP estimation. So possibly the ‘volatility’ in capital goods IIP will be reduced but the jury is still out on whether there will be a qualitative improvement in the information content of the capital goods IIP.

 Monetary Value of Production: IIP is expected to measure physical volume of output in an economy. However for certain products the volume is difficult to measure, in such cases the monetary value is considered and further processed to estimate the ‘real value’ which is taken as a proxy for volume. The monetary value is deflated by the relevant inflation measure to estimate ‘real’ production. Despite such adjustments, empirically it is observed that a rising inflation tends to benefit IIPs to the extent it has high component of ‘monetary value’ measure. In the new series production value for 109 items will be measured by monetary value (deflated by WPI). This number was 53 in the previous series.


Factory Frame: The new Series has a higher number of factories mostly to account for the additional new items. The Working Group for Development of Methodology for Compilation of All-India Index of Industrial Production with Base Year 2009-10/2011-12 suggested that apart from the factories covered under Annual Survey of Industries (ASI), factories covered by other sources may also be added to the New Series. As such measures, such as IIP, globally replaces closed factories with functioning factory but during the transition period the loss in production gets reflected in the IIP number. However when a new series is launched because of inclusion of stronger companies which remains open for most years around base year the production trend may be more positive for these selected factories than for rest of the economy where factories close down regularly. This may be among the reasons of why the new IIP growth is consistently above the previous series.

Some Expected Difference, Some Explained Difference: While the MOSPI clearly states that the two Series are not strictly comparable, a comparison between the two series may still be done to find out how our understanding of the economic performance for the last five years needs to be re-calibrated.

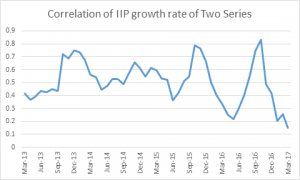
The new series shows higher growth than the old series in three-fourth of the months since April 2012 till date. The new series includes items which are actively produced as opposed to previous series where some items were hardly produced in any scale and this phenomenon may partly explain the higher growth numbers. However what becomes difficult to explain is why the growth trends are significantly diverging in the two series particularly from December 2015 till March 2017.

The author estimates approximately two-third of the weightage in the New Series is attributable to items which were common to the old series. Thus one may assume that there would be a high positive correlation between the two series- which has actually been the case till Dec 2015..

However, post 2015 that there is a sharp fall in correlation between the two Series as shown by the divergent trends. Given the disclosed information there is no clear explanation of this observation.

The Sniff Test of the New IIP Series:

The New Series adds factories from Department of Industrial Policy and Promotion ( DIPP) over and above factories identified under ASI. As such for our Sniff test we have taken the ASI survey (the latest one) and compared it with the annual average IIP( New Series) for the three years for which ASI data is currently available. As per the New Series the IIP growth has improved sequentially between 2012-13 and 2014-15

Median IIP Growth -Annual (%)
2012-13 2013-14 2014-15
2011-12 1.9 3.4 4.1
2004-05 0.25 -0.9 3.2

As per ASI, during those same years growth for most parameters has either fallen sequentially or has shown some improvement in 2013-14 and nose- dived in 2014-15.

Growth Rate of Select Parameters From Annual  Survey of Industries
2012-13 2013-14 2014-15
NUMBER OF FACTORIES 2% 1% 3%
TOTAL PERSON ENGAGED -4% 5% 3%
FUELS CONSUMED 10% 12% 0%
MATERIAL CONSUMED 5% 8% 3%
VALUE OF OUTPUT 6% 9% 5%
STOCK OF SEMI FINISHED GOODS -31% 17% -45%
STOCK OF FINISHED GOODS 10% -56% -9%

Of course it is possible that the factories identified in DIPP have performed exceptionally well and thus when aggregated with factories identified by ASI, the overall output shows an improvement. Clearly more disclosures are required from MOSPI to help everyone understand the trend shown by the new IIP Series.

Share Buyback and Indian IT Firms: Any Signal?

Seven software companies in India have either announced or discussed buyback of shares programme within a span of 45 days, between 31 January 2017 and 15 March 2017. Excepting one company (Mindtree), others have also declared the size of buyback totaling US$5.8 billion. The seven companies have more than US$23 billion in cash, cash equivalents and short-term investments. Therefore, the proposed buyback amounts to 30% of the free cash available with these companies. TCS has announced India’s biggest buyback offer till date (Rs. 160 billion) surpassing Reliance Industries Ltd’s buyback offer of Rs.104 billion in 2012. The buyback price of Rs.2850 represents a 13.7% premium to the closing share price of 20 February 2017 when the announcement was made. The buyback will involve 2.85% of the company’s outstanding shares. Interestingly Tata Sons, the holding company, has decided to participate in the buyback of TCS shares. Tata Group owns 73% of TCS and hence if the holding company does not participate in the buyback, the promoter group may reach closer to 75% mark endangering listing of TCS in the exchange. Legal technicalities apart, participation of a holding company in any buyback programme sends a wrong signal to the market.

Reports suggest that the Board of Wipro is seriously considering distributing 25-30% of its free cash reserve to its shareholders. Wipro had a free cash reserve of US$3 billion in March 2016 which grew to US$4.9 billion in December 2016.  The expected buyback size is US$1.25 billion. This is in addition to the interim dividend of about Rs. 500 crore (US$75 million) declared by the company in January 2017. Cognizant, the US-based Nasdaq-listed company, had announced in January 2017 its decision to return US$3.4 billion cash to shareholders over next two years through dividend (US$0.7 billion) and buyback (US$2.7 billion). The company has free cash reserve of US$5.3 billion as on 31 December 2016.

Responding to the pressure of select founders, Infosys is likely to soon announce share buyback to the tune of US$2.5 billion. Infosys has more than US$5 billion of free cash and hence the expected buyback would consume almost 50% of the cash reserve of the company. However, Infosys has no plans to implement the buyback programme before 2018. If approved, this will be Infosys’s first share buyback programme. One may note that in the recent past there was a bit of tension between the founders and the Board of Infosys on issues of severance pay to the CFO of the company and compensation for the CEO. Founders presently hold about 13% of the company.

HCL Technologies has announced a share buyback programme to the tune of US$500 million. It represents 2.45% of paid up equity capital of the company and about 14% of the consolidated equity of the company. HCL has cash reserve of close to US$1.9 billion. The proposed buyback at Rs. 1000 per share reflects a premium of 15% to the closing price of the share on the day before the announcement. Mphasis has obtained shareholders’ nod for its buyback programme of US$200 million, which is 8.2% of the paid up capital of the company. Similarly, Mindtree is also going to announce its buyback programme soon.

Signalling

Buyback is typically used to return free cash flows to shareholders. Announcement of share buyback, therefore, sends several signals. First, large distribution of cash reserves indicates that a firm may not have immediate profitable investment opportunities and thus allowing its investors opportunity to earn better return on their investments. Second, it indicates confidence of the company to replenish its cash reserve quickly after buyback with insignificant negative impact on the net earnings (profit) of the firm. Third, it may also signal lack of confidence on the part of management in facing future uncertainties. For example, in view of severe restrictions imposed by the US on H1B visa the Indian IT firms fear substantial drop in business volume from USA. If a software firm in such a situation announces share buyback, it may send a signal that the firm is unsure of its future and therefore wants to keep its shareholders happy by way of share buyback.

It is clearly evident (Table 1) that these software firms were earning suboptimal returns on their free cash (yield on free cash is very low) and hence their decision to return the cash to shareholders is justified. It is also noticed that the firms, due to very nature of their business, need little investment in real assets (capital expenditure) and hence distribution of large cash to shareholders would not materially affect the business. Experts believe that the recent developments in the US have provided an opportunity to the Indian firms to revisit their strategy and tweak their model away from labour-intensive low-margin business. These firms have to explore opportunities in the area of artificial intelligence, machine learning and cognitive analytics much of which are outside the present domain of these entities. Indian firms need to adopt the ‘acquisition’ route to quickly get into these new areas of high-margin business. Inorganic growth requires availability of cash reserve. The leading software firms (Table 1) have already distributed more than US$9 billion in the past three years by way of dividend and still hold more than US$20 billion of cash and short-term investments. This implies that proposed buyback offers of the seven companies would not compromise with the long-term business objective of these firms. The only challenge it to learn how to identify potential candidates for acquisition.

Table 1: Free Cash Flow Usage 2016 2015 2014 Total
TCS
Net Capex 225.02 1703.33 1621.86 3550.21
Cash and Cash equivalents 28827.1 19746 15649.5
Cash Dividend 8571.38 15473.87 6267.33 30312.58
Yield of free cash 6% 8% 8%
Cognizant Technology Solutions
Net Capex -530.78 -365.67745 25.241504 -871.213
Cash and Cash equivalents 35,137.00 32,778.96 23,865.54
Cash Dividend 0 0 0 0
Yield of free cash 2% 2% 2%
Infosys
Net Capex 1,193.00 1,073.00 1,389.00 3655
Cash and Cash equivalents 29,178.00 28,471.00 26,849.00
Cash Dividend 5570.00 5111.00 3618.00 14299
Yield of free cash 9% 9% 8%
Wipro
Net Capex 189.50 95.50 (66.40) 218.6
Cash and Cash equivalents 21,139.00 20,131.30 16,394.10
Cash Dividend 1482.30 2963.60 1973.60 6419.5
Yield of free cash 10% 8% 8%
HCL Technologies
Net Capex 368.51 759.37 114.36 1242.24
Cash and Cash equivalents 11852.90 9999.80 4204.30
Cash Dividend 2251.74 2385.59 700.27 5337.6
Yield of free cash 5% 8% 13%
Mindtree
Net Capex 26.10 97.80 71.10 195
Cash and Cash equivalents 402.50 901.20 633.50
Cash Dividend 176.20 142.40 104.10 422.7
Yield of free cash 4% 2% 1%
Mphasis
Net Capex 23.83 9.13 -0.41 32.55
Cash and Cash equivalents 1388.51 944.73 1032.91
Cash Dividend 0.00 336.23 147.13 483.4
Yield of free cash 4% 5% 1%


Source: Ace Equity and Bloomberg. Figs in Rs. Crore unless mentioned otherwise

Net Capex= Capital expenditure-Depreciation

Shareholder Activism

Another reason for a company to announce share buyback could be the pressure of shareholders.  Promoters majorly control the equity ownership of most of the software companies in India. Cognizant Technologies, which is a US-based company, is an exception where investment and hedge funds hold major shares (Table 2). One may wonder why all these seven companies announced share buyback this year?  Wipro, of course, had declared another buyback in the recent past. The reason could be pressure from the institutional investors. For example, foreign portfolio investors are known to exert pressure on companies to distribute cash to shareholders. It is observed that foreign portfolio investors held 40.24% of Infosys shares, 26.94% of HCL’s and 10.93% of Wipro’s in 2016 and these group of shareholders did not hold any shares of these companies in 2015 or earlier. Empirical evidence suggests that shareholders often put pressure on firms to distribute idle cash, which is not earning optimal returns. Such active shareholders always demand a transparent capital return policy. For example, Elliott Management, which holds 4% stake in Cognizant Technology Solutions (CTS), demanded a $2.5 billion share buyback, interim dividend and a shakeup in management of the company to improve profitability. Incidentally, CTS has never paid any dividend since its inception. Similarly in 2014 two former chief financial officers and a serving board member of Infosys had formally written to the board of the company demanding share buyback worth US$2 billion. Generally shareholders of IT firms in India were not happy with the returns over the past three years and believed that buyback may boost the share price and hence value of their investment.

Table 2: Shareholding Pattern 2016 2015 2014
TCS
Promoters 73.42 73.9 73.9
Institutions 22 21.64 21.47
Public (Non-Institutions) 4.58 4.46 4.64
Cognizant  Technology Solutions
Investment Advisor 83.64 88.73 84.74
Institutions (incl hedge fund) 13.51 9.09 13.05
Public (Non-Institutions) 2.85 2.18 2.21
Infosys
Promoters 12.75 13.08 15.94
Institutions 57.69 53.06 55.76
Public (Non-Institutions) 28.58 17.66 12.2
ADR 0.98 16.2 16.1
Wipro
Promoters 73.34 73.39 73.47
Institutions 16.18 15.07 13.62
Public (Non-Institutions) 9.93 9.58 10.97
ADR 0 1.96 1.94
HCL Technologies
Promoters 60.38 60.58 61.64
Institutions 32.63 33.45 32.58
Public (Non-Institutions) 7 5.97 5.77
Source: Ace Equity. Figures in percentage


Market Reaction

The IT firms had three choices with regard to their capital return policy: (a) do nothing (i.e., retain the free cash), (b) distribute the free cash as a special dividend, and (c) share buyback. Table 3 shows the implications of these three choices.

It is assumed that if every firm does nothing with existing free cash, the share price would not change and the price shown is the share price on the date of announcement of buyback. Further, the special dividend is assumed to be equal to the size of buyback announced or discussed. The ex-dividend price is estimated by deducting dividend per share from the share price under ‘retain cash’ option. Loss of income due to use of free cash (equivalent to yield of free cash multiplied by the proposed buyback size) is deducted from earnings estimates for dividend and buyback options.

Table 3 Share Price (Rs.) 2018 Earnings
(Rs. million)
Number of Shares (million) EPS
(Rs.)
DPS (Rs.) #shares repurchased (million)
TCS            
 Retain Cash 2502.2 283721.9 1970.4 144.0 0.0
Special Dividend 2430.9 275535.4 1970.4 139.8 71.3
 Repurchase Shares 2489.9 275535.4 1914.3 143.9 0.0 56.2
One-week Market Reaction -1%
Cognizant Technology (figs in USD)            
 Retain Cash 57.4 2227.7 607.0 3.7 0.0
Special Dividend 53.0 2173.7 607.0 3.6 4.4
 Repurchase Shares 58.0 2173.7 560.0 3.9 0.0 47.0
One-week Market Reaction -1%
Infosys            
 Retain Cash 936.5 155847.7 2296.9 67.9 0.0
Special Dividend 930.2 141461.7 2296.9 61.6 6.3
 Repurchase Shares 981.8 141461.7 2118.1 66.8 0.0 178.9
One-week Market Reaction 5%
Wipro
 Retain Cash 488.6 91861.1 2470.7 37.2 0.0
Special Dividend 454.7 83725.0 2470.7 33.9 33.9
 Repurchase Shares 495.1 83725.0 2299.3 36.4 0.0 171.4
One-week Market Reaction 2%
HCL Technologies
 Retain Cash 842.9 89700.3 1410.4 63.6 0.0
Special Dividend 818.4 87825.7 1410.4 62.3 24.5
 Repurchase Shares 864.4 87825.7 1375.8 63.8 0.0 34.6
One-week Market Reaction 2%
Source: Bloomberg for consensus estimates of earnings for 2018

It is observed that earning per share (EPS) would not increase in most of the cases after buyback. The market reaction, based on share price change in one week after the announcement of buyback), has been positive in three out of five cases. Market reaction is estimated as excess return over NIFTY (NASDAQ in case of Cognizant). Thus, there is no guarantee, as some shareholder activists argue, that share buyback would improve EPS and share price. Buyback should be used more as a signalling mechanism.


*********


The author acknowledges data support provided by Ms. Leesa Mohanty, a Post-Doctoral Research Fellow at IIM Calcutta.


Macroeconomic Perspective of India’s Union Budget 2017-18

The Union Budget 2017-18 (UBFY18), in general, appears composed on its proposals except for some concerns related to banks’ recapitalization and passive private investment. The proposal positivity lies in its fiscal prudence (despite minor divergence of 0.2% up against mandated 3.0% under Fiscal Responsibility and Budget Management Act: FRBMA by 2017-18) and adherence to past commitments despite pressures generated from slower economic growth. Other attractive features of the UBFY18 are pursuance of digital economy, emphasis on infrastructure development, revival of rural economy (including affordable housing for the poor /underprivileged) and effort of simplification in the tax regime. The sharp rise in budgetary allocation on capital expenditure signals the government’s strong willingness to revive economic activity through public spending and generating crowd-in effect for private investment.

Given the structure and composition of rural economy in the overall Indian economy (due to its high demographic dependence albeit weakest contribution share), the budget proposal of doubling farmers’ income by 2022 seems to be catalyzing event for the rural economic activity. The government proposes agricultural credit of Rs 10 lakh crore for farmers and 60 days of interest waiver apart from strengthening of functional primary Agricultural Credit Societies network in next 3 years through NABARD at a cost of Rs 1900 crore. The UBFY18 stresses on further expansion of ‘Fasal Bima Yojana’ (up to coverage of 50% in FY19), more Krisi Vigyan Kendras (for coverage of soil sample testing with 100% coverage), irrigation network (including micro-irrigation) and national agricultural market (e-NAM: from existing 250 to 585 APMCs). The corpus for dairy processing and infrastructure development has been increased from Rs 2,000 crore to Rs 8,000 crore.

The government has proposed an annual allocation of Rs 3.0 lakh crore (grant-in-aid) for rural areas for providing basic infrastructure and employment through capital creation such as PMGSY roads, farm ponds and rural housing. The MGNREGA schemes also get all-time high allocation of Rs 48,000 crore in FY18 budgetary proposals. Another attraction of the UBFY18 is a proposal to construct 1 crore rural houses by 2019 (with budgetary allocation of Rs 23,000 crore). Target of 100% village electrification (by May 1, 2018) and skilling 5 lakh persons (by 2022) are other important budgetary proposals. The extension of safe drinking water network under National Rural Drinking Water Programme to 28,000 habitations in the next four years is another attractive rural welfare proposal. The government also proposes legislative reforms for existing labor laws on four codes of wages, industrial relations, social security and welfare and safety and working conditions. Any progress on these fronts could prove to be a positive support to the Indian rural economy in terms of better infrastructure and higher employability.

Despite high expectations from the budget, the government managed to keep budgetary proposals balanced except for marginal incentives in personal tax rates reduction, by slashing minimum tax rate from existing 10% to 5% for the lowest income bracket (up to Rs 5 Lakh) of tax payers. Although this proposal would generate downward pressure on personal tax collections due to its scale (under-reporting) linkages, any improvement in tax compliance in this income group under pursuance of digitalized economy after demonetization may neutralize the loss and has capacity to bring more positivity through multiplier effect.

An imposition of 10% additional surcharge on annual income higher than Rs 50 lakh to Rs 1 crore seems as a loss-mitigating move. The proposal of 5% reduction in corporate tax for MSMEs with turnover up to Rs 50 crore to 25% is a welcome step especially for manufacturing industry, (under ‘Make in India’ programme), given their dominance in the overall production profile. This proposal is an incentivizing step for MSMEs for greater entrepreneurial exploration on one hand, while a great positive proposition in creating of more jobs (for low skilled labor force) through cost reduction and diversifying product profile. The loss in corporate tax collections due to this reduction can be mitigated through better tax collection prospects on account of improvement in economic activity and employability.

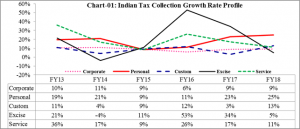
The analysis of government’s financial proposal, shows that government’s receipts would grow at 9.7% (a 4-year high) to Rs 21,21,046 crore in FY18, particularly on high growth  of capital receipts (12.3%) along with high-base effect growth in revenue receipts (6.5%, a six-year lower growth projection) displaying incorporation of adverse impact of slower economic growth expectations. Although relatively slower growth expectation in excise duty (5.0% in FY18 against 34.5% in FY17) and service tax (11.1% against 17.1%) collection reflects impact of tax relief to MSMEs and service providers for digitalization acceptance, higher growth projection for personal income tax (24.9% against 22.8%) appears strongly based on assumption of broadening in tax base on scale.

However slower growth in budgeted expenditure (6.6%) seems to be realistic despite fiscal pressures generating from implementation of due installments of OROP scheme and ongoing social welfare expenditure, particularly on account of reduction in systemic leakages. The same can be observed from relatively slower growth in revenue expenditure (5.9%: BE in FY18 against 12.8% in FY17) than that of capital expenditure (10.7% against 10.6%) reflecting government’s seriousness in capital creation especially in infrastructure sector (railways, roads and ports). The sharp rise of 28.7% in the FY16’s capital expenditure (including grants for creation of capital assets) shows the government’s commitments of capital creation through various governmental channels.

As net market borrowing through government securities is projected marginally higher at Rs 3,48,226 crore (BE) in FY18 compared to Rs 3,47,219 crore (RE) in FY17, showing relatively better position of the government’s finance despite higher allocation on expenditure budget. Hence this budgetary proposal is expected to keep interest rate pressures under check, particularly due to stable domestic macroeconomic factors and limited exposure to external risks. Higher buyback/switching plan (Rs 1 Lakh crore) and Ways & Means inflows (Rs 3 Lakh crore) may create downward borrowing pressures through expectation channel and thus lower interest rate expectation. The same can be observed from relatively lower average 10-year benchmark G-Sec yield (7.00%) during April’16 – February’17 compared to 7.79% in FY16. Although excess systemic liquidity, lower domestic policy rate and a decline in SLR requirement (20.5% from 20.75%) would keep G-Sec yields range-bound in a narrow corridor in the next fiscal year; any quicker winding up process of excessive accommodative monetary policy in advanced economies may generate some short-term upward pressure.

Table-01: Market Borrowing, Outstanding G-Sec, Liquidity (Re Crore) and Interest Rate Profile
Market Loans Outstanding

G-Sec Amount

Average Daily
F-Year Gross

Market Loan

Net

Market Loan

Net LAF Liquidity

(+ Variable LAF)

10Y Benchmark

G-Sec Yield (%)

2011-12 509796 436211 3808417 -79947 8.370
2012-13 558000 467356 4456263 -85084 8.156
2013-14 563675 468668 5116974 -89167 8.397
2014-15 592000 453075 5799353 -76707 8.305
2015-16 585000 440608 4566630 -76092 7.786
2016-17: RE 582000 406708 4943644* 51424* 7.006*
2017-18: BE 580000 423226
Source: Union Budgets, RBI, CCIL & Researcher’s Work

(*  April – February 2016)

However, meager allocation (Rs 10,000 crore) for the PSU Bank’s recapitalization appears disappointing despite sharp rise in deposits after demonetization. However the 1 percentage point rise in provisioning for NPA gives some relief to banking industry due to its lower tax liability linkages, though lending constraints are still a big drag behind slower credit growth.

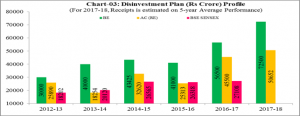
Despite robust macro-economic stability, the disinvestment target including strategic disinvestment appears overestimated given the preceding years’ performance averaging around 69.86% (5-year average) of the budget estimate. For FY18, the government proposed total disinvestment target (including strategic disinvestment) of Rs 72,500 crore, 28.3% higher than Rs 56,500 crore (BE) in FY17 and 59.3% higher than Rs 45,500 crore (RE) in FY17. However disinvestment decision would also depend on the performance of stock market for better pricing. Currently stock market is relatively better positioned, but lower real GDP growth expectations (6.75% – 7.5%) in FY18 and global uncertainty related to crude oil pricing, protectionist pressures on global trade and outward pressures on capital flows may keep Indian stock market range-bound.

The budgetary proposal of fiscal deficit profile looks good under all four major fiscal deficit indicators with falling trends, signaling government’s adherence to fiscal discipline despite sharp rise in capital expenditure and modest rise in revenue expenditure demonstrating government’s success in reducing systemic leakages in social welfare schemes through broadening of the direct benefit transfer net. The government should be given credit for its fiscal management approach particularly on front of slower growth in subsidy and reduction in systemic leakages.

Table-02: India’s Deficit Profile (as % of GDP)
F-Year Primary Deficit Revenue

Deficit

Effective

Revenue Deficit

Fiscal

Deficit

Current

Account Deficit

2011-12 2.70 4.40 2.90 5.70 4.20
2012-13 1.80 3.60 2.50 4.80 4.80
2013-14 1.10 3.10 2.00 4.40 1.70
2014-15 0.90 2.90 1.90 4.10 1.30
2015-16 0.70 2.50 1.60 3.90 1.20
2016-17: RE 0.30 2.10 0.90 3.50 1.00
2017-18: BE 0.10 1.90 0.70 3.20
Source: Union Budgets & RBI

Intuitively prudent fiscal policy and sustainable debt path is the principal macro-economic anchor of the overall economy. In proposed budget, the government sticks to fiscal prudency albeit with a marginal rise (0.2%) in fiscal deficit / GDP ratio to 3.2% in FY18 against mandated 3.0% under the FRBMA. However, the government should be given credit for its fiscal discipline, provided intensified uncertainty in domestic economy (over demonetization impact, lower capital inflows expectation) and global economy (quicker hike in the US Fed Rate on account of rising inflationary pressure; uncertainty around commodity prices and protectionist pressures on global trade). These uncertainties with sluggish private sector investment and higher public expenditure may generate upward risk in fiscal discipline and consequently make fiscal deficit target little bit doubtful. The same can be observed from government’s escape clause under assumption of ‘far-reaching structural reforms in the economy for deviation of 0.5% from stipulated fiscal target for next three years – which can be interpreted as risk factor of unanticipated fiscal implications including macroeconomic conditions and political scenario in the coming years.

In the proposed budget, the overall subsidy is projected to grow 4.53% largely due to rising pressure from food subsidy – which is expected to grow at 7.52% despite good harvest and lower food prices. Although the government succeeded in keeping fertilizer subsidy with its budgetary target by making fertilizer ‘Neem-coated Urea’ and limiting its leakage to industrial production, the expectation of lower petroleum subsidy (-9.2% to Rs 25000 crore) is less likely due to rising crude oil prices and sensitivity to complete pass-through to end-consumers under political pressures. With growing coverage of National Food Security programme across different states, the food subsidy appears under-estimated and also depends on progress of monsoon next year. However any improvement in the direct benefit transfer on this account may keep the food subsidy target within achievable range.

Table-03: India’s Subsidy Profile (Rs Crore)
F-Year Food Fertilizer Petroleum Interest Misc. Total
2011-12 72823 67199 68481 5791 2002 216297
2012-13 85000 65974 96880 7968 2493 258315
2013-14 92000 67339 85378 8137 5148 258002
2014-15 117671 71076 60269 7632 5634 262282
2015-16 139419 72415 29999 16730 5542 264106
2016-17 : RE 135173 70000 27532 19425 8356 260485
2017-18 : BE 145339 70000 25000 23204 8733 272276
Source: Union Budgets          

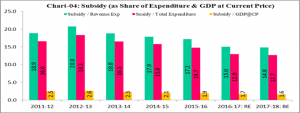
Other ratio measures of the subsidy profiling – Subsidy/Revenue Expenditure, Subsidy/Expenditure, Subsidy/GDP@CP (current price) show significant contraction in the overall subsidy in last five years, showing decline in systemic leakage in fertilizer subsidy and food subsidy and complete pass-through of petrol/diesel prices to consumers apart from holding benefits of lower crude oil prices in the current fiscal year. Despite further expansion in providing subsidized LPG (cooking gas) connection to poor households, the trend decline signals better subsidy management.

Another pressure on central government’s fiscal position arises from sharp rise in pension allocation covering increasing pensioners on scale (rise in pension under OROP) and scope (wider pensioned society). In the FY17, the pension allocation rose hugely by 33.9% to Rs 1,28,166 crore (RE) from Rs 95,731 crore in FY16 and 3.9% higher than budgetary allocation of Rs 1,23,368 crore in FY17, indicating first two installment of ‘OROP’ scheme drove the pension expenditure sharply up.

However, the government’s projection of 2.37% higher budgetary allocation to Rs 1,31,201 crore for FY18 seems to be underestimated because of two due installments of OROP and rising scale pressures from revised pay under 7th Pay-commission. The average upward pressures over budgeted estimate in pension expenditure is estimated around 1.08 times higher in last five years. The pension/expenditure ratio (6.6% in FY18 against 6.4% in FY17) displays rising pressure on government’s expenditure.

India’s current inflationary (CPI) outlook is stable and comfortable (around 3-year low of 3.17% in January’17) within the target range of monetary policy. However, this easing of inflationary pressure was largely attributed to lower food prices and weaker sentiment in housing sector. But the sharp rise in WPI inflation in recent months (a 30-month high of 5.25% in January’17, after a 17-month stay in deflationary domain) is sufficiently signaling the possibility of sharp upward pressure in the CPI inflation in coming months.

This expectation may also transmit to interest rates in coming months, reflecting from the recent rise in 10-year benchmark G-Sec yield by around 45 basis points in February’17. Any pick up in global risk profile may further put upward pressures on the interest rate trajectory. The divergent trajectories of WPI inflation and CPI inflation in January 2017 strengthens signals of bottoming out possibility of lower CPI inflationary and higher inflationary expectation ahead. The RBI’s change in its policy stance from accommodative to neutral (rationalizing on rising overall global risk profile and possibility of upward pressures on inflationary expectation (4.5% – 5.0% in H1:FY18) in coming quarters), also affirms the same. In that scenario with objectivity of inflation targeting, any rise in Indian monetary policy rate in near term is less likely, but can’t be neglected completely towards the end of 2017-18.

The government proposed further liberalization of FDI policy through structural reforms includes abolition of Foreign Investment Promotion Board (FIPB) and integration of spot market and derivatives market in the agricultural sector for commodities trading. A mechanism of streamline institutional arrangements for resolution of disputes in infrastructure related to construction contracts, PPP and public utility contracts. The budget also proposes exemption of foreign portfolio investor (FPI – Category I & II) from indirect transfer provision, but kept redemption of share or interest rate outside this provision.

With objective of further pursuance of digital economy, the government restricted cash transactions up to Rs 3 Lakh and above this amount, only digital mode of transaction would be permitted. The government is also promoting usage of BHIM Application for fund transfer / payment through incentivizing Referral Bonus Scheme for individuals and a Cash-back Scheme for merchants. The government proposes to set a target of 2500 crore digital transaction for FY18 through other digital modes including UPI, USSD, Aadhar Pay, IMPS and debit cards. The government also proposes lower income consideration for medium tax payers (with business turnover up to Rs 2 crore) at 6% (against 8% of total cash turnover) in case of digital transactions. To strengthen payment infrastructure and keep transaction transparency, the government proposes to create a Payments Regulatory Board in the RBI by replacing the existing Regulatory Board for Payment and Settlement Systems.

The Union Budget 2017-18 looks a good balance between resources and constraints provided stable and sound domestic macroeconomic conditions and discounting short-term external risk. The greater emphasis on recovery and revival of rural economy through basic infrastructure developments like road connectivity, rural housing clusters, time-bound electrification of rural villages and providing drinkable water through pipelines is one of its biggest takeaways. Although this proposal has capacity of massive job creation and improving rural livelihood along with limitation over migration, the expectation of positivity depends on rational and faster implementation of these programme.

Another positive part of budgetary presentation is about electoral funding reforms: maximum cash donation of Rs 2000/- per person, proposal of amending RBI act to enable the issuance of electoral bonds and filing of Income Tax-return within the prescribed time (if implemented successfully, would bring transparency in socio-politico life) and hence improve policy effectiveness. Another major proposal of the budget was removal of plan and non-plan classification of expenditure profile that facilitates a holistic view of fund allocation.

*******


Budget 2017: Any Good News for Startups?

Promoting startup is a national priority. Recently, a newspaper report mentioned that a major steel company is contemplating an investment of Rs. 3000 crore in West Bengal that will generate an expected employment for 3000 people in the state- that translates to Rs.1 crore investments to create one job. A similar investment in startups and SMEs would definitely create at least five times more jobs. In order to offer enabling ecosystem to startups, three things are essential- providing reliable net connectivity in rural India, facilitating digital transactions and access to risk capital. The Union Budget of 2017 provides necessary incentives for enhancing net connectivity and encouraging digital payments. For example, section 44AD of the Income Tax Act is amended to lower the presumptive income for small and unorganized businesses (with annual turnover up to Rs. 2 crore) to six percent from the present eight percent only in respect of the amount of such turnover or gross receipts (out of Rs. 2 crore) received by account payee cheque/draft or net banking facilities.  Thus, if a small trader receives 60% of her sales through bank and rest in cash; the presumptive income for tax purpose would be 6.8% of turnover.

The Union Budget (Budget) of 2016 announced a number of significant concessions/schemes for the startups. Five important announcements in Budget 2016 were: (a) 100% tax exemption in three consecutive financial years out of initial five years of incorporation of the startup; (b) abolition of angel investment tax; (c) setting up of ‘fund of funds’ for startups of up to Rs. 10,000 crore over a four year period; (d) lowering long-term capital gains for unlisted firms from three to two years so that sale of shares by unlisted firms beyond 2 years do not attract capital gain tax; and (e) allocation of Rs. 500 crore for SC/ST and women entrepreneurs. However, there was a catch. In order to avail above tax exemptions and benefits, a startup needs to satisfy conditions stipulated by the Department of Industrial Policy and Promotion (DIPP). Were the above incentives enough to significantly increase startup movement in India?

If one looks at a few countries and the government’s support for startups, one would note that India could do much more to promote entrepreneurial culture in the country. So, the expectation in Budget 2017, presented on 1 February 2017 in the Parliament, was much higher. Did Hon’ble Finance Minister meet the expectations? We would try to answer that question in this article. But before analyzing Budget 2017, let us look at government initiatives in two countries (other than USA) which are known for promoting startups.

Government Support in Singapore

Funding and other concessions initiated by various government agencies include five major areas- (i) equity funding scheme (where the government co-invests with a private third-party investor in early stage of a business); (ii) cash grants (cash grant can vary between S$50,000 and S$ 300,000); (iii) business incubation scheme (to provide support to recognized incubators and also provide seed money to startups incubated by the recognized incubators- this is very similar to the schemes of the Technology Development Board (TDB)and  National Science and Technology Entrepreneurship Development Board (NSTEDB) of Government of India); (iv) Debt-financing schemes (availability of micro-credit of up to S$100,000 and SME credit of up to S$15 million at a concessional rate); and (iv)  tax incentive schemes (full tax exemption up to S$100,000 taxable income,  tax at 8.5% for next S$200,000 of taxable income in first three years and thereafter taxable income up to S$300,000 will be taxed at a concessional rate of 8.5%- which is 50% of the marginal corporate tax rate. Additionally, accelerated depreciation is available for expenditure incurred towards R&D, Intellectual Property Registration, IP acquisition, and design).

Government Support in Israel

Israel is home for new technology startups. An estimate[1] shows that more than 1400 new technology startups were created in 2015 alone.  The country spends more than 4% of GDP in civilian R&D. A startup, subject to conditions, is entitled to a preferred tax treatment (9% against the marginal rate of 16%). In addition, such an enterprise is entitled to investment grant, accelerated depreciation and reduced dividend distribution tax. Various incentive schemes have bias towards R&D focused enterprises. The national pre-seed grant (Tnufa programme) of up to $65,000 is available to individual inventors and nascent startup companies. Government-sponsored technology incubators programme provides funding up to $680,000 to each startup in addition to infrastructure facilities and mentorship support. Generous grant is also available for applied academic research in biotechnology and nanotechnology without any requirement of royalty payments to the government.


Announcements for startups in Budget 2017

Key highlights of this year’s budget so far as startups are concerned include:

Increase in the tax exemption period: The budget offers 100% direct tax exemption for three consecutive years out of initial seven years- thus a startup now gets two more years to avail the tax benefit. This provision will be effective from the assessment year 2018-19. The argument for such extension of time is that startups hardly make profits in initial years and hence if startups have to setoff the losses in first five years, very few would be able to enjoy the tax benefit.  Is the two-year extension sufficient? What happens thereafter? If startups have to pay tax at marginal rate immediately after setoff benefits, it would cause great hardship, as profits would still be lower. It is better to offer a lower rate of income tax during the first decade of a startup. We have precedence in this respect- Indian IT companies enjoyed 100% tax holiday for many years and thereafter paid MAT(Minimum Alternate Tax) for a few years.  The government is serious in pursuing its startup India policy and it would make immense sense if startups were provided a greater time window to pay tax at the full rate.  It may be mentioned here that the reduction of corporate tax rate from 30% to 25% for MSME (Micro, small and Medium enterprise) sector is a praiseworthy step. Therefore, a more generous tax scheme for startups was expected. Two-year extension of exemption period is good but not enough.

Amendment of Section 79 of the Income Tax Act: In order to carry forward and set of losses as mentioned above, section 79 of the Income Tax Act had a restrictive clause- the promoters of the startups, which are privately held, should hold at least fifty-one percent of the voting right. This provision had created a major hurdle in raising significant funds in the initial years when a startup reports loss despite growth in topline.  Promoters could not dilute their stake beyond forty-nine percent and many funders considered this restriction as a major hurdle in gaining controlling stake in startups. Budget 2017 makes necessary amendment in section 79 removing the restriction on the promoters to hold minimum fifty-one percent stake.  Budget 2017 only requires that in order to avail the carry forward and set off benefits of losses in the initial seven years, the promoters of any startup should continue to hold shares without any minimum threshold.

Capital Gains on Transfer of Shares:  The capital gain is generally computed by taking the difference between full value of the consideration received on transfer of a capital asset and cost of such capital asset. In case of listed companies, the value of the consideration is normally at or above the market price of the asset. However, it is found that in case of unlisted companies, the consideration received/offered could be lower than the fair value (estimated using recognized valuation methods) of assets (e.g., shares). A new section 50CA of the Income Tax Act would now provide that where consideration for transfer of share of an unlisted company is less than the fair market value (FMV) of such share, the FMV shall be deemed to be the full value of the consideration for the purpose of computing capital gains. This is a good move and will ensure that startups get fair value of their shares when they raise funds from Venture Capital (VC) or Private Equity (PE). Whenever any startup seeks to raise funds against shares, it needs a valuation certificate from a recognized valuer and the certificate should be a recent one. The funders (and the promoters of a startup) typically decide quantum of funding and equity stake on the basis of the enterprise valuation. However, funders would always prefer to provide the fund in tranches to ensure that the startup meets certain milestone and follows a desirable growth trajectory. The problem that a funder would face in such a situation is if the subsequent tranches are offered on the basis of original valuation, it may lead to purchase consideration being lower than the FMV at the time of disbursement of funds. If the startup has to get a fresh valuation every time it receives instalment of funds it would be an expensive proposition for the startup.  The funder also has a problem- it would get proportionately lower stake for subsequent tranches on the basis of fresh (supposedly higher) valuation. In order to resolve the problem section 50CA could include a provision that any valuation certificate would be valid for one year so that there is no need of further valuation exercise for funds raised within that period of one year.

It is true that one should not look for all the announcements with respect to startups in the budget. The ‘Startup India, Standup India’ programme launched by Government of India in January 2016 provided major boost to the startup movement in India. Generous funding was made available under this programme to eligible incubators and startups to create a vibrant startup ecosystem in the country. Can we visualize a new India where scientists and academics are allowed to setup startups? Academics who recognize that their discoveries or innovation can be commercialized may be encouraged to start commercial ventures in joint ownership with the host institutions/universities. It is true that an academic-entrepreneur would face great challenge in keeping a barrier between professorial and business activities, but that should not deter one from seeking an opportunity to establish a startup. In fact, if a scientist or an academic has the ability to demonstrate commercial success of her innovation, that would help in teaching as well now that she is able to bring her experience from the business to the classroom.


*********


[1] https://www.rolandberger.com/publications/publication_pdf/tab_start_ups_israel_final.pdf (accessed on 2 February 2017)

Twin Balance Sheet Problem, Indian Banking Sector, and the Budget of 2017-18: Have we forgotten Mary Poppins?

Of late, Indian banking sector has not been too well.  Credit, deposits and assets are down significantly and there has been substantial increase in non-performing assets. In this context, the recently released Economic Survey, 2016-17 has noted the simultaneous deterioration of corporates’ as well as banks’ balance sheets and suggested some important measures. Has the Budget proposals of 2017-18 looked into the plight of banking sector sufficiently?


Problems in banks


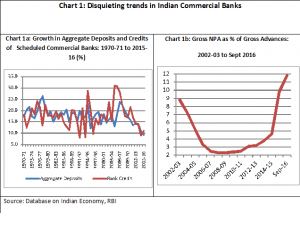
The recently released Report on Report on Trend and Progress of Banking in India 2015-16 of the RBI flagged out alarmingly that the consolidated balance sheets of the banking sector grew at meagre pace of 7.7 per cent during 2015-16. More importantly, the pace of expansion of deposits and credit of the scheduled commercial banks has registered unprecedented deceleration in 2015-16 (Chart 1a). Along with these decelerations, the other disturbing trend has been a significant deterioration of asset quality of public sector banks with their gross non-performing advances going up substantially to 11.8 per cent (of total advances); this pushed up the stressed advances (i.e., gross NPA plus restructured standard advances) to 15.8 per cent of total advances in September 2016 (Chart 1b). It looks like whatever has been achieved in terms of cleaning up banking sector balance sheet since the initiation of financial sector reforms all seemed to have wiped away now.


Chart 1: Disquieting trends in Indian Commercial Banks


Chart 1a: Growth in Aggregate Deposits and Credits of   Scheduled Commercial Banks: 1970-71 to 2015-16 (%) Chart 1b: Gross NPA as % of Gross Advances:

2002-03 to Sept 2016

Source: Database on Indian Economy, RBI


This has affected the behaviour and performance of banks in India. The latest Economic Survey, 2016-17 put the impact somewhat dramatically, and went on to say:


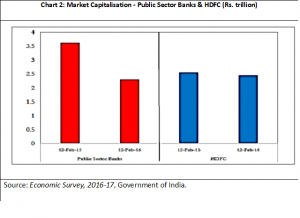
“In February 2016, financial markets in India were rocked by bad news from the banking system. One by one, public sector banks revealed their financial results for the December quarter. And the numbers were stunning. Banks reported that nonperforming assets had soared, to such an extent that provisioning had overwhelmed operating earnings. As a result, net income had plunged deeply into the red. …The news set off alarm bells amongst investors, who responded by fleeing public sector bank shares, bringing their prices to such low levels that at one point the medium-sized private sector bank HDFC was valued as much as 24 public sector banks put together” (Chart 2).


Chart 2: Market Capitalisation – Public Sector Banks & HDFC (Rs. trillion)
 
Source: Economic Survey, 2016-17, Government of India.


Why did it happen?


Number of reasons may be cited in this connection. Following are important in particular: (a) relaxation credit norms by the RBI in order to encourage bank lending after the global financial crisis; (b) the sharp fall in commodity prices since 2009 leading to sharp declines in the profitability of sectors such as steel and causing the problem of unpaid debt to banks from these and associated sectors; (c) the government thrust on infrastructure investment through public-private-partnerships (PPP) leading to huge new debt being contracted by highly leveraged Indian corporate entities investing in infrastructure; and (d) instances of governance issues with the management of select public sector banks and cases of political interference (Mohan and Ray, 2017).[1]


Twin Balance Sheet Problem


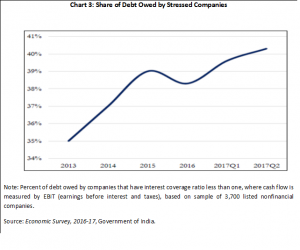
Economic Survey, 2016-17 in this context flagged the issue of “the Festering Twin Balance Sheet Problem”, whereby along with the deterioration of banking sector balance sheet, “around 40 percent of the corporate debt it monitored was owed by companies which had an interest coverage ratio less than 1, meaning they did not earn enough to pay the interest obligations on their loans” (Chart 3).


Chart 3: Share of Debt Owed by Stressed Companies
 
Note: Percent of debt owed by companies that have interest coverage ratio less than one, where cash flow is measured by EBIT (earnings before interest and taxes), based on sample of 3,700 listed nonfinancial companies.

Source: Economic Survey, 2016-17, Government of India.


But what is to be done so as to have a resolution of this twin balance sheet problem? The Economic Survey, 2016-17 candidly argued in favour of establishing a formal agency that can resolve the large bad debt cases – something in the nature of a ‘Public Sector Asset Rehabilitation Agency’. This has been employed by the East Asian countries after they were hit by similar balance sheet problem in the 1990s.  This is in the nature of a grand Bad Bank.


Budget, 2017-18 and the Banking Sector


Naturally, the analysis of Economic Survey created some hype about the shape of things to come the Budget of 2017-18 insofar as the banking sector is concerned. It is interesting to take look at the Budget proposals of 2017-18 in this context. The following deserve special mention.


First, the Finance Minister announced that a bill relating to resolution of financial firms would be introduced in the current Budget Session of Parliament. It was specifically noted, “This will contribute to stability and resilience of our financial system (and) will also protect the consumers of various financial institutions” (p. 20; Finance Minster’s Budget Speech, 2017-2018). It was expected that together with the Insolvency and Bankruptcy Code such as a resolution mechanism for financial firms will ensure comprehensiveness of the resolution system in India.


Second, in order to “streamline institutional arrangements for resolution of disputes in infrastructure related construction contracts, PPP and public utility contracts”, it was announced that, “the required mechanism would be instituted as part of the Arbitration and Conciliation Act 1996”.


Third, in order to solve “the stressed legacy accounts of Banks”, In line with the ‘Indradhanush’ roadmap, the Finance Minister has provided Rs. 10,000 crore for recapitalisation of Banks in 2017-18, and assured that, “additional allocation will be provided, as may be required”.


Fourth, listing and trading of Security Receipts issued by a securitization company or a reconstruction company under the SARFAESI Act has been permitted in SEBI registered stock exchanges. This is expected to “enhance capital flows into the securitization industry and will particularly be helpful to deal with bank NPAs”.


Finally, the Budget proposed to double the lending target of 2015-16 to Rs. 2.44 lakh crores under the Pradhan Mantri Mudra Yojana and added that, “priority will be given to Dalits, Tribals, Backward Classes, Minorities and Women”.


Have we forgotten Mary Poppins?


Are these measures sufficient to address the plight of the Indian banking sector? At one level, clearly these seem to be insufficient to recapitalize banks and kick-start the credit cycles; at another, one may note that devil may lie in the details that may emerge in the days to come. Thus, a definitive stance about the shape of things to come in the banking sector may be pre-mature.


In situations like this, one is reminded of the 1964 Walt Disney classic Mary Poppins, where Mr Banks takes his daughter Jane and son Michael to his work place, the Dawes Tomes Mousley Grubbs Fidelity Fiduciary Bank and the bank’s elderly chairman aggressively tries to persuade Michael to invest his modest savings (all of two pence or tuppence) in the bank and went on sing:


If you invest your tuppence / Wisely in the bank / Safe and sound / Soon that tuppence / Safely invested in the bank / Will compound …

You see, Michael, you’ll be part of / Railways through Africa / Dams across the Nile / Fleets of ocean greyhounds / Majestic, self-amortizing canals / Plantations of ripening tea

All from tuppence, prudently / Fruitfully, frugally invested  / In the, to be specific, / In the Dawes, Tomes / Mousely, Grubbs/ Fidelity Fiduciary Bank!


In times like this, it may be good to remember Mary Poppins and the tuppence song!


******


[1] Mohan, Rakesh and Partha Ray (2017): “Indian Financial Sector: Structure, Trends and Turns”, IMF Working Paper, No. WP/17/7, available at https://www.imf.org/en/Publications/WP/Issues/2017/01/20/Indian-Financial-Sector-Structure-Trends-and-Turns-44554

Growth and Fiscal Consolidation: Can both go together?

The Budget 2017 reinforced the message that India will continue to remain in the path of bespoke conservative fiscal approach, as dictated by orthodox economics. To the extent policy uncertainty is reduced , bond and currency markets which tend to pay a premium for policy and economic predictability is likely to view this budget favourably , at least in the immediate short term. Given the low-key recovery the Indian economy has exhibited over the last couple of years, this article will discuss scenarios under which the fiscal deficit target may be breached not only for the current year but also for the next year. And the culprit could be the unresolved issues of GDP calculation as per the new 2011-12 base and arguably optimistic nominal GDP estimates for FY2016 and FY2017.

Upward Bias in GDP estimates: On 31st January 2017, while the release of Economic Survey grabbed eyeballs with its erudition and freshness of perspective, the release of another macroeconomic number went largely unnoticed-The first revised estimate of GDP for the year 2015-16. As the press release from Ministry of Statistics and Program Implementation (MOSPI) states “The estimates of GDP and other aggregates for the years 2012-13 to 2014-15 have also undergone revision due to use of latest available data on agricultural production; industrial production especially those based on the provisional results of Annual Survey of Industries (ASI): 2014-15 and final results of ASI: 2013-14”. The point to note is that the GDP estimates of period as far as 2011-12 got re-estimated. As Table 1.1 shows for the years FY2012-13 to FY2014-15 the Nominal GDP estimates have been marginally but steadily revised downward.  For FY2015-16 the absolute value of nominal GDP got adjusted upwards. As table 1.2 shows the nominal GDP growth rate has been falling steadily since FY2012-13 and as per estimates nominal GDP is expected to change trend and grow by 11.9% in FY16-17.

  Table 1.1:Nominal GDP( INR Lakh Crore)(Base:2011-12)
  2011-12 2012-13 2013-14 2014-15 2015-16 2016-17
30/1/2015(New Series Launch with Base 2011-12) 88.3 99.9 113.45      
29/5/2015(Provisional Estimate for 2014-15)       125.4    
29/1/2016 (First Revised Estimate of 2014-15) 87.36 99.51 112.73 124.88    
8/2/2016 (Advanced Estimate for 2015-16)         135.67  
6/1/2017(First Advance Estimate for 2016-17)           151.93
31/1/2017(First Revised Estimate of 2015-16) 88.87 99.47 112.37 124.34 136.75  

  Table 1.2:Nominal GDP(Growth)(Base:2011-12)  
  2011-12 2012-13 2013-14 2014-15 2015-16 2016-17
30/1/2015(New Series Launch with Base 2011-12)   13.1% 13.6%      
29/5/2015(Provisional Estimate for 2014-15)       10.5%    
29/1/2016 (First Revised Estimate of 2014-15)   13.9% 13.3% 10.8%    
8/2/2016 (Advanced Estimate for 2015-16)         8.6%  
6/1/2017(First Advance Estimate for 2016-17)           11.9%
31/1/2017(First Revised Estimate of 2015-16)   13.9% 13% 10.7% 10%  
             

Can we Actually Meet the Fiscal Deficit target this Year? In a year where the mandated currency exchange, called demonetisation in popular parlance, is expected to affect the GDP growth downward, the official estimates suggest that the economy will turnaround. As per the official calculation, which explicitly did not consider the impact of demonetisation, FY16-17 is expected to show the best nominal GDP growth in three years. Of course the Economic Survey estimates the nominal GDP of the current fiscal year to be 100 basis point (bp) to 25 bp lower but this may also turn out to be a tad too optimistic. To the extent the fiscal deficit is calculated as a percentage of nominal GDP a downward adjustment of the same will breach the fiscal deficit target. As such the previous budget (for the year Fy2016-17) estimated a nominal GDP growth rate of 11% so as to restrict the fiscal deficit at 3.5% of GDP.

The 3.2% fiscal deficit target of FY2017-18 is based on a nominal GDP growth rate of 11.75%. An economy of nominal GDP of INR 136.75 lakh crore as of March 31,2016 is expected to grow to an estimated 169.7 Lakh crore by 31 March , 2018 and support a fiscal deficit of INR 5.4 lakh crore ie; hit the fiscal deficit target of 3.2% for FY2017-18. Whew!

Given that GDP estimates gets re-estimated even three years into the future, we may figure out two or three years down the line that India may have missed the fiscal deficit target in FY2016-17.

Past Tango of fiscal deficit and Nominal GDP: Fiscal deficit target overshooting in the first half of a fiscal and thereby forcing government to curtail spending in the second half is not a new phenomenon. Even now by December 2016,  around 94 % of the fiscal deficit has already been used up. The need to keep fiscal deficit in check forces government to sharply curtail spending in the last quarter if not the entire second half of the fiscal. In the absence of meaningful private investment this tends to further damp down the economy during the second half.

The nominal GDP growth in H1FY15 was above 13%. However by H1FY15(ie; 30 September 2014) the government had already exhausted 86% of its projected full year Fiscal Deficit(FD) of FY15(INR4.39 trillion). The H2FY15 nominal GDP growth nose-dived to 7% level and thus the full year(FY15) nominal GDP growth was 10.8%. One of the contributing factors has possibly been the sharp curtailment of government spending, which allowed Government to meet a FD target of 4.1% (of nominal GDP) in FY15.

When Mr. Jaitley presented FY2015-16 budget on 28th February 2015, he projected a fiscal deficit of INR 5.55 trillion (1 trillion is 1 Lakh crore). This was expected to be 3.9% of the then (as of Feb, 2015) expected FY16 nominal GDP of INR 141 trillion. This is because the budget expected an 11.5% nominal GDP growth in 2015-16 over the then projected 2014-15 nominal GDP of INR126.5 trillion. Subsequently, the FY15 nominal GDP was re-estimated at a marginally lower amount of INR 124.9 trillion. Since the nominal GDP for FY16 was scaled down from original budget expectations, in order to remain within fiscal deficit target of 3.9% for FY16, the FY16 fiscal deficit of INR 5.55 lakh crore has been reduced to INR5.35 trillion.

The Moment of truth: Thus, the nominal growth rates anticipated in the budget often get revised downward significantly and likewise the government reduces spending to keep the ratio of fiscal deficit in line with budgetary expectations. What is different this year is that the degree of downward revision in nominal GDP estimates may be much higher than has been the case in the past few years. If the spending is reduced by that commensurate amount to keep the fiscal deficit target ratio in check then it may affect the growth of the economy further. Ironically, an approach of fiscal consolidation which is considered conservative may cause larger instability if the growth scenario does not play out.


Market Watch

Raghav Ramesh Pillay

PGP student

Indian Institute of Management Calcutta


“Drop in economic activity due to demonetisation is transient …..Demonetisation has a strong potential to generate long-term benefits……””

Finance Minister Arun Jaitley

Housing Finance

Consumer Durables

Micro Finance


2 Wheeler Industry


FMCG

Real Estate


********


Sreetika Ray Mohapatra

PGP student

Indian Institute of Management Calcutta


The markets gave a positive reaction to the 2017-18 Union Budget with the benchmark NIFTY 50 jumping by 1.683%.

Conferring of “infrastructure” status to construction of affordable housing with increased allocation to Pradhan Mantri Awaas Yojana both promoted an immediate upward movement for infra  index.

However, the underwhelming allocation for recapitalization of PSBs did reflect on the index dropping slightly.

A strong stress on digitization from the start of the speech contributed to the positive momentum to IT Index. But overall the IT index fell during the day – Trumped?


*********

GOVERNMENT OF THE REPUBLIC OF UTOPIA AND “BYTE MONEY” PROJECT

GORU (Government of the Democratic Republic of Utopia), decided to abolish paper money and instead “print” only “BYTE MONEY”. Technologists came out with a unique non-counterfeitable algorithm and configured Byte Money in various denominations of Utopian Rupee (UR) up to 1 million UR.

The Reserve Bank of Utopia (RBU), in charge of “printing” of the Byte Money, transferred huge amounts of such “printed” Byte Money to various banks through computers, in exchange of paper currency surrendered by the banks. This new currency was named UTOPIAN BYTE RUPEE (UBR)

All the citizens of Utopia were asked to collect their Byte Rupee Cards (BRC) from the Banks. These plastic-electronic cards were loaded with UBR equivalent to the paper money surrendered by them. Each BRC can hold up to UBR 1 million.  Persons who were already holding Bank Accounts were also given these cards loaded with whatever was the balance in their account.

These BRCs were bearer cards, which like money, could be stolen or lost. Hence, at the request of the BRC holder, a unique number was embedded. Alternately, he could incorporate his own password for paying more than UBR500 at a time.

GORU also introduced a small gadget called “BYTE MONEY STORER” (BMS), the size of a cigarette packet (20s). This was a subsidized gadget for UR.50 and sold only through banks. Each gadget was given a unique number. Every kirana and individual was in possession of BMS.

The system worked as follows:

Mr. A goes to a kirana to buy a shampoo or tea bag or bun for UR 2.00. He inserts his BRC into the kirana’s BMS and punches the amount. The amount is deducted from his BRC and transferred to the BMS of the Kirana.  At the end of the day, the Kirana owner inserts his own BRC into his BMS and gets credited with the balance in the BMS. Now the BMS has nil balance.

If the Kirana owner wants to pay his supplier, he can do so by inserting his BRC into the BMS of the Supplier or the supplier can insert his BRC into the BMS of the Kirana and get credited.

Even daily bus tickets, auto/taxis, cinema tickets etc were dealt through BRCs. In fact paying tolls on highways, buying vegetables, enjoying a cup of coffee could be through BRCs. In other words, the BRC was the “purse” holding the money, from which one paid to another’s BRC through BMS.

The wide usage of the BRC and BMS resulted in the following:

  • At intervals of time, when the BRC holder wanted to deposit money in his Bank account, he took his BRC to the Bank or to ATM and inserted the same in the BMS of the Bank and his account got credited in the Bank and deducted from his BRC.
  • The banks earlier used to restrict withdrawal of money from ATMs to not less than UR 100, due to the transaction costs involved. Now this ceased to be a problem as no one wanted to draw money from ATMs and even UR 1.00 could be paid through the BRC to any BMS and this transaction was not through the ATM. This was equivalent to paying paper money from the purse. Simply put, money was transferred from BRC to another BRC through BMS held by individuals.
  • Within one year all the paper money got out of the system and into the vaults of RBU for pulping and recycling for other purposes.
  • Since there was no more printing of paper money, millions of tonnes of wood got saved, resulting in stoppage of destruction of forests and trees.
  • The various hazardous chemicals used in the manufacture of the paper money got eliminated.
  • The new “BYTE MONEY” (UBR-Utopian Byte Rupee) was “printed” by the RBU according to the normal monetary policy of GORU.
  • Everyone paid everyone else in Byte Money and the Government also collected its taxes in the form of Byte Money.

In other words, paper money ceased to exist.

Just like the fight between any Federal Reserve Bank and the counterfeiters of paper money, the fight continued with Byte Money also. GORU is geared up on this to combat this.

The problem of Byte Money Storer (BMS) being stolen, getting destroyed, drowned etc were also addressed. Since BMC as well as BMS were sold by the Banks, the Banks give an unique number and just like the de-activation of a mobile phone lost or stolen, the same de-activation was done and new BMS could be issued. The BMS holders were encouraged to transfer to their bank accounts substantial balances in the BMS frequently and keep only minimum balance in the BMS so that when stolen or damaged, the amount lost would be minimal (Just like the risk of carrying wads of paper money in the purse). The facilities were available in all the ATMs and Bank Branches to draw byte money from the bank balances either into BMS or BRC and vice-versa. This eliminated the requirement of BRC or BMS to carry heavy balance.

One important side-effect was the demonetization of the paper money resulting in elimination of “black money”, bribes and corruption.  It is true that for a few months, the paper money used to be in circulation, meaning that some people still used the paper money as consideration for payments. It died out eventually, for the simple reason that RBU was not printing any more paper money to replace soiled or damaged notes. Hence after some time people refused to accept old paper money.

In this process of elimination of paper money and restoration of forests, the Republic of Utopia earned considerable revenue from Carbon Credits. However, they were aware that they were enjoying the first mover advantage and it was a matter of time before other countries also followed suit.

It was a win-win situation for all.

The article appeared titled as “Cashless Utopia” in The Hindu Business Line on the 8th of December and can be accessed at http://www.thehindubusinessline.com/opinion/benefits-of-digital-money-and-cashless-banking/article9416230.ece   


Announcement of Cyrus Mistry’s Removal: A Look at Market Reaction

It was almost a bolt from the blue. Tata Sons announced on 24th October that it sacked Mr. Cyrus Mistry as Chairman of the company and requested Mr.  Ratan Tata to take charge. Reports suggested that the decision of Tata Sons Board on that day took everyone by surprise and the whole event was kept under utmost secrecy until the date of the announcement. Later a newspaper[1] report revealed that a day before Tata Sons Board meeting, an emissary of Ratan Tata had met Mr. Cyrus to explain what was on the agenda for the next day’s board meeting. Therefore, a question may arise whether some ‘insiders’ knew the ‘news’!

Tata Sons is the holding company of Tata conglomerate. Tata Trust owns 66% of Tata Sons, and Ratan Tata is the Chairman of the Tata Trust. Incidentally, Cyrus Mistry and his family control 18% of Tata Sons. Therefore, the Tata Trust would normally be concerned about the well-being of Tata Sons and thereby all the operating companies that are directly or indirectly under the control of Tata Sons. It is quite natural that an underperforming Chairman may be asked to go if the holding company finds his performance wanting. It is no secret that several operating companies of Tata Group were struggling. Tata Steel is burdened by the failure of its European bet. Tata Teleservices is in the midst of a messy separation with NTT DoCoMo. Tata Global Beverages is tackling stressed assets in Eastern Europe. Tata Consultancy Services (TCS), the group’s cash cow, is facing its own problem.  Thus, people should not ascribe ‘motive’ in the decision of Tata Sons to oust Cyrus. However, friends of Cyrus say that he got only four years to run the company and one should not judge his performance within such short time.

Pundits have started giving ‘advice’ on how to restructure the complex corporate monolith. Suggestions include Tata Trust, and Tata Sons have same Chairman, Tata Trust would only concentrate on philanthropies and would not interfere with the governance and board of Tata Sons and other operating companies, etc.  The Cyrus ouster episode has raised several governance questions.

Separation of ownership and management in organizations create information asymmetry problem between shareholders and managers that expose owners to agency cost. In family run business, agency problem has another dimension- the tension between inside owners (promoters/family) and outside owners. Empirical evidence shows that stock markets generally reward companies that follow transparent corporate governance practices. Studies have shown that firms with better corporate governance could raise money at a lesser cost. Firms that improve their governance structure benefit by lowering their cost of equity. Even the lenders prefer and at times demand certain governance structure. Therefore, it makes economic sense to follow well-established board practices.  There are exceptions though- several researchers show that certain family run companies create greater wealth for shareholders without paying much attention to board governance. The founder of Apple Inc., used to think that corporate governance practices hinder innovation and creativity.

Establishing corporate governance structure in a family-run business is really challenging.  Family-run businesses contribute significantly to the economic development of any country. Many large global corporations are family owned. These businesses have realized the importance of structure and processes that help any business to grow.  Putting governance structure in family-business is not easy- it requires the family to open up, make the sacrifice and cede some administrative control to ‘outsiders’. This transition requires the creation of some form of family council to ensure transfer of power without necessarily diluting control rights.

One way corporations achieve this dual objective of implementing corporate governance structure in operating entities without giving up much of cash flow rights is through the creation of closely-held holding company structure. There could arise two types of rights in connection with control of any firm- cash flow rights and control rights.  Large investors may be able to derive private benefits from control. Thus control rights may exceed cash flow rights (i.e., dividend). Bennedsen and Nielsen (2010)[2] find evidence of the presence of substantial agency costs associated with the separation of control and cash flow rights.  Controlling shareholders have incentives and opportunities to obtain private benefits at the expense of firm value.  Agency costs are furthermore expected to be higher in firms where cash flow is not spent on investments or on payouts to shareholders, but allocated to cash reserves likely to be at the controlling shareholders’ discretion.

There have been allegations against Cyrus that he was trying to sell the crown jewels of the company and was carrying out a ‘secret’ plan for downsizing or disposing of several projects/assets that Ratan Tata had started. People closer to Ratan Tata blamed Cyrus for the recent poor performance of Tata Group companies in the stock market. The Cyrus camp, on the other hand, blamed Ratan Tata for undue interference and maintained that Cyrus was making some hard but necessary restructuring to save the company in the long run.  The debate would continue for quite some time and only future would show who was right.

The objective of this article is not to probe the corporate governance angle to this debate or find out the real reasons behind the ouster of Cyrus. We try to explore whether some people knew the news about Cyrus’s ouster on 24 October before that day. We turn to trading activities in Tata group shares around the announcement date.

Announcement Effect on Volume

We looked at the trading volume of 27 (24 for NSE) Tata Group stocks in both BSE and NSE on the date after the announcement of the removal of Cyrus Mistry (Table I).  It was seen in BSE that Tata Teleservices and four (three in NSE) other companies witnessed significant trading activity as their daily volume jumped more than 100% the next day. Interestingly, TCS saw nearly 50% (32% in NSE) fall in trading volume on 25th October 2016. The other two large Tata companies- Tata Steel and Tata Motors saw a moderate increase in trading volume.

Table I

Announcement Effect

Percent volume change of Tata Group Stocks on the day of removal of Cyrus Mistry

Vol_chg (%) is the percentage change in volume on Bombay Stock Exchange relative to seven-day moving average

  Date Company vol_chg (%)
1 25-Oct-16 Tata Teleservices 673.0
2 25-Oct-16 The Indian Hotels Company 192.0
3 25-Oct-16 Benares Hotels 131.4
4 25-Oct-16 Rallis India 127.3
5 25-Oct-16 Tata Metaliks 105.7
6 25-Oct-16 Voltas 77.7
7 25-Oct-16 Tata Chemicals 70.4
8 25-Oct-16 Tata Steel 47.0
9 25-Oct-16 Tata Motors 39.0
10 25-Oct-16 Tata Investment Corporation 26.3
11 25-Oct-16 Tata Communications 25.9
12 25-Oct-16 Trent 24.0
13 25-Oct-16 Titan 20.4
14 25-Oct-16 Tinplate Company of India 20.2
15 25-Oct-16 Tata Power Company 13.7
16 25-Oct-16 Tata Global Beverages 3.2
17 25-Oct-16 Tata Motors DVR -8.2
18 25-Oct-16 Tata Sponge Iron -9.5
19 25-Oct-16 Tata Elxsi -14.6
20 25-Oct-16 Automotive Stampings & Assemblies -35.8
21 25-Oct-16 Nelco -43.1
22 25-Oct-16 TCS -46.8
23 25-Oct-16 TRF -46.9
24 25-Oct-16 Tata Coffee -48.7
25 25-Oct-16 Oriental Hotels -72.3
26 25-Oct-16 Automobile Corporation of Goa -85.1
27 25-Oct-16 Tayo Rolls -89.5

Source: ACE Equity

Information Leakage?

Though Tata Motors’ trading volume did not show much increase the day after the announcement, Tata Motors DVR stocks witnessed a whopping 2000% increase (Table II) on the day of the announcement (announcement happened after market hours of the day). Even in NSE, Tata Teleservices showed more than 1600% increase on the same day. Was the information leaked?

Table II

Information Leakage

% volume change of Tata Group Stocks one day before the removal of Cyrus Mistry

Vol_chg (%) is the percentage change in volume on Bombay Stock Exchange relative to seven-day moving average

  Date Company vol_chg (%)
1 24-Oct-16 Tata Motors DVR 2,117.3
2 24-Oct-16 Tata Teleservices 1,796.4
3 24-Oct-16 Tata Sponge Iron 84.0
4 24-Oct-16 Trent 69.4
5 24-Oct-16 TRF 57.1
6 24-Oct-16 Nelco 44.9
7 24-Oct-16 The Indian Hotels Company 26.1
8 24-Oct-16 Tinplate Company of India 25.5
9 24-Oct-16 Tata Motors 18.5
10 24-Oct-16 Tata Global Beverages 12.3
11 24-Oct-16 Rallis India 0.7
12 24-Oct-16 Tata Metaliks -3.8
13 24-Oct-16 Voltas -4.3
14 24-Oct-16 Tata Chemicals -8.9
15 24-Oct-16 Automotive Stampings & Assemblies -11.9
16 24-Oct-16 Tata Power Company -24.9
17 24-Oct-16 Tata Communications -28.8
18 24-Oct-16 Titan -38.3
19 24-Oct-16 Tata Elxsi -44.7
20 24-Oct-16 Tata Coffee -48.4
21 24-Oct-16 Tata Investment Corporation -49.0
22 24-Oct-16 Tata Steel -54.8
23 24-Oct-16 Benares Hotels -68.2
24 24-Oct-16 TCS -83.2
25 24-Oct-16 Automobile Corporation of Goa -83.7
26 24-Oct-16 Oriental Hotels -88.3
27 24-Oct-16 Tayo Rolls -90.9

Source: ACE Equity


Announcement Effect on Returns

Let us take Tata Teleservices. The stock showed significant positive cumulative returns before the announcement (Tables III and IV), and the returns turned negative immediately after the announcement. This indicates that people who sorted the share (or stock futures) made a killing immediately after the announcement. Another interesting trend emerges from Table III- most of the stocks showed negative cumulative returns from two/three days prior to the day of the announcement. It is clear that some traders had started selling several Tata shares a few days before 24th October 2016. Tata Steel, for example, turned negative four days prior to the announcement. Expectedly most of the Tata Group stocks witnessed negative returns after 24th October for next seven days.

Table III

Returns indicated below are cumulative raw return (%) in different windows from day -7 to day +7. Day 0 represents the day of removal of Cyrus Mistry from Tata Sons (BSE)

Company (-7,0) (-6,0) (-5,0) (-4,0) (-3,0) (-2,0) (-1,0) (0,1) (0,2) (0,3) (0,4) (0,5) (0,6) (0,7)
Automobile Corporation 4.8 -1.7 -4.6 -7.4 -4.7 -1.8 -2.7 -2.9 -4.7 3.1 3.6 5.9 2.7 3.5
Automotive Stampings 7.6 4.5 5.2 5.1 4.9 4.2 -2.8 -2.0 -7.1 -6.3 -7.9 -5.4 -3.3 -5.4
Benares Hotels 2.0 0.9 0.2 0.2 0.6 0.2 0.1 -1.8 -3.2 0.0 2.2 1.9 1.9 1.0
Nelco 6.3 5.7 6.4 5.6 4.5 4.1 -3.6 -3.9 -6.3 -5.9 -5.5 -4.9 -7.7 -10.1
Oriental Hotels 6.0 3.4 2.9 -0.5 -0.9 -2.3 -2.7 -3.6 -4.9 -2.1 -0.1 0.8 -1.3 -2.6
Rallis India 2.6 1.0 1.5 -1.6 -0.9 -1.1 -1.0 -4.6 -6.6 -6.9 -4.7 -6.6 -8.6 -9.7
TCS 3.0 1.4 1.5 0.0 0.2 0.0 -1.2 -1.3 -0.6 -1.2 -1.4 -3.3 -5.2 -4.5
TRF 0.4 0.7 0.6 -1.1 -2.5 -2.4 -3.4 -2.5 -6.3 -2.0 -1.6 -5.8 -8.0 -6.6
Tata Chemicals 6.3 4.5 5.7 4.6 -0.2 0.0 -2.5 -4.9 -6.9 -6.0 -6.3 -5.4 -8.4 -12.0
Tata Coffee 1.8 -4.0 -7.6 -9.0 -11.0 -7.6 -4.5 -3.1 -6.4 -4.4 -4.2 -3.9 -6.7 -8.4
Tata Communications 0.7 0.5 1.9 2.6 1.4 2.2 -3.7 -4.9 -6.6 -5.3 -5.4 -3.7 -6.6 -9.2
Tata Elxsi -0.7 -0.6 0.8 -1.8 -2.9 -2.9 -2.1 -4.6 -7.0 -2.8 -2.6 -1.4 -4.4 -5.6
Tata Global Beverages 1.6 -1.8 0.0 -1.2 -2.9 -1.5 -1.7 -5.6 -10.7 -9.5 -9.7 -10.1 -12.8 -15.5
TIC 0.8 0.9 -0.6 -1.6 -2.6 -1.5 -1.4 -1.7 -7.1 -5.6 -4.5 -4.7 -7.3 -8.9
Tata Metaliks -1.4 -1.6 -2.3 -7.1 -7.0 -9.7 -7.0 -8.8 -13.6 -7.7 -6.7 -8.6 -10.8 -13.3
Tata Motors 1.7 -0.4 1.2 0.0 0.6 1.1 1.6 -5.3 -6.8 -4.1 -4.8 -5.0 -8.2 -8.9
Tata Motors DVR 2.4 0.5 1.3 -0.3 0.5 1.2 1.6 -4.8 -6.9 -3.9 -4.5 -4.0 -7.9 -9.0
Tata Power Company 5.6 5.0 6.1 5.0 1.5 0.6 -1.4 -3.6 -4.9 -6.3 -6.7 -6.7 -8.1 -8.5
Tata Sponge Iron 1.9 2.4 -0.6 -2.2 -3.9 -8.1 -4.8 -3.6 -7.6 -6.7 -5.9 -6.0 -8.6 -9.8
Tata Steel 0.5 1.0 1.3 -2.2 -2.3 -3.0 -2.8 -6.5 -7.0 -5.1 -5.1 -1.8 -2.8 -5.3
Tata Teleservices 20.8 22.4 24.1 21.9 23.3 24.6 22.8 1.5 -8.2 -4.3 -3.9 -4.6 -8.6 -8.8
Tayo Rolls 6.6 -11.6 -2.4 -4.8 -6.0 -2.1 -0.1 -0.4 -3.3 -0.7 0.9 -1.4 -4.2 -6.2
Indian Hotels -0.9 -1.8 -2.5 -2.7 -2.6 -3.3 -5.3 -6.5 -11.8 -11.5 -9.1 -8.9 -12.3 -17.0
Tinplate 4.6 4.8 3.7 1.3 -2.6 -2.0 -0.6 -4.9 -8.8 -6.3 -5.9 -7.0 -8.7 -9.8
Titan -4.2 -3.5 -3.3 -4.3 -3.9 -4.3 -1.8 -0.6 -2.2 -0.7 1.3 -0.7 0.1 -0.1
Trent -4.9 -3.1 -2.2 -3.8 -2.7 -2.3 -0.7 -1.7 -2.5 -1.7 0.8 1.8 -0.8 -0.9
Voltas 4.6 0.2 1.5 -0.4 -1.1 0.3 1.0 -2.1 -3.0 -1.5 -1.5 -2.1 -5.2 -7.5

Source: ACE Equity

Table IV

Returns indicated below are cumulative raw return (%) in different windows from day -7 to day +7. Day 0 represents the day of removal of Cyrus Mistry from Tata Sons  (NSE)

Company (-7,0) (-6,0) (-5,0) (-4,0) (-3,0) (-2,0) (-1,0) (0,1) (0,2) (0,3) (0,4) (0,5) (0,6) (0,7)
Automotive Stampings 9.5 5.0 7.1 5.9 6.5 7.4 -0.7 -1.5 -6.4 -6.5 -8.1 -7.1 -1.4 -4.0
Nelco 6.7 6.3 6.8 5.7 4.7 4.7 -3.3 -3.7 -6.4 -5.9 -5.6 -5.0 -7.9 -10.0
Oriental Hotels 5.8 2.7 3.7 -0.3 -0.3 -1.8 -3.0 -3.4 -5.5 -2.3 -1.2 0.7 -2.0 -2.4
Rallis India 2.7 0.6 1.5 -1.9 -1.0 -1.1 -1.0 -4.3 -6.4 -7.1 -4.8 -6.6 -8.5 -9.9
Tata Chemicals 6.5 4.7 5.9 4.9 0.1 0.2 -2.4 -5.1 -6.8 -5.9 -6.4 -5.3 -8.7 -12.2
Tata Coffee 1.8 -4.8 -8.1 -9.6 -11.3 -7.9 -4.8 -3.2 -6.6 -5.0 -4.5 -4.0 -6.9 -7.6
Tata Metaliks -1.7 -1.8 -2.5 -7.5 -7.2 -9.7 -7.0 -9.0 -13.6 -7.5 -6.8 -8.7 -10.8 -13.3
Tata Sponge Iron 1.5 2.0 -1.2 -2.7 -4.3 -8.5 -5.2 -3.4 -7.6 -6.7 -6.2 -6.1 -8.4 -9.7
Tata Steel 0.4 0.8 1.2 -2.3 -2.5 -3.1 -2.8 -6.5 -6.9 -4.8 -5.0 -1.8 -2.8 -5.3
Tata Teleservices 20.5 21.3 23.7 22.0 22.0 23.6 22.0 1.3 -8.5 -4.1 -3.4 -5.5 -8.4 -9.1
Trent -5.0 -3.1 -2.2 -3.9 -2.7 -2.2 -0.8 -2.0 -2.6 -1.8 0.7 2.1 -1.1 -0.4

Source: ACE Equity

Our results are not exhaustive as it covers market reactions for a fortnight around the date of announcement of the ouster of Mr. Cyrus Mistry. However, it offers some scope for further analysis. Our results, at the minimum, show that there was some noise in several stocks of Tata group companies a few days before 24th October. Both the trading volume and cumulative returns captured the abnormality.

[1] Economic Times, 25th October 2016

[2] Bennedsen, M., Nielsen, K., 2010. Incentive and entrenchment effects in European ownership. Journal of Banking and Finance 34, 2212-2229