U.S. Cross Border Deals in China and India: A Comparison

The last two decades has seen gradually increasing integration across global capital markets, not only with increased foreign direct investments but also an increased amount of deal making activity across countries. Several foreign firms have entered the U.S. market by acquiring a stake (in many cases a majority stake) in U.S firms. Likewise, U.S. firms have also increased their footprint globally, and in particular in Asia. China and India are two of the leading countries in Asia to account for a huge proportion of such expansionary deals by U.S. based institutions. This study takes an initial look at all such deals by U.S. institutions that acquired any type of stake in either China or India and presents a side-by-side comparison between these activities.[1] The analysis includes joint ventures, minority stakes, majority stakes, and outright mergers and acquisitions in either country between the years 1991 and 2018. In total, we have 1705 Chinese deals and 1981 Indian deals in our sample.

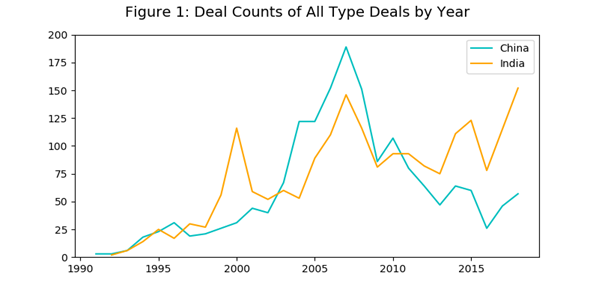
Figure 1 shows the trend in number of cross-border deals by US acquirors in China and India. Deals by US institutions in China reached its peak around 2007. However, since the financial crisis in 2008, the number of the deals in China has declined sharply until 2016. In 2016, the number of cross-border deals by US acquirors in China was only around 25, almost the same level as in 1998. Recently, over the last couple of years, deals in China has started displaying an upward trend. Compared with the single peak in China, the trend of similar deals in India showed multiple peaks in 2000, 2007, and 2015, with an average of 125 deal counts in each of these years. Since 2016, similar to the trend in China, the number of deals in India has also boomed, with the growth rate of deal counts being significantly higher than that in China. Based on the historical trend, 2018 appears to be another peak deal flow year for India.

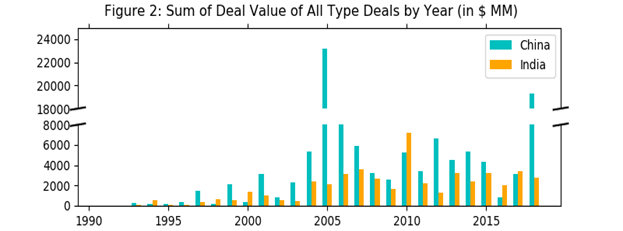
In addition to the number of deals, we also compared both the total deal value and the median deal value, for both countries, for each year. The analysis that follows on deal value is however only for a subset of the data, for which the deal values are non-missing, which is approximately for 42% of the overall data. While this limits our ability to get a clear overall picture, it should be noted that the data availability issue is very similar across the two countries and hence not skewed in any manner. Figure 2 presents the total value of all deals, which are expressed in real 2018 US dollars. The results show that there is greater heterogeneity in terms of total deal value in China, with the highest value achieved in 2005, around 23 billion US dollars. Over the past three years, the sum of deal value showed a similar upward trend to that of deal counts, with a significant jump up in 2018, reaching around 20 billion US dollars. Compared to China, the trend of total deal value in India has been more stable with an average value at around 3 billion USD per year. The peak total deal value in India was in 2010 but following that, total value has dropped to previous levels. On average since 2005, there does not seem to be significant differences in levels of total deal value in India.

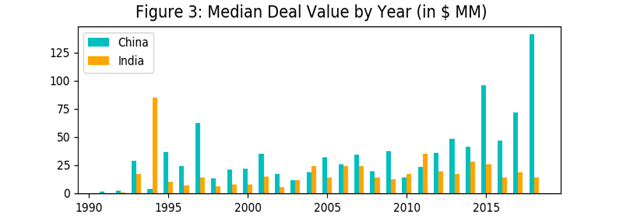
Figure 3 presents a comparison of the median deal value by year between China and India. We employ medians to eliminate the effects of the extremely large or small deal values. We find that for most years, the median deal value in China is greater than in India. Moreover, since 2013, while the median deal value in India has on average remained stable, the same has been increasing rapidly in China. For the last few years the median value in India has been gradually dropping in each year. Combined with the results from figures 1 & 2, the trend analysis suggests that US deals in China and India are potentially intrinsically different in nature, with India attracting smaller deals on average, but in larger numbers, while China attracting fewer deals but with higher value per deal.

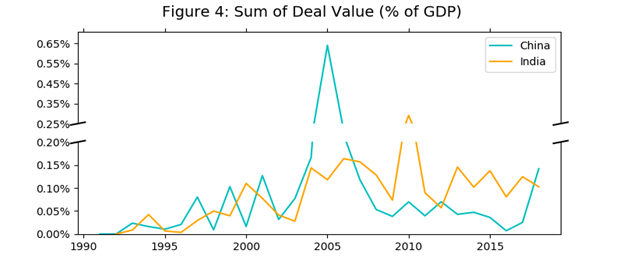
To shed further light, we also undertook the same exercise by normalizing total deal value by different macro indicators, such as gross domestic product (GDP), foreign direct investment (FDI), and stock market capitalization of each country. Figure 4 shows the trend of the sum of total deal value as a percentage of the GDP in each year. All the GDP values are in 2018 US dollars adjusted by the GDP deflator of each country. For most of the time and for both China and India, the percentage fluctuates from 0.02% to 0.15%, indicating that the volume of total deal values in both countries is quite small when expressed as a fraction of each country’s GDP. However, the overall trend indicates, that India has seen a steadier trend line in total deal value as a percent of GDP compared to China, over the last two decades.


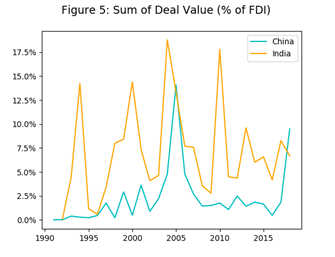
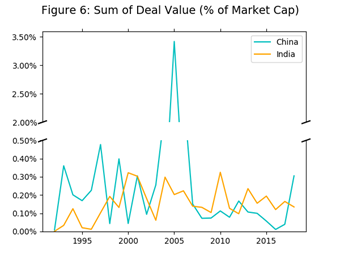
Similar to the GDP analysis we further explore on the trends of sum of deal values as a percent of FDI and stock market capitalization. As shown in Figure 5, the percentage of total deal values over FDI inflow each year in India is much higher than that in China, indicating that M&A investments make up a higher share of FDI inflow to India than in China. Figure 6 on the right shows that, even though the peak reached to 3.5% in 2005 due to extreme deal value, the percent of total deal values over Stock Market Capitalization is still quite insignificant both for China and India. Overall, the trend analysis indicates lower value fluctuations in India as compared to China, when analyzing deal flows from the US.

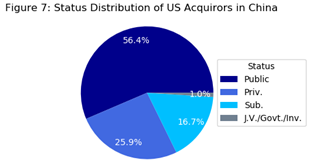
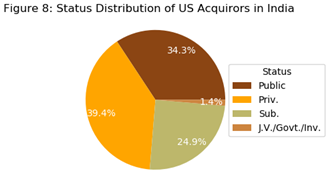
Figures 7 & 8 provides a look at the classification of US acquirors that invest in China and India. Compared to India, M&A deals in China have significantly more public acquirors from US, but fewer private acquirors. In addition, fewer US subsidiaries engage in China, relative to India. Joint ventures, government backed institutions, and financial acquirors make up approximately 1 to 1.5 percent in China and India, respectively. To understand whether the two countries have significant differences in these distributions, we conducted a double-sided t-test. Based on the results shown in Table 1, we can see that they have the significantly different distributions in public status and subsidiary status.

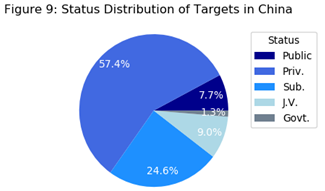
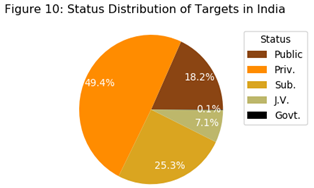
Figures 9 and 10 above, show the status distribution for target firms in China and India. We can see from the pictures that, compared to India, China has more private companies that are acquired by US companies but fewer public companies that are acquired. In terms of US firms establishing subsidiaries or engaging in JVs in the two countries, we do not find any significant difference. The t-tests below in Table 1, also highlights these differences between the two countries.

Table 1: Double-Sided T-test Result for Status distribution in China and India

t-value p-value P < 1%
Diff in Public Acquiror 3.0788 0.0033 Yes
Diff in Priv. Acquiror -0.8948 0.3750 No
Diff in Sub. Acquiror -3.2649 0.0022 Yes
Diff in Public Target -4.4708 0.0001 Yes
Diff in Priv. Target 3.4141 0.0015 Yes
Diff in Sub. Target 0.3151 0.7540 No

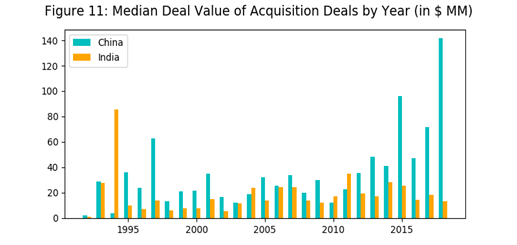
We finally, confirm the trends above by analyzing a couple of different sub-samples. First, we eliminate all JVs, since they account for a small portion of our sample, and only consider acquisition stakes. Figure 11 plots these results. As before, we find a similar trend on the median deal value for all types of M&A deals.

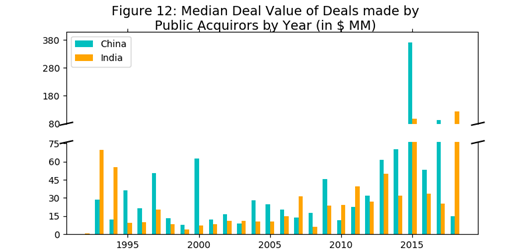
Similarly, as shown in Figure 12, we consider the median deal value by public US acquirors in China and India. The results indicate a growing trend in this respect over the last 5 years in both countries. While 2015 particularly stands out for China, 2018 shows significant deals by public US acquirors in India. Again, the overall trend for India seems more gradual, when looking at investment by public US acquirors.

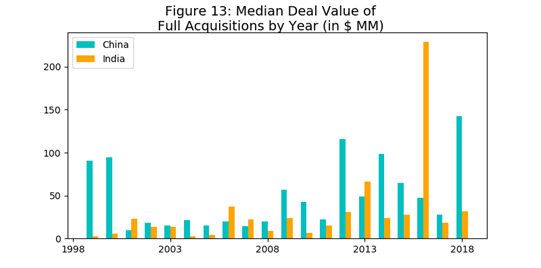
Finally, we also take a look at the trend in the full acquisition deals, which means 100% ownership of the targets after the transaction. Figure 13 shows that the median deal value of this type of deal grew in China, gradually from 2000. Compared with the trend in China, India displayed relatively flat deal value throughout the years, except for 2016, when the median deal value was significantly higher. However, for all other years the median values were on average lower than that in China.

In conclusion, it should be noted, that our analysis does not take into account government regulations that exist in both countries with regard to equity stake ownership and its heterogeneity across industries, and hence should be interpreted with caution. This overview is only meant to stimulate discussion on the factors that are driving or impeding US cross border investments for corporate control in China and India.

[1] We will use the term US institutions and US acquirors interchangeably in this article.

Digitalization of Payments in India: What has happened in the last five years?

The International Monetary Fund (IMF) and the World Bank group launched, on October 11, 2018, the Bali Fintech Agenda- a set of twelve policy elements that would help all countries, and more particularly emerging and low-income nations, to harness the ‘benefits and opportunities of rapid advances in financial technology that are transforming the provision of banking services while at the same time managing the inherent risks’[1]. One of the agenda is to promote financial inclusion through use of fintech. Fintech could play a significant role in achieving financial inclusion target of a country by leveraging technology to increase access, awareness and depth of financial services. There are an estimated 1.7 billion adults in the world without access to financial services[2]. However, there is a silver line- it is now possible to include many people within the fold of formal financial services much faster with the use of technology. Penetration of smart phones and other mobile devices, presence of payments banks, and agents have revolutionized the notion of banking.

India has done well in the recent past in terms of providing formal access of banking services to a large section of the population. Similarly, India has the second highest fintech adoption rate in the world[3]. Therefore, India should be able to effectively use fintech to promote financial inclusion. India has witnessed, in the past five years, serious government initiatives to push forward digital payments and financial inclusion. Use of technology in finance invites serious challenges to the traditional service providers and also threats to the security and safety of money. Therefore, a vibrant and reliable financial services need a responsive and fair regulatory system.

Financial Inclusion and Digital Payments

Financial inclusion, ever since the term was used in 2005[4], has been a distant dream in India. The rural Indian population was heavily dependent on money lenders and other informal financial channels to meet their financial needs. The access to formal banking services was limited due to bank’s inability to reach the rural poor, and lack of awareness. In order to bring the poor and particularly women into banking fold, the Government of India had announced a major scheme, called Pradhan Mantri Jan-Dhan Yojana (PMJDY), on 15 August 2014, as a national mission for financial inclusion. Under PMJDY, every Indian household will have at least one bank account and access to credit and other financial services. If one measures financial inclusion by access (number of bank accounts) alone, the PMJDY is a huge success. When the scheme was launched in 2014, about 53% of Indian population (above 15 years old) had formal bank account. The PMJDY brought almost 80% of population under formal banking- a significant achievement[5]. The government has used successfully the bank accounts of the poor to transfer several benefits (e.g., pension, subsidies) and this has resulted in sizable reduction in leakages. Each account holder under PMJDY gets a debit card (RuPay) as part of the deal and hence if one looks at the number of debit card issuance in India, it grew significantly post PMJDY. For example, in July 2014, the number of outstanding debit cards was 414 million In India and it crossed 500 million mark in next six months- registering a growth of 20%. The number of credit cards grew by only 4% during this period (Table 1). However, payments using plastic (debit) cards offer a mixed picture. While the total value of debit card transactions have increased significantly over the past five years, the per transaction value has actually declined during the same period (Table 1). Even the ticket size per transaction using UPI (Unified Payment Interface[6]) has declined since its launch (Table 3). But UPI total transaction volume tells a different story.

Table 1: Usage of Plastic Cards in India: Point of Sales (POS) Transactions

Debit Cards Credit Cards
Month # of Cards Volume Value(Rs.) Size (Rs.) # of Cards Volume Value(Rs.) Size (Rs.)
Apr-11 230.26 22.46 37055.43 1649.73 17.78 23.23 70553.98 3037.48
Mar-14 394.42 56.98 85770.65 1505.24 19.18 46.11 145487.31 3155.54
Jul-14 413.92 64.66 99081.23 1532.27 19.61 50.92 152667.98 2998.44
Dec-14 500.08 73.62 111006.57 1507.86 20.36 56.09 171865.26 3064.00
Dec-15 643.19 108.12 145831.93 1348.82 22.75 69.37 211941.38 3055.35
Dec-16 764.43 415.46 580312.50 1396.79 28.32 116.08 311491.20 2683.35
May-17 790.36 269.85 377777.90 1399.98 30.86 115.33 361406.80 3133.66
Aug-17 810.87 267.62 356653.80 1332.67 32.65 115.33 362987.80 3147.48
Dec-17 842.47 292.39 407603.00 1394.05 35.50 123.77 418636.70 3382.40
Dec-18 958.15 386.69 530214.00 1371.17 44.21 158.34 542347.00 3425.16
Mar-19 924.63 407.57 530111.00 1300.68 47.09 162.41 576511.00 3549.70

Source: NPCI. # of cards denote cumulative number of outstanding cards. Volume and value are in million. Size refers to INR value of an average transaction.

Overall, the number of outstanding debit cards have grown four folds in the past eight years, but the number of credit cards grew by only two-and-half times during the same period. Increase in debit card numbers has been largely involuntary- driven by automatic issue of RuPay cards to account holders under PMJDY scheme. Credit card usage indicates voluntary digitalization of payments and that number has not increased much. It may be noted that the average usage of credit cards (denoted by size in Table 1) has marginally increased since the government’s drive against cash payments.  In fact, immediately after demonetization[7], payments through credit cards had actually declined – see the December 2016 figures. Payments through debit cards did marginally increase immediately after demonetization.

However, demonetization effect can be easily seen in the ATM usage (Table 2). There was a significant fall, as expected, in the cash withdrawals in December 2016- both in terms of volume and size. Many ATM counters had gone dry after demonetization and it took several months for these outlets to restore cash availability.  Use of cash, which saw a dip in December 2016, had gone up to the pre-demonetization level in six months (May 2017). While payments through cards did not significantly increase after November 2016, use of cash for meeting regular expenses bounced back within a very short time. Debit card ATM value of transactions have gone up from Rs. 0.85 trillion in December 2016 to Rs. 3.13 trillion in December 2018- almost four-folds increase in two years. An estimate shows that only 4 percent of personal consumption expenditure in India happen digitally. Therefore, if one examines the growth of digital payments via cards, it may appear that efforts of the central government to push digital payments have not produced desired results. But digital payments do not involve payments through cards alone.

Table 2: ATM Usage in India

Debit Cards Credit Cards
Month Volume Value(Rs.) Size (Rs.) Volume Value(Rs.) Size (Rs.)
Apr-11 399.55 1061653.47 2657.10 0.17 963.72 5603.74
Mar-14 571.50 1796098.93 3142.79 0.30 1661.70 5603.48
Jul-14 583.12 1855244.74 3181.56 0.32 1729.61 5408.99
Dec-14 591.06 1897693.28 3210.68 0.44 2505.79 5720.56
Dec-15 708.00 2204614.96 3113.86 0.53 2748.53 5146.15
Dec-16 630.47 849340.90 1347.16 0.38 880.90 2343.17
May-17 655.47 2163917.80 3301.31 0.55 2609.00 4774.89
Aug-17 718.41 2352957.20 3275.23 0.66 3045.50 4619.55
Dec-17 761.93 2640389.20 3465.39 0.71 3340.60 4682.89
Dec-18 914.31 3139013.00 3433.21 0.88 4032.00 4606.79
Mar-19 891.42 2889992.00 3242.00 0.86 3983.00 4616.70

Source: NPCI. Volume and value are in million. Size refers to INR value of an average transaction.

One needs to look beyond debt and credit transaction volume to appreciate the extent and depth of digital payments in India. While, total value of monthly credit card transactions has increased eight folds (from Rs. 70554 million in April 2011 to Rs. 576511 million in March 2019) in as many years, the increase has been much larger (14 times) for value of monthly debit card transactions. But there are other two competitors to the card payments- e-wallets and UPI. The UPI helps one to instantly transfer funds between two bank accounts on a mobile platform. UPI is completely interoperable on the ‘send’ and ‘receive’ side. The transaction volume through UPI, launched in April 2016, has been growing at a phenomenal pace from a mere Rs. 69 billion in 2016-17 to a whopping Rs. 8.8 trillion in 2018-19- increase of 126 times in just two years (Table 3).  UPI has launched its upgraded version (UPI 2.0) in August 2018 which would further improve peer-to-merchant transactions. In the earlier version of UPI, payments could be made only from savings bank accounts. But under UPI 2.0, merchants are allowed to withdraw money even when there is no credit balance in their account- overdraft facility. Therefore, UPI has made peer-to-merchant transactions easier which is not a good news for the other digital payment platforms.

Table 3: Usage of RuPay and UPI

RuPay Cards UPI Transactions Cards E-Wallets
Year Volume Value(Rs.) Size (Rs.) Volume Value(Rs.) Size (Rs.) Value (Rs.) Value (Rs.)
2014-15 6.09 11270.00 1850.57 0.00 0.00 0.00
2015-16 35.64 50510.00 1417.23 0.00 0.00 0.00
2016-17 282.78 349290.00 1235.20 17.86 69470.00 3889.70 6582890 532420
2017-18 667.66 654320.00 980.02 915.23 1098320.00 1200.05 9190350 1086750
2018-19 1127.08 1175130.00 1042.63 5353.40 8769700.00 1638.16

Source: NPCI and RBI. Volume and value are in million. Size refers to INR value of an average transaction.

Growth in UPI indicates trouble for other digital payment methods (e-wallets, debit and credit cards). Popularity of e-wallets had gone up immediately after demonetization, but the e-wallet transaction volume dropped after launch of UPI. Customers who prefer payments through e-wallets point out that they do not want to provide direct access to their bank accounts and hence e-wallets act as an additional layer of security. But others, who use UPI for payments, mention that UPI is much hassle free and easier to operate. In 2016-17, UPI transaction value was 14 percent of e-wallets volume. But UPI has almost caught up with e-wallets in terms of value of transactions in just a year. Similarly, payments through cards (both debit and credit) was almost 100 times of UPI payments during 2016-17. The gap has significantly narrowed down to less than 10 times in 2017-18 (Table 3). If one looks at monthly data, things were more competitive. For example, while credit card transactions in April 2018 were about 1.5 times the UPI transactions, by February 2019 the value of credit card transactions were less than half of those done under UPI platform[8].

The Use of RuPay (debit) card has been on the rise. In 2014-15, it started with a modest value of Rs. 11.3 billion and it reached a volume of Rs. 1.2 trillion during 2018-19- a ten-fold increase in five years. Yet, the RuPay volume is about 20% of total value of debit cards transactions during 2018-19. RuPay has lot of potential to fight it out with multinational players like Visa, MasterCard.

Therefore, digitalization of finance is fast catching up in India and the real focus has shifted away from cards business to payment through mobile banking (UPI) and e-wallets. That does not mean that cash has lost its dominating position. Cash still rules in India.


*****

[1] The Bali Fintech Agenda, IMF Policy Paper. October 2018.

[2] Christine Lagarde, Managing Director, IMF.

[3] EY’s Fintech Adoption Index 2017

[4] Dr. Y.V. Reddy. RBI Annual Policy Statement for the year 2005-06

[5] Global Financial Inclusion Index, The World Bank

[6] UPI is a real-time payment system for facilitating inter-bank transactions.

[7] Announced on November 8, 2016

[8] UPI sets searing pace while e-wallets wobble. The Hindu,  April 14, 2019

Shape of Things to come in India’s Payments Systems: RBI’s Vision Document

An effective payment and settlement system is one of the key elements of a well-oiled financial system. It also fosters real sector transactions effectively and is an outcome of geography, technology, social factors and politics (Carstens, 2018).[1] Asia Pacific region is in the process to emerge as a digital giant in near future (Evans, 2019).[2]  It is in this context that the “Payment and Settlement Systems in India: Vision 2019 – 2021” released by the RBI on May 15 2019 assumes importance.[3]

            Aiming at empowering all citizens with access to a bouquet of e-payment options the Payment Systems Vision 2021 had the core theme of ‘Empowering Exceptional (E) payment Experience’. Five features of such a payment system have been emphasized in particular: (a) safety; (b) security, (c) convenience, (d) fast pace and (e) affordability. Earlier, the RBI constituted a High-Level Committee on “Deepening of Digital Payments” under the Chairmanship of Nandan Nilekani in January 2019. This Committee too submitted its report on May 17 2019. While it might have been appropriate that this Vision Document could have been released after the acceptance (or otherwise) of this Committee report, the RBI in a press release mentioned that it would examine the recommendations of this Committee and will dovetail the action points, wherever necessary, in its Payment Systems Vision 2021, for implementation.

            What are major constituents of this Vision? Does the Vision do justice to the current scenario of payment and settlement system in India? Is it capable of catering to the needs of an ever-growing economy? This present essay attempts to look into some of these questions.

Indian Payment System: Some Indicators

            To put the vision document in context, it is important to review the trends in payments system in India.

Aggregate Trends

            As far as the aggregate trend in payments system related indicators are concerned, India has experienced huge growth. Digital payment transaction turnover increased from 7.1 per cent of GDP in 2016 to 8.42 in 2018. The turnover in payment transactions too increased from 14.4 per cent of GDP in 2015-16 to to 15 per cent of GDP in 2017-18. Thus, the growth has taken place both in value and volume (Chart 1).

Chart 1: Trends in Aggregate Payments Indicators
 
Source: Online Database on India Economy, RBI.


                An analysis of the constituents of such digital payments reveals another interesting trend.  The aggregate digital payments can be segregated in terms of the following major heads:

  1. RTGS (Real time gross settlement payments system) comprising: (a) Customer Transactions; (b) Interbank Transactions; and (c) Interbank Clearing.
  2. System operated by the CCIL (Clearing Corporation of India Ltd) comprising:  (a) CBLO (collateralized borrowing and lending obligations); (b) Government Securities Clearing (viz., Outright, Repo and Tri-party Repo); and (c) Forex Clearing.
  3. Paper clearing of cheques.
  4. Retail electronic clearing (comprising (a) ECS (electronic clearing system) Debit; (b) ECS credit (including National Electronic Clearing Service or NECS); (c) EFT (Electronic Funds Transfer) / NEFT (National Electronic Funds Transfer); (d) Immediate Payment Service (IMPS); and (e) National Automated Clearing House (NACH)).
  5. Cards (comprising both credit and debit cards).
  6. Pre-paid payments instruments like mobile wallets.
            Table 1: Different Types of Payments: Volume and Value
Month/Year Customer RTGS Transactions Interbank RTGS Transactions CCIL Operated Systems Paper Clearing Retail Electronic Clearing Cards Prepaid Payment Instruments (PPIs) Grand Total
Volume (Million) Dec-2004 0.1 4.6 14.9 19.6
Dec-2005 0.1 113.5 7.3 18.7 139.4
Dec-2006 0.3 0.1 0.1 113.7 34.1 36.1 184.3
Dec-2007 0.4 0.1 0.1 124.3 18.5 28.3 171.7
Dec-2008 1.2 0.2 0.1 117.3 21.6 34.5 174.9
Dec-2009 3.0 0.2 0.1 117.7 24.8 35.9 181.8
Dec-2010 3.6 0.3 0.1 119.4 34.7 44.9 94.9
Dec-2011 4.7 0.4 0.2 107.1 42.0 501.9 3.1 659.3
Dec-2012 5.6 0.4 0.2 107.8 57.5 528.0 7.2 706.8
Dec-2013 6.6 0.4 0.2 107.1 100.1 628.6 10.8 853.8
Dec-2014 7.8 0.4 0.3 109.6 135.7 721.2 29.0 1003.9
Dec-2015 7.7 0.4 0.2 93.7 299.4 886.0 68.7 1356.1
Dec-2016 8.5 0.4 0.3 138.8 428.3 1162.4 261.1 1999.8
Dec-2017 10.6 0.3 0.3 96.4 470.0 1178.8 319.8 2076.2
Dec-2018 11.1 0.3 0.3 92.5 620.1 1460.2 441.8 2626.2
 Value (Rupees Billion) Dec-2004 7813.2 78.0 28.3 7919.5
Dec-2005 10382.0 9959.3 82.5 33.8 20457.5
Dec-2006 7144.3 10246.9 13594.8 10061.9 1009.4 76.1 42133.4
Dec-2007 14140.5 7911.0 20900.8 11494.3 316.2 65.9 54828.7
Dec-2008 17339.7 10714.4 30908.3 9369.5 345.5 69.8 68747.3
Dec-2009 26980.7 7764.0 32836.0 8334.9 491.9 79.4 76486.8
Dec-2010 34500.1 11525.6 31450.6 8747.0 1216.5 104.5 67603.7
Dec-2011 37737.4 14182.9 34175.7 8188.0 1830.9 1376.5 6.4 97497.8
Dec-2012 44120.2 13157.7 39703.6 7914.9 2887.2 1642.9 8.2 109434.7
Dec-2013 50502.7 13347.6 47819.0 8584.3 4308.8 1917.5 7.2 126487.2
Dec-2014 57669.3 11074.7 70943.4 7488.3 6044.4 2285.2 22.7 155528.0
Dec-2015 58712.6 10211.4 69114.6 6935.6 8880.0 2565.1 44.3 156463.7
Dec-2016 72702.6 11393.9 95947.7 7289.4 12683.2 1742.0 97.7 201856.5
Dec-2017 90557.8 10350.0 88062.7 6752.5 17464.7 3470.0 143.3 216800.9
Dec-2018 101338.6 15085.2 102273.2 6687.4 22268.7 4215.6 189.2 252057.9
Source: Online Database on India Economy, RBI.

            While the amounts are dominated by high value transactions comprising Customer RTGS Transactions, Interbank RTGS Transactions, and CCIL Operated Systems, in terms of volume, smaller transactions as captured by paper clearing of cheques, retail electronic clearing, credit and debit cards and prepaid payment instruments tended to dominate (Table 1).

Debit and Credit Cards

            The situation in case of credit and debit cards is most instructive in this context. The total value of credit card and debit card transactions as of end 2018 stood at Rs. 546.4 billion and Rs. 3669.2 billion, respectively; these are merely 0.5 per cent and 3 per cent, respectively, of aggregate deposits of scheduled commercial banks (Table 2). That is to say, retail penetration of these instruments is still quite low and there is ample scope of their increasing usage.

Table 2: Usage of Credit and Debit Cards: Volume (in Million) and Value (in INR Billion)
1. Credit Cards 1a) Usage at ATMs 1) Usage at POS 2) Debit Cards 2a) Usage at ATMs 2b) Usage at POS
Volume
(Mill)
 Value
(INR Billion)
Volume
(Mill)
 Value
(INR Billion)
Volume
(Mill)
 Value
(INR Billion)
Volume
(Mill)
 Value
(INR Billion)
Volume
(Mill)
 Value
(INR Billion)
Volume
(Mill)
 Value
(INR Billion)
Dec-2004 11.3 23.8 11.3 23.8 3.5 4.6 3.5 4.6
Dec-2005 14.6 28.7 14.6 28.7 4.0 5.1 4.0 5.1
Dec-2006 15.2 38.8 15.2 38.8 20.9 37.2 20.9 37.2
Dec-2007 20.3 53.6 20.3 53.6 8.1 12.3 8.1 12.3
Dec-2008 22.6 53.1 22.6 53.1 11.9 16.7 11.9 16.7
Dec-2009 20.5 55.1 20.5 55.1 15.4 24.3 15.4 24.3
Dec-2010 23.5 68.5 23.5 68.5 21.4 36.1 21.4 36.1
Dec-2011 28.3 85.3 0.2 1.1 28.2 84.2 473.6 1,291.2 444.2 1,242.4 29.4 48.8
Dec-2012 36.3 112.6 0.2 1.2 36.1 111.3 491.7 1,530.3 448.6 1,461.2 43.1 69.1
Dec-2013 45.9 136.6 0.3 1.5 45.6 135.1 582.6 1,781.0 530.4 1,699.0 52.3 81.9
Dec-2014 56.5 174.4 0.4 2.5 56.1 171.9 664.7 2,110.8 591.1 1,999.8 73.6 111.0
Dec-2015 69.9 214.7 0.5 2.8 69.4 211.9 816.1 2,350.4 708.0 2,204.6 108.1 145.8
Dec-2016 116.5 312.4 0.4 0.9 116.1 311.5 1,045.9 1,429.7 630.5 849.3 415.5 580.3
Dec-2017 124.5 422.0 0.7 3.3 123.8 418.6 1,054.3 3,048.0 761.9 2,640.4 292.4 407.6
Dec-2018 159.2 546.4 0.9 4.0 158.3 542.3 1,301.0 3,669.2 914.3 3,139.0 386.7 530.2


RBI Vision Document

            It is in this context that the RBI Vision document assumes much importance. Focusing on a two-pronged approach of (a) achieving exceptional customer experience; and (b) enabling an eco-system that will result in this customer experience, the Vision emphasized the following goals, viz., (a) enhancing the experience of Customers; (b) empowering payment System Operators and Service Providers; (c) enabling the Eco-system and Infrastructure; (d) putting in place a Forward-looking Regulation, supported by a Risk-focused Supervision. Thirty six goals posts of the Vision are grouped under the 4C’s: (a) competition; (b) cost; (c) convenience; and (d) confidence (Table 3).

Table 3: Goals-Posts For Payment System Vision 2021
Competition Cost Convenience Confidence
1. Self-Regulatory Organization for all PSOs.

2. Encourage and facilitate innovation in an environment of collaborative competition

3. Feature phone- based payment services.

4. Off-line payment solutions.

5. USSD-based payment services.

6. Global outreach of payment systems.

7. Fostering innovation in a responsible environment through regulatory sandbox.

8. Review of membership to centralized payment systems

9. Inter-regulatory and intra-regulatory co-ordination

10. Benchmarking India’s Payment Systems

1. Accessible, affordable and inclusive services

2. Review of corridors and charges for inbound cross border remittances

3. Inter-operability and building capability to process transactions of one system in another system

4. Acceptance infrastructure to address supply-side issues

5. System capacity and scalability

6. Increasing LEI usage for large value cross border payments

7. Regulation of payment gateway service providers and payment aggregators

1. Harmonizing TAT for resolution of customer complaints

2. Setting up a 24×7 helpline

3. Enhancing awareness

4. Conducting customer awareness surveys

5. Internal ombudsman for digital payments

6. National settlement services for card schemes

7. Enhanced availability of retail payment systems and a wide bouquet of offerings

8. Widen scope / use of domestic cards

9. Explore adoption of newer technologies including DLT for enhancement of digital payment services

10. E-mandates / Standing Instructions for payment transactions

1. Increased coverage of the Cheque Truncation System

2. Increased scope and coverage of the Trade Receivables Discounting System (TReDS)

3. Geo-tagging of payment system touch points

4. Contact-less payments and tokenization

5. Enhanced security of mobile-based payments

6. Oversight for maintaining integrity of payment systems

7. Third party risk management and system wide security

8. Framework for collection of data on frauds in payment systems

9. Framework for testing resilience of payment systems

Abbreviations: PSO: Payment System Operators; USSD:  unstructured supplementary service data; LEI: Legal Entity Identifier; TAT: Turn Around Time.

Source: RBI

Way Ahead

            The Vision document appears to be comprehensive as well as ambitious. Aiming at achieving a highly digital and cash-lite economy, the Vision perhaps emphasized that the RBI needs to adopt a minimalist intervention strategy without compromising on the safety and security aspects of the transactions. Is it too ambitious in expecting that the number of digital transactions would increase to 8,707 crore by December 2021? Will it solve the traumatic experience of getting the KYC norms fulfilled by an average e-wallet user? Are the internal trade-offs between the objectives of the 4C’s get settled? Will it democratize the payments eco-system?  Will the system become a hostage of a few big players in the e-payments space? Why is it silent on some of the contemporary issues like crypto-currencies? Hopefully, clarity will emerge to such questions in the days to come.

*******

[1] Carstens, Agustín (2018): “Money and payment systems in the digital age”, Speech by General Manager, Bank for International Settlements Finance and Global Economics Forum of the Americas University of Miami Business School, November 1, 2018.

[2] Evans, Michelle (2019): “Digitalisation in Asia How One Region Is Shaping Worldwide Trends”, Euro Monitor International.

[3]Available at  https://rbidocs.rbi.org.in/rdocs/PublicationReport/

Dividend Delight or Poison Pill? The Curious Case of Mindtree Special Dividend!

On 17th April 2019, the Board of Directors of Mindtree Limited, an Indian publicly listed IT and outsourcing company, declared an interim dividend of 30% (Rs. 3 per share). The Board of Directors also announced a final dividend of 40% (Rs. 4 per share) for the financial year 2018 – 19, and a special dividend of 200% (Rs. 20 per share). Since the company had 164,214,041 shares outstanding, this meant that the company was in effect announcing to return INR 443 Crores of cash back to the shareholders. This amount was record high with respect to the recent dividend pay-out history of the company (Please see Table 1).

Table 1: Dividend Pay-out History of Mindtree Ltd.

Announcement Date Effective Date Dividend Type Dividend (%) Remarks (DPS)
09-04-2019 25-04-2019 Interim 30 Rs. 3 per share
02-01-2019 23-01-2019 Interim 30 Rs. 3 per share
03-10-2018 25-10-2018 Interim 30 Rs. 3 per share
18-04-2018 09-07-2018 Final 30 Rs. 3 per share
06-04-2018 25-04-2018 Interim 20 Rs. 2 per share
04-01-2018 24-01-2018 Interim 20 Rs. 2 per share
04-10-2017 02-11-2017 Interim 20 Rs. 2 per share
25-10-2017 02-11-2017 Special 20 Rs. 2 per share
24-04-2017 10-07-2017 Final 30 Rs. 3 per share
21-03-2017 07-04-2017 Interim 20 Rs. 2 per share
03-01-2017 25-01-2017 Interim 20 Rs. 2 per share
30-09-2016 28-10-2016 Interim 30 Rs. 3 per share
18-04-2016 08-07-2016 Final 30 Rs. 3 per share
15-03-2016 11-04-2016 Interim 20 Rs. 2 per share
31-12-2015 25-01-2016 Interim 40 Rs. 4 per share
29-09-2015 21-10-2015 Interim 40 Rs. 4 per share
02-07-2015 21-07-2015 Interim 30 Rs. 3 per share
16-04-2015 11-06-2015 Final 100 Rs. 10 per share

Source: Moneycontrol.

Interestingly, the share price did not move much in either direction in response to the record high dividend announcement. For example, the share price closed at INR 972.45 on 16th April, opened at INR 979 on 18th April (0.67% higher than previous close), and traded at an overall average price of INR 975.73 on that day (0.33% lower than opening price). However, the traded volume was much higher on that day (INR 2.2 Crores), almost twice the median traded volume of the stock in the last 52 weeks. So, how was the market interpreting the dividend announcement news? Was the abnormally high dividend pay-out being interpreted as a good news or a bad news for the stock?

Information Content of Dividend Announcements

A quick recap of the corporate finance textbook chapters would remind us of some of the theories related to dividend decisions, which suggest that managers usually remain reluctant to make changes in their dividend pay-out policies, which they feel might have to be reversed in the future. Usually, the managers try to ‘smoothen’ the dividend distributions, avoiding dividend cuts or unsustainable dividend increases in the process. Therefore, dividend changes usually follow shifts in long-run sustainable earnings, rather than transitory changes in earnings. As a result, there is higher information content in dividend changes, rather than dividend levels of fixed pay-out policy continuations. In other words, the signalling power of dividend changes related announcements is far stronger than dividend continuations related announcements. More specifically, markets usually interpret dividend cuts as bad news and react negatively to it, while significant dividend increases are interpreted as good news, and investors usually react favourably to such dividend increase announcements, as such dividend changes tend to indicate the investors about the managerial beliefs regarding future cash flows and earnings of the company.

Therefore, in the case of Mindtree special dividend, since the dividend amount declared was significantly larger than the historical average pay-out, ideally it should have been welcomed by the investors as a strong positive signal about the future cash flows and earnings potential of the business, leading to a signification jump in the stock price. However, we do not find any such favourable response of the capital market to the announcement of the Mindtree special dividend (Table 2). Hence, it is reasonable to be curious about the speciality (or non-speciality) of this ‘special dividend’, which did not lead to a significant share price reaction in the secondary markets (Table 3). So, are the investors interpreting the information content in the Mindtree special dividend announcement differently than any other special dividend announcements?

Table 2: LTM Share Price Performance

Source: NSE website

Why Did Mindtree Announce the Special Dividend?

            Clearly, if Mindtree would have announced the 200% special dividend to signal the investors about the optimistic scenario of future cash flows and earnings potential of the company and the investors believed in the information signal, we should have expected the optimism to reflect in the share price in the form of an upward price correction. The absence of such an upward price movement tells us that either the story is different, or the listeners are not buying the story of the story-teller at its face value. In this regard, the opinion of the management of Mindtree (story-teller’s version) is that the special dividend is a way to celebrate the 20th anniversary of the company, and reward the shareholders in having reached an important milestone of US$ 1 billion in revenue in FY2019. But it is perhaps difficult to believe in this version of the story for more than one reason. And hence or otherwise, the investors and analysts have been looking out for other plausible reasons and rationale behind the generous dividend pay-out plan proposed by the management of Mindtree. We will have to wait for a while to know about the genuine motivation behind the special dividend pay-out plan, but we can certainly speculative our own versions as an outside spectator.

The Context of the L&T – Mindtree Hostile Takeover Bid

            It is important to note that the special dividend announcement has been made at an important juncture, barely a month after L&T announced its plans to takeover Mindtree by acquiring 20.32% stake from Café Coffee Day founder Mr. V. G. Siddhartha, another 15% from the open market and subsequently, buying another 31% through an open offer. At an average acquisition price of INR 1,000 per share, this translates to a financial transaction costing L&T about INR 11,000 Crores. Since this is an ‘unsolicited open offer’ bid from L&T, Mindtree promoters are clearly opposed to the proposed deal which is being viewed as hostile by the Mindtree management. If successful, L&T’s Mindtree acquisition would become the first hostile takeover in the Indian IT industry. Therefore, it is reasonable to view the Mindtree special dividend announcement as a poison-pill manoeuvre to resist the unsolicited takeover bid by L&T. Hence, let us examine further, if there is any merit in this line of argument.

Table 3: Investor Reactions around Mindtree’s Special Dividend Announcements

Company Mindtree L&T (Parent Co.) L&T Infotech
Date Return (%) Volume (x) Return (%) Volume (x) Return (%) Volume (x)
11-Apr-19 0.66 0.96 0.47 1.53 0.64 0.40
12-Apr-19 -0.10 0.39 -1.25 1.34 -0.76 0.83
15-Apr-19 0.41 0.68 -0.29 0.94 -1.43 3.52
16-Apr-19 -0.74 0.58 1.79 1.58 0.53 0.79
17-Apr-19 Mindtree Special Dividend Announcement
18-Apr-19 -0.41 1.96 -1.51 1.26 1.15 1.00
22-Apr-19 0.79 0.80 -0.04 1.51 1.05 0.64
23-Apr-19 -0.08 0.41 -0.88 0.97 1.09 0.59
24-Apr-19 0.41 0.28 0.92 0.85 0.74 0.39
25-Apr-19 1.02 0.54 -0.41 1.40 0.72 1.01
26-Apr-19 -1.38 0.32 0.22 0.85 -0.05 0.95
30-Apr-19 0.55 0.60 -0.71 0.92 0.41 0.55
02-May-19 0.02 0.28 0.75 0.96 0.26 0.73
03-May-19 -1.15 0.41 0.36 0.60 -2.43 2.57
06-May-19 1.18 1.38 -0.80 0.73 1.24 0.64
07-May-19 -0.18 1.07 1.02 1.26 0.85 0.70
08-May-19 0.06 3.71 -0.46 0.78 -1.13 1.89
09-May-19 -0.01 3.26 -0.29 1.19 -0.70 1.14
10-May-19 -0.52 0.18 -0.07 0.71 0.78 0.70

Note: Volume (x) indicates multiple of the median traded volume of the stock

What is a Poison Pill Manoeuvre? Insights from the M&A and Corporate Strategy Booklet

Poison pills commonly refer to popular defence mechanisms against hostile corporate takeover attempt, whereby certain corporate actions are taken by the management of the target company with an intention to make its own stock or business relatively less attractive to the potential acquirer, so that the same acquisition price appears relatively costlier once the poison pill strategy is implemented. Academicians are divided in their assessment of the overall impact of such poison pill strategies for the shareholders. Proponents argue that poison pill strategies help the board of directors to negotiate the best control premium for their shareholders in such hostile acquisitions. However, critics argue that such strategies may eventually make the hostile takeover too costly, in the process denying the shareholders their rightful gains from these control transactions. Moreover, such poison pills are supposedly often used by the management to entrench their own personal interests in retaining their control in the target company and maintaining their compensation benefits rather than being pursued with the genuine interest of shareholder wealth maximization. It may also be pertinent to ask if a special dividend announcement can be an effective poison pill strategy in the given context, irrespective of its net impact on the shareholder wealth.

Dividend Delight or Poison Pill? Analyzing the Specialities of Mindtree’s Special Dividend

            There are a number of things that we may take into consideration in evaluating the net impact of the special dividend on the shareholder wealth as well as its effectiveness in reducing the chances of success of L&T hostile acquisition. First, the total dividend announcement (including the 200% special dividend) translates to an amount of INR 440 Crores to be distributed from the cash reserves of the company back to its shareholders. It is important to consider the effect of this cash outflow on the value of the firm, given its current investment plans and future growth aspirations. The dividend policy of Mindtree clearly states that the company will endeavour to maintain consistent dividend pay-outs to reward its shareholders, keeping in consideration the profitability and future cash flow needs of the business and its future growth and profitability outlook. Moreover, the dividend policy is expected to be in line with objectives of long-term shareholder value creation and sustainable corporate growth. The management of the company will clearly need to justify to its shareholders (and to the regulator in response to their recent query to L&T) that the special dividend announcement is indeed in line with their own stated dividend policy objectives, and is not detrimental to the long-term shareholder interests and sustainable corporate growth of the company.

            Second, since the promoters own 13.3% stake in the company, they are expected to receive INR 59 Crores out of this declared dividend package. Hence, the promoters are also among the beneficiaries of this generous dividend distribution plan. However, this dividend proposal needs to be approved by the shareholders in an AGM scheduled in July. Hence, it is important that the management is also able to convince its non-promoters about the merit of this special dividend. Interestingly, if L&T ends up with 66.32% stake in Mindtree after the closing of the open offer, even L&T will be eligible to receive almost two-third portion of this generous dividend pay-out amount. Theoretically, L&T can re-invest this money back in Mindtree to undo the impact of this special dividend pay-out plan, although that is likely to be highly inefficient due to tax and transaction cost related reasons, besides other regulatory requirements.

            Third, assuming the purpose of the special dividend plan is to resist the hostile takeover plan of L&T by increasing the transaction cost of the acquirer, the muted response of the investors to the special dividend announcement plan has clearly not been successful in raising the acquisition price of L&T. In other words, it is plausible that the investors have perhaps been wise enough to see through the nuances of this record dividend pay-out plan, and differentiate it from the signalling effect of a typical special dividend announcement by a corporate in the absence of any hostile takeover context. Fortunately or unfortunately, the added wisdom and the mature market response in this case is likely to improve the chances of success of the hostile takeover, depriving the Mindtree shareholders of an eventually higher capital gain resulting from the sale of shares to L&T at an even higher price in the scheduled open offer.

            In summary, a special dividend announcement is often a reason for investors to cheer, when it also conveys the optimistic managerial beliefs about the future cash flows and earnings potential of the company. However, when the context of a hostile takeover bid is added in the backdrop of such a special dividend announcement, where the acquirer is trying to acquire a controlling stake in the target against the intent of the entrenched managers, the net impact of the dividend bonanza on the shareholder wealth of the target company is not necessarily always positive. The capital market regulator is fair in seeking additional clarifications from L&T regarding the policies of Mindtree, including its dividend policies, for a better understanding of the purpose of the generous dividend pay-out plan, and its eventual consequence for the Mindtree shareholders.

The Unending Pain of Student Debt: effect of risk preferences

The dangerous and sometimes disastrous consequences of student loan debt are well known. We know for a fact that students with high debt levels are less likely to be entrepreneurs, less likely to own a home when they are 45, and less likely to find an ideal job.  The value of a college education is therefore reduced dramatically for those who need to service the debt to pay for it.

However, until recently, few have studied the long-term effects of student debt on the net worth of families burdened by the loans.  With my colleagues, Birzhan Batkeyev and Karthik Krishnan, I recently set out to address this gap—showing once again that the very loans that are supposed to help students get a leg up on their financial future, hamper them in myriad ways instead.

Our groundbreaking analyses show that student loans have a causal effect on personal investment portfolio composition and that, in turn, impacts household net worth dramatically.  Our analysis shows that individuals who carry student loan debt are much more likely to keep their investments in lower paying and lower risk alternatives than they are to invest heavily in higher return investments such as stocks or mutual funds (risky assets). The basic distribution of this can be seen in Fig. 1 below, which shows that the average holdings drops by 37% with student loans.

Figure 1: Percentage holding of Risky Assets by College Education & Student Loans

Though stocks and mutual funds provide better return in the longer term, they are also riskier in the short term. The very heavy consequences of missing a student loan debt payment or defaulting on a loan means that families burdened with student debt are often reluctant to risk the budget padding that cash on hand allows them in order to invest in high risk investments. As a result, when they are young, student debtors are not making the investments necessary to amass a nest egg, instead preferring to keep their money in less risky investments—such as bank savings accounts. This tendency can have dramatic effects on a family for generations.

For example, our research shows that student debt leads to suboptimal investments in personal financial assets. The lower investment in high-earning assets leads to missed opportunities and the lack of ability to increase one’s wealth through prudent investments.

Given the recent strong performance of the stock market, this has had disastrous consequences on the net worth of families that carry student loans—consequences that will likely have generational effects—creating a vicious cycle where one generation’s student loans keep another generation in debt as they have to borrow to similarly educate themselves.

We studied students who had enrolled in college before the enactment of the 1998 Higher Education Amendments Act (HEA) to see how their subsequent portfolio allocations responded to their student debt levels.

The 1998 HEA made student debt from federal loans effectively non-dischargeable through personal bankruptcy. In our study, students with non-dischargeable loans invested less in stocks and bonds and more in low return-low risk assets. This “natural experiment” indicates that one can get permanently saddled with student debt obligations regardless of their financial situation.

What’s more, our results illustrate that these effects of student loans of personal portfolio investment and on net worth last well beyond the typical ten-year time period that a student loan matures.

Our calculations suggest that a family without student debt, for example, who invest $12,000 in stock and bonds each year, would have a net worth of $831,076 by the time their children were ready for college in 20 years, whereas for the family with student debt the corresponding net worth would be $664,860. That implies that over a 20-year-period, households with student debt would have 14 percent lower net worth than those without student debt. Figure 2 plots this decline in net worth over the investment horizon.

A similar family saddled with student debt that was unable to make a high-return allocation in their investment portfolio would find that they had significantly fewer assets to fund their retirement accounts and for the payment of their own children’s tuition.  And thus, a college education which was supposed to set up an individual for upward mobility, becomes instead, a generational drag on income production.

The fix for this is issue complex and will require action at a policy level as well as more innovative solutions from the private sector.  For example, recent inroads into redefining student loans as more flexible payment instruments (such as Income Share Agreements or ISAs) could potentially totally alter the huge burden of student debt. Other fixes, at least for the short to medium term, include more transparent information on career and salary outcomes after school, and clear calculation of how long one might be able to pay off their debt after graduation if they choose a particular major at a particular school. More flexibility in student loan repayment options can also help.

Clearly, this is another reason to view negatively the effects of student loans and the harsh terms under which they are granted.  Fixing this problem, is doable, but it will take the concerted efforts of policy makers, students and educators alike.

Shares with Differential Voting Rights

The Securities and Exchange Board of India (SEBI) has recently issued a consultation paper on ‘Issuance of shares with Differential Voting Rights (DVRs)’[1] by companies registered in India. SEBI has invited public comments on this issue. Should India follow the international practice by allowing firms to issue shares with disproportionate voting rights? Once allowed, firms will be entitled to issue shares with ownership rights different from cash flow (economic) rights. To put it simply, an investor holding a DVR may have higher control (voting) rights and lower cash flow (dividend) rights. For example, Mark Zuckerberg (with a small group of insiders) owns 18 percent of shares of Facebook (cash flow rights), but these are special types of shares (class B) which entitle the owners 10 votes per share (control rights). Such granting of disproportionate control rights to a section of the shareholders is made possible through a dual class structure. So, Facebook has issued two types (class) of common shares- one for the founders (class B) and the other (class A) for all other shareholders where each share has one vote. Google goes a step further. It has three different classes of common (equity) shares- class A (normal class with one vote per share), class B (the gold class with 10 votes per share), and class C (the cattle class with no voting rights). Facebook and Google are not alone in this game. A report[2] mentions that a year ago, 355 of the companies in the Russell 3000(an index which tracks the performance of the 3000 largest U.S-traded stocks) had a dual voting-class structure.

SEBI has in the past permitted listing of shares with ‘inferior voting rights’ but prohibited shares with ‘superior voting rights’. Later in 2009, SEBI had prohibited issue of any form of DVRs. SEBI, through this consultation paper, proposes that stock exchanges should now allow issue of shares with differential voting rights. This is to bring the SEBI regulations at par with the provisions of the Companies Act, 2013 which allows every company registered in India to issue shares with DVRs. The Companies Act, 2013 provides a cap on the number of shares with DVRs that can be issued by any company to 26% of the total post-issue capital. This is not a small size- refer to the Facebook example. Incidentally, shares with DVRs cover both inferior and superior voting rights issuances. Though the amendments in the earlier Companies Act in 2000 and later the new Companies Act (2013) allowed companies to issue DVRs, only a handful of companies has actually issued DVRs. Major reason for such a poor show could be the heavy discount at which  DVRs trade compared to the ordinary shares.  For example, Tata Motors ordinary shares closed at Rs. 180.20 on March 20, 2019 when the DVR of the same company closed at Rs. 89.20- a whopping discount of 50 percent. It was not just a bad day for the DVR shares. Six months ago, the discount of Tata Motors DVRs was 52 percent.

Notwithstanding the reluctance of listed and stable companies in DVRs, the new generation high-growth early stage companies are craving for such options in raising new capital. In fact, one argues that in the absence of such an enabling provision in the capital market regulations, startups still depend to a large degree on private equity market for much-needed funds. SEBI and the stock exchanges in India have been trying since the past few years to attract startups and young companies to list in main or SME platform of the exchanges to raise risk capital. But, among many other factors, one of the major bottlenecks was dilution of ownership of the founders. Any founder of a startup does not want to significantly dilute control rights at the early stage when the firm is growing at breakneck speed. Since SEBI presently prohibits issue of shares with DVRs, the public stock market is therefore not a lucrative option for the startups. Flipkart, for example, had in the past thought of listing in Indian stock exchanges and yet decided against domestic listing. Rather it preferred strategic investment as a better alternative for the exit of existing investors.

SEBI, through this proposal, seems to address the dilution worries of the technology companies. Is it a right call, given the experience of other markets? Let us explore.

SEBI’s Recommendations

Let us quickly list down the broad suggestions of the regulator in this regard. The consultation paper is quite comprehensive and the DVR group of the SEBI which was entrusted with the responsibility of preparing the note has done a thorough job. The paper covers experience and regulatory actions of other countries, academic findings, stock market performance of Indian firms which have issued DVRs, and extant provisions of various applicable laws in India.

A company can have three class of equity shares- ordinary equity shares, equity shares with fractional voting rights (FR), and equity shares with superior voting rights (SR). There can be only one type of FR and SR. SEBI, in the consultation paper, has made separate recommendations for listed and unlisted companies.

Listed firms (more than one year old since listing) can issue only FR shares and these shares cannot ordinarily be converted into ordinary equity shares. The fractional voting rights for any holder of FR shares cannot exceed 1:10 (I.e., any one holding 10FR shares will have one vote). As a compensation for inferior voting rights, FR shares may get additional dividend. The face value of FR shares is same as ordinary equity shares. FR shares can be extinguished only though buyback by the company or reduction of capital. FR shares can be converted to ordinary equity shares only under a scheme of arrangement (i.e. M&A).

SR shares can only be issued to the promoters of a company by an unlisted company. Such an unlisted company can only issue ordinary equity shares at the time of IPO. In other words, once listed, a company is not allowed to issue SR shares. It can subsequently issue FR shares. The SR shares, after listing, can have a maximum voting ratio of 10:1 (ten votes for every SR share held). Promoters with SR shares cannot have more than 75% voting rights under any circumstances. Unlike FR shares, SR shares shall be eligible for the same dividend as ordinary equity shares. Clearly, SR shares are structured to provide promoters of a company absolute control over the company once it gets listed.

In order to ensure that owners of SR shares do not enjoy the superior voting rights perpetually and hence indulge in managerial entrenchment, the consultation paper recommends two restraining provisions:

Coat-tail Provisions: In case of certain important decisions that require shareholders approval, the SR shares (post-IPO) shall be treated as ordinary equity shares in terms of voting rights (i.e., 1:1). Such decisions include appointment/removal of an independent director and or auditor, change in the control of the company, extension of validity of SR shares beyond the initial period of five years.

Sunset Clause: SR shares will get converted into ordinary equity shares after five years of listing of the company. This privilege can be extended by a maximum of another five year term. When SR shares are finally converted, each SR share will be converted into one ordinary equity share.

SEBI has also highlighted the required changes that need to be made in several other laws in order to consider SR shares as valid financial securities. For example, the SEBI ICDR (Issue of Capital and Disclosure Requirements) regulations should be amended to allow any listed company to issue dual class shares. Similarly, the SEBI Takeover Code needs to be amended to ensure that any conversion of SR shares into ordinary equity shares do not necessitate open offer, provided there is no change in control.  A challenge for SEBI would be to get the Ministry of Corporate Affairs (MCA) agree to amend the Companies (Share Capital and Debenture) Rules, 2014 in order to allow unlisted companies without profitability track record to issue DVRs.

A Critique

A basic criticism of dual class shares is it violates central principle of ‘one share one vote’ norms of corporate governance. Holding SR shares allows some group of shareholders to control boardroom decisions. Other criticisms of dual class shares include higher management entrenchment (a matter also recognised by SEBI), large executive compensation, and value-destroying acquisitions[3].

 Was there any need for SEBI to enable listing of dual class shares? Stock markets do not favour complex or non-transparent securities. In the past, companies in the West issued tracking stocks to fund acquisitions. Instead of a legal separation, tracking stock allowed issuing companies to create accounting separation of the merged/acquired entity. Stock market did not like it. Stock market reactions to dual class shares (particularly FR shares) have most of the times been negative or at best muted in many countries. Since SEBI’s recommendation prohibits issue of SR shares, investors in FR shares will only be penalised with huge discount (see, the Tata Motors example). A supposedly higher amount of dividend for FR shares (compared to ordinary equity shares) would not be able to offset the market price discount. In a way even the existence of ordinary equity shares and FR shares in the market provides ordinary equity shares superior voting rights. So, consider a promoter-run listed company which issues FR shares to raise money and thus relatively ensures higher voting rights for the promoters at the cost of the FR shareholders. Therefore, even with the proposed prohibition on issue of SR shares, ordinary equity shareholders would enjoy superior voting rights.

There are several arguments in favour of dual-class structure. SR shares offer protection against proxy contests initiated by institutional or other short-term investors. Look at the recent episode in HDFC where proxy voters had almost ousted Deepak Parekh from the Board of the company. Thus, SR shares would help promoters of early-stage companies concentrate on growth without bothering much about stock market reactions. Innovative entrepreneurs, mostly in the technology-driven startups, do not favour myopic actions only to satisfy financial investors whose sole objective is to earn superior returns in the short-run. Dual-class shares provide much required immunity to the entrepreneurs in the initial years.

When a hitherto unlisted firm decides to enter stock market with IPO, the promoters’ cash flow (dividend) rights would anyway be lower at that stage with venture capital and private equity firms holding majority of ordinary equity shares. Promoters would protect themselves with SR shares.

The proposed DVR regulations do not allow a listed company to issue non-voting shares (FR shares have voting rights), though the Companies Act, 2013 allows issue of non-voting shares. The consultation paper is silent on what happens to those non-voting shares when a company goes for an IPO.

A Possible Alternative?

Do not advocate different status for equity shareholders. Instead of DVR shares, SEBI should promote issuance of preference shares. Startups regularly issue compulsorily convertible preference shares (CCPS) while raising money from venture capital firms. Hence, SEBI should urge MCA to prohibit issue of SR equity shares to promoters by unlisted firms. They should rather issue CCPS to non-promoter investors. The CCPS can have a conversion period of five or more years. CCPS will generally be converted into ordinary equity shares.

Similarly, instead of FR shares, SEBI should prescribe issue of non-convertible cumulative preference shares by listed firms. The advantages with preference shares are many: (a) there will be no comparison with ordinary equity shares when one looks at stock market performance of preference shares as these are two different types of shares; (b) preference shares are generally considered as bond surrogates as most of its return comes from dividend yield and hence investors in these shares would be happy with a generous and definitive dividend; (c) unlike FR shares, non-convertible preference shares will be redeemed; (d) unlike dual class shares, there will be no need for issuing additional preference shares whenever a company decides to issue bonus or rights shares; (e ) issue of preference shares would protect the promoters of unlisted companies with same immunity as they would get with SR shares; (f) this enabling provision may create a market for preference shares which hardly exists in India; (g) the face value of preference shares may be delinked from that of ordinary equity shares; (h) there will be no need of restrictive provisions like coat-tail provision and sunset clause; (i) the MCA need not be persuaded to amend provisions in the Companies Rules as proposed by SEBI; and (j) the burden of dividend distribution tax will be same as with SR and FR.

The regulations for issue of preference shares already exist in the SEBI (Issue and Listing of Non-Convertible Redeemable Preference Shares) Regulations, 2013. The preference shareholders would not enjoy any voting rights and hence such instrument will protect the interests of promoters of a company from dilution of control rights till such time the CCPS get converted into equity shares. Only drawback with non-convertible preference shares (NCPS), compared to the FR shares, is the requirement of creation of Capital Redemption Reserve in accordance with the provisions of the Companies Act, 2013. NCPS are better than FR shares in three ways: (i) the issuing company will be required to set aside a part of profit (before declaring dividend) as capital redemption reserve and thus would be restrained on the amount of dividend that can be paid to ordinary equity shareholders; (ii) the finite life of NCPS would discipline the incumbent management as redemption of the paid up capital would be a contractual obligation; and (iii) the expectations of investors in preference shares are quite different from equity shareholders. Thus, there is no need for dual-class structure and there should be only one class of listed equity shares. Investors as well as the founders may be happier with this alternative.


**********

[1] SEBI Consultation Paper issued on March 20, 2019. Accessed from www.sebi.gov.in on March 21, 2019

[2] Www.cnbc.com/2018/03/20/shareholders-wont-force-zuckerbergs-hand-in-Facebook-management.html

[3] Vijay Govindarajan, Shivram Rajagopal, Anup Srivastava, and Luminita Enache, Should Dual-class Shares be Banned?. Harvard Business Review. December 03, 2018

Cash Holdings and Equity Mutual Fund Performance

Cash is a very important constituent of actively managed mutual funds. At the end of 2017, the total assets invested worldwide in actively managed open-ended mutual funds is in excess of USD 49 trillion. This is more than double of their 2008 levels. More importantly, in 2017 alone, the total net assets (TNAs) of these funds soared by about USD 9 trillion. Of this, more than USD 22.1 trillion is invested in funds operating in the United States, more than USD 17.7 trillion is invested in European Union domiciled funds and the Asia-pacific region has USD 6.5 trillion in TNAs.[1] More importantly, from March 2008 to June 2018 TNAs in Indian mutual funds have grown from INR 5.21 lakh crore to INR 23.45 lakh crore.[2] At the same time, Indian mutual funds hold 6.71 % of TNAs in cash on an average, whereas that of their US and European counterparts hold cash in the range of 3% to 3.5%. The average cash holding of top five Indian fund houses on the basis of market share is shown in Table 1. Except for ICICI Prudential AMC with a cash holding of 14.82%, all other funds have a cash holding less than 5%.

Table 1: Top 5 Indian Mutual Fund Houses and their Cash Holdings as on Dec-2018
AMC Market Share Equity(Cr) Cash(Cr) Cash Holding (%)
ICICI Prudential AMC 13.25% 61482 9110 14.82
HDFC AMC 13.10% 80744 3579 4.43
Aditya Birla Sun Life AMC 10.64% 65353 3185 4.87
Reliance Nippon Life AMC 10.28% 64327 2538 3.95
SBI Funds Management 9.96% 110003 3482 3.17

Data Source: ACE Mutual Funds, Author’s own computations

However, there are some funds such as ICICI Prudential Value Fund, IDBI Focused 30 Equity fund, Tata Value Fund, etc. as shown in Table 2 have a very high cash holdings.  These values are surprising as we expect that the funds in which we buy mutual fund units to invest all our money optimally in well-diversified instruments as per the investment objectives of the fund. Cash holdings differ significantly even among the funds which are similar and compete with each other.

Table 2: 10 Mutual Fund Schemes with High Cash Holding
Scheme Name Average Cash (INR Crore) Average Equity (INR Crore) Average Cash Holdings (%)
L&T Emerging Opp Fund-I-Reg(D) 54 336 17
Quant Small Cap Fund(G) 0.04 0.43 18.54
Sundaram LT Tax Adv Fund-Sr IV-Reg(G) 5 24 19
Quantum Long Term Equity Value Fund(G) 97 525 21
Tata Value Fund-Sr-2-Reg(G) 44 212 21
L&T Emerging Opp Fund-II-Reg(D) 34 172 21
Tata Multicap Fund-Reg(G) 296 1155 26
L&T Focused Equity Fund-Reg(G) 105 402 27
IDFC Equity Opportunity-5-Reg(G) 121 455 28
ICICI Pru Value Fund-19(G) 464 1490 32

      Data Source: ACE Mutual Funds, Author’s own computations

Mutual funds need to hold cash for various purposes. Mutual funds in the course of their investment business incur significant costs in the way of transaction costs, commissions and any other expenses in the day to day operations. Mutual funds generally have to meet the expected redemptions from investors as their one of the important motivations to put their money in mutual funds is due to the liquidity factor. Hence, holding cash helps the fund managers to overcome redemption pressure. Mutual fund managers are paid very high to manage the fund portfolio and extract maximum returns. In this process, they always look for the best deals. These deals in the stock market do last long or are not available every time. The managers have to act swiftly when there is an opportunity available and that is when cash holdings come in handy. In the times of high inflation, cash is not very attractive. However, when the markets are bearish, cash looks exciting as the mutual fund managers have the option to convert the fund securities into cash or risk-free assets such as government bonds as a precautionary measure and wish to use them to make attractive deals when the market turns bullish.

As discussed above, on the one hand cash holdings are important for mutual funds but they are extremely costly on the other hand. Lower realized returns from cash will impact the mutual fund performance. Holding excess cash to make good deals in the event of market downturn may have adverse effects. It has been documented in the academic research that managers have poor market timing skills and hence their attempts to use cash for market timing do not produce the desired profits.[3] Given the different levels of cash holdings by various equity mutual funds in India, we examine if the level of cash holding impacts their performance. In Table 3, we report the top 5 and bottom 5 mutual funds based on performance along with their average cash holdings for the period 2014 to 2018. As seen from the table there is no clear relationship between cash holdings and performance[4].  There are funds with very high performance and less cash holdings and also low performance with high cash holdings and vice-versa.[5] Hence, from this we can understand that cash holdings may not be the only reason for a fund to perform poorly and vise-versa.

Table 3: Cash holding vs Performance of Top 5 and Bottom 5 Mutual Funds
Scheme Name Average Cash Holding (%) Average
Return (%)
Sundaram Small Cap Fund(G) 1.78 32.17
Mirae Asset Emerging Bluechip-Reg(G) 2.95 32.37
Canara Rob Emerg Equities Fund-Reg(G) 3.12 33.82
Reliance Small Cap Fund(G) 4.88 34.37
SBI Small Cap Fund-Reg(G) 6.14 37.98
ICICI Pru Value Fund 27.09 -6.92
Union Largecap Fund-Reg(G) 4.14 -5.56
Axis Emerging Opp Fund-2-Reg(G) 5.34 -5.21
Tata India Pharma & Healthcare Fund-Reg(G) 6.41 -4.16
Sundaram TOP 100-Sr VII-Reg(G) 2.80 -3.94

Data Source: ACE Mutual Funds, Author’s own computations

Based on my earlier discussion and also the numbers in the tables, we should not invest in mutual funds with more cash in bearish markets in the hope that they will show abnormal performance. On the other hand, if we don’t have any view on the current as well as future stock market states, and hence invest in funds with higher cash holdings may still make the mistake of making loses. This is because we should understand that no manager can time the market consistently and if any manger or mutual fund thinks otherwise, they are miscalculating their abilities.


************

[1] 2018 Investment Company Fact Book retrieved from https://www.ici.org/pdf/2018_factbook.pdf

[2] Authors own computations. Data source – ACE Mutual Funds.

[3] Mikhail Simutin; Cash Holdings and Mutual Fund Performance, Review of Finance, Volume 18, Issue 4, 1 July 2014, Pages 1425–1464

[4] These results may show a different picture if tested statistically and hence should be read with caution.

[5] For lack of space, we do not report those details.

Why cross the line on ethics in business

Financial scams are as age old as history. From simple Ponzi schemes to complex structured deals orchestrated by Enron or at an Asian sovereign fund recently, the financial world has seen a bewildering range of schemes to defraud banks and investors. From the perpetrator’s perspective, it is often financial engineering, and not chicanery, though that’s a moot point.

Enron case

When Andrew Fastow, ex CFO of Enron struck a deal with Federal prosecutors for a lighter sentence, he knew that it was no longer a moot point. The partnerships that were set up to hide debt from Enron’s balance sheet were clearly in the realm of financial chicanery, and could no longer be considered financial engineering. Until then, he had been quite successful in convincing Wall Street investment banks and his auditors Arthur Andersen, that it was the latter case. Both paid a heavy price. The investment banks paid out billions of dollars in settlement of class action suits and with regulators, while the Big 5 accounting firms list shrunk to the Big 4.

 Why Enron resorted to financial chicanery

In the heydays of the nineties, in a scenario of exuberant capital markets (‘irrational exuberance’ as Greenspan would say) and investor pressure on quarterly earnings growth, CEO’s and CFO’s were incubating deals which would generate profits from financial deals in addition to what the business generated, hide losses and suppress debt.

Enron Corporation was a classic case. The energy ‘trading’ business was seemingly well established and Enron was in the lime light in Wall Street. But the earnings coming in from the energy business was simply not sufficient to meet the earnings growth expectations of analysts. Losses were becoming unmanageable in some businesses and earnings proving volatile. Financial wizardry was required to keep analysts at bay in Wall Street. Fastow had been very successful till then in keeping his vast array of bankers at tenterhooks, by making them bid one against the other. The idea of off-balance sheet entities took shape, and required the help of these bankers to execute. These entities, typified by the notorious LJM partnership, Raptor SPE et al, were created to take debt off Enron’s balance sheet and to lay the basis for aggressive mark to market valuation of Enron’s assets. Deals, involving complex derivatives, were struck with the partnerships, ahead of quarter ends, to be reversed immediately afterwards.

The whole structure unravelled when an employee blew the whistle, Wall Street started reflecting on the Enron stock price its nagging doubts on the Enron partnerships and Special Purpose vehicles and the consequent undercapitalization of the partnerships funded by Enron’s stock.  In a short period, market capitalization of USD 80 billion was wiped out, and debt of billions was rendered worthless. The pension funds of thousands of employees invested in Enron stock went down the drain.

Lessons to be learnt

Where does financial engineering cross the thin line into the shadowy realm of financial chicanery? What are the lessons for analysts, investors, auditors and investment bankers?

There are two trends that are visible here. Herd mentality was at play, with the best paid Wall Street analysts and investment bankers being no exception. Enron’s financial statements had some leads to the gross inflation of earnings, in the form of fine print in the footnotes to its accounts, but the financial community largely chose to ignore it. Analysts and investment bankers chose to accept the financial statements at face value rather than suspect a corporation whose market capitalization, was among the top ten. It is always easier for everyone including the best financial brains in the world, at Wall Street, to swim with the tide, rather than against it.  Often it takes a whistle blower like the little boy in the folk tale of the emperor’s new clothes, to bring us back to reality.

Is white collar financial crime any different from that of petty theft or robbery? The latter’s motive is usually to make two ends meet. It is a bit of an enigma on what impels those already worth millions to indulge in financial chicanery. The US based former head of the world’s most prestigious consulting firm was convicted on insider trading charges. Why did a person who had reached the pinnacle of position and prestige want more? One version had it that he wanted to upgrade from the 100 million dollar net worth club to the billion dollar club.

Caesar’s wife must be above suspicion

Well, in this case, the adage applies to the private sector bank CEO’s husband. The banker in India, who was the darling of the financial press for several years, is suddenly facing a lynch mob from the same media, who had built up her profile for nearly a decade. The press it appears, loves to build, and then destroy, the careers and lives of celebrities. While not getting into the merits of the allegations which are still under investigation, at the very least, it appears to be a classic case of conflict of interest. An upfront disclosure followed by complete and total recusal from the deal in question would have saved the individual from the current traumatic situation and possibly much worse to come. One cannot but feel some pathos at seeing her being pilloried by the press day in and day out, when just a year back she was the most sought after representative of the financial community.

The country is now seeing an extreme case of conflict of interest. Several lakh crores of tax payers money is being used to cover up the hole in the balance sheet of banks. Where did this money go? A good part of it went to large corporates, whose promoters diverted a significant chunk of bank money into their personal coffers rather than using it for financing the projects that the bank financing was intended for. No one has paid the price for it, except the hapless public. Very few culprits have been outed and they too have fled to safe havens abroad.

While we have been unable to bring our big ticket financial criminals to justice, we have chosen to make a horrific example of a private sector bank CEO, whose alleged crimes pale in comparison to the large scale swindling of PSU banks and minority shareholders by powerful promoters.

Are Board positions sinecures?

Board positions in listed corporates can deteriorate into sinecures for retired, formerly powerful public (or private) sector executives. A supine board member beholden to the promoter/CEO for his/her position or in awe of the “professional” CEO, is unlikely to carry any accountability to the minority shareholders.  When the promoter seeks the board’s approval to sell off the company owned prime property to his/her own family firm at throw away prices or to invest in the promoter/CEO’s related entities at inflated prices, the rare board member who asks tough questions about the related party transaction, will soon find the doors closed forever from the small clique of “independent” board members. Similarly, a credit rating agency which is truly objective in its ratings will soon find itself out of business.

Having worked in risk management in some financial institutions, the writer has experienced this. Taking a stringent view on corporate loan proposals pushed by the sales team or senior management, can be hazardous to career prospects. Many risk managers, as a result, are content to make some noise, put some innocuous remarks on record, and let the proposal pass. If the mega loan turns bad down the line, one can always point out the risks which were highlighted on record. Careers are safe, but shareholders are left in the lurch.

Another trend is the outsourcing of investigations by the Board of Directors to external parties, when faced with allegations of financial impropriety, aired in the media. This came under scathing attack by India’s “doyen of corporate governance” who founded one of India’s most iconic technology companies, but is no longer part of it. An agency hired by the accused, exonerates it of all blame! What credibility do such investigations carry?

A vibrant media which refuses to sweep egregious cases under the carpet, independent board members (though that’s a rare breed), and strong compliance and risk management professionals at financial institutions can to some extent keep the offenders at bay. Finally, its caveat emptor, individual investors, lenders and board members who carry fiduciary responsibility to minority shareholders, should be perennially on guard against dubious investment proposals.

Impossibilities in Collective Choice

It is the election season in India – with all its pomp and boast – and in the US, too, candidates have begun to prime their pitch for the primary season. Millions of people will cast their individual ballots – their personal opinions on the state of affairs – and the magic of democracy will bring forth a collective will sewed from these individual choices. To an economist, elections are an example of the beauty of social choice in action. But then, so are markets! The price of any commodity, say the phone that we carry so nonchalantly in our pockets, represent the opinions of countless bidders and sellers strewn all over the supply chain – from the glass and metal manufacturers in dozens of countries, to the labor contractors that employ tens of thousands of people, to the early adopters and critics that have the power to make or break a new model. At each level of the food chain there is a bargain, and a bargain is the expression of an opinion. Markets, much like democracies, somehow collect all these scattered and discordant opinions and bind them together into a simple aggregate – the sticker price that we pay for the phone. To marvel at modern markets – or modern democracies – is to marvel at the power of social choice. Yet, surprisingly, once one burrows down to the foundation of social choice, one finds a landscape full of paradoxes and impossibilities.

  1. Impossibilities in Voting

Things will quickly turn grim, so let us start our journey on a positive note with a positive result. In the middle of the last century, Kenneth May was a firebrand mathematician flitting from institution to institution – his political views had a way of putting him out of favor with authorities quickly.  Today, May is best known among mathematicians for his research on the history of mathematics. To a political scientist, however, May will always be synonymous with a theorem that bears his name. In a paper published in Econometrica in 1952, May proved that in any voting system where voters had two alternatives, and all votes were treated equal, a simple majority voting was the optimal way to elicit public opinion – the conclusion known as May’s theorem ever since. This was an impressive result. A simple majority, which is how most people think of democratic opinion, was indeed the best expression of collective will according to this theorem. The catch, however, lay in the simplifying assumptions.

Elections are rarely about just two alternatives. 8251 candidates contested the polls for 543 Lok Sabha seats in India in 2014, an average of 15 candidates per seat. In a remarkable set of articles in the late 1940s and early 1950s, a young PhD student, Kenneth Arrow, demonstrated the basic paradox in systems like majority voting for multiple alternatives. Arrow was soon to become a towering figure of 20th century economic theory – and part of the reason for his legend were these early results in voting theory that opened up entire new areas of economics. The famous Arrow Impossibility Theorem, as these results are now called, tells us that every voting rule for three or more candidates is either collectively irrational, or is a dictatorship in which the election outcome is determined by the choice of a single designated selector. In other words, the options are stark: either a dictatorship, or a system where collective behavior violates the commonsense norms of rationality. Collectively irrationality, in this case, takes the form of what is popularly called “independence of irrelevant alternatives”. Inspired by the work of Arrow, in the middle of the last century, Amartya Sen, along with a number of other pioneering economists clarified the meaning of this form irrationality.

Suppose you prefer vanilla ice-cream when the choice is among vanilla, chocolate, strawberry and mango. Normally, one would expect that you would continue to prefer vanilla if the choice were among just vanilla, chocolate and strawberry. In other words, your selection should be independent of alternatives that do not affect your choice directly. Roughly, this is what independence of irrelevant alternatives requires. What Arrow showed was that almost all voting procedures violated this basic axiom at the collective level. To make things concrete, suppose there were four candidates for a poll: Ram, Hari, Asha and Lata. If all the four candidates were to stand for the election, Ram would be the clear winner. However, if Lata were to somehow withdraw from the fray, the impossibility result says that Hari might beat Ram and Asha. If Ram, Hari, Asha and Lata were the ice-cream flavors mentioned earlier, this would be like saying that vanilla is your clear favorite when all the four flavors are available; however, when mango is no longer on the menu, you suddenly like chocolate more than vanilla and strawberry!

In fact, many hints of such collective irrationality in voting procedures are available in the classical works of political philosophers. Marie Jean Antoine Nicolas de Caritat, popularly known as the Marquis of Condorcet, was one of the leading figures of the French enlightenment in the late 1700s. Around 1785, he showed that collective preference suffers from a fundamental irrationality: the existence of majority cycles. So, a majority of voters might prefer some alternative A to B, a (different) majority might prefer B to C, while a third majority might prefer C to A! Condorcet’s own life saw many seemingly irrational twists and turns. He was deeply involved in the French revolution and was a key voice of moderation and reason in the frenzy that swept France in the aftermath of the revolution. In the end though, it was moderation and reason that cost him his life – as the French revolution devolved into retribution by mobs, he died escaping a rival group. A parable perhaps for the fact that one may stir a crowd through reason, but that reason may not be sufficient when the crowd becomes a mob.

The fundamental paradoxes of voting systems are brought out most starkly in another set of famous results called Gibbard-Satterthwaite theorem. Gibbard’s main line of research is in philosophy and ethics, while Satterthwaite’s principal contributions are in market mechanisms, but in the early 1970s, both of them arrived at the same disconcerting conclusion. In all voting systems, they asserted, people have an incentive to vote tactically to defend their opinions. In other words, people do not vote sincerely when casting their ballot; their votes are manipulable. Indian political parties seem to have a fantastic intuitive grasp of this theorem – all the talk about tactically transferring captive voter bases from one party to another is really an application of this theorem. What is important, however, is that this theorem shows that such insidious practices are not an inherent part of human nature – they are an artifact of the voting systems. A dictatorship suffers from no such issues!

  1. Impossibilities in the Market

Just like voting systems, markets bring out the collective opinion of participants. And just like voting systems, markets suffer from paradoxes and impossibilities. In the early 1980s, economists Sandy Grossman and Joe Stiglitz demonstrated a fundamental contradiction at the root of the market system: a market cannot simultaneously be well-informed and well-functioning. Any trade gives away information. In any well-functioning market system, this means that the passive market participants instantaneously learn an active informed trader’s information through leakage without expending any effort of their own. Thus, there is no way for an active informed trader to get compensated for information gathering in such a market. Which, in turn, implies that no market participant can have an incentive to be an active information-gatherer!

At around the same time, Paul Milgrom and Nancy Stokey, both professors at Northwestern University at the time, demonstrated another fundamental impossibility in market systems: there could be no trade in an idealized financial market. The basic idea was simple. Any trade must be preceded by a revelation of the intention to trade. But disclosing even the intention to trade reveals some information. And it is this information that made trading impossible in idealized markets.

The Grossman Stiglitz and Milgrom Stokey results were just the tip of the iceberg; the literature on financial markets is littered with such impossibilities and paradoxes.

  1. Deeper Connections?

A tantalizing question for researchers in the field is the deeper connection between market systems and voting systems. Both market and voting systems embody the collective will of its participants. But how far can one push the analogy? The parallel paradoxes and impossibilities in the two areas seem to suggest that there are fundamental links that we don’t yet fully understand. Increasingly, computer scientists, too, are getting drawn to the mix. The biggest trading platforms nowadays – the Amazons and Flipkarts of the world – are run by computer scientists more than economists. Voting, too, is gradually becoming more algorithmic. In a certain sense, platforms like Facebook – with their likes and dislikes – are just giant voting machines. How does algorithmic intermediation change the fundamental questions of voting and markets? Do they enhance the interconnections between these two collective choice systems?  These are exciting, open questions that new generations of researchers in economics, finance and computer science are currently grappling with.

For ordinary citizens in democracies, however, elections are about much more than such questions. For a few months every few years, we get elevated from irrelevant nobodies to pampered children – big leaders listen to us eagerly and shower us with goodies for no good reason! Much like what happens on birthdays. In a very real sense, elections are the collective birthday of ordinary citizens, and we are lucky to get to celebrate it. Even well-planned birthday parties rarely turn out to be perfect. Nevertheless, just like elections, they foster a sense of community and well-being, despite all the hiccups.

Spotlight on Angel Tax

Suppose you are a high net worth individual willing to financially support a young entrepreneur with a bright idea and incidentally you and the entrepreneur live in Singapore, you will get tax incentive in supporting her. You will be allowed to deduct the amount of investment that you make in the startup from your income and save tax. The investee company (i.e., the startup) will not be harassed by the tax authority for the price tag at which the angel fund is raised. Alternatively, suppose the same Singapore investor invests in an early stage startup in India. Still this source of funding would not attract the attention of Indian tax authorities. Now suppose, the Indian startup gets angel funding from an Indian resident. This act may bring trouble to both the investor and the beneficiary- thanks to the so called ‘angel tax’ in India. In India the angel investor does not get any tax credit and the startup may get a tax notice whenever it raises any subsequent round at a valuation lower than the angel round. A provision in the Income Tax Act [section 56(2)(viib)] provides that any excess consideration received by a company will be treated as ‘income’ in the hands of the company if it issues shares to a resident individual (and not to any entity) at a price above its fair value. Thus, if the investor is a venture capital firm, the provision will not apply and similarly it will not apply to non-resident investors.  Surprised? You are not alone- the controversial angel tax has troubled many startups for the past one year. Several government agencies (e.g., the Department of Industrial Policy & Promotion, Niti Aayog), which support startup initiatives, came out openly against this activism of tax authorities. The investors and the entire startup community have urged the ministry of finance to intervene and stop this draconian ‘angel tax’.

The angel tax was introduced in 2012 with a different objective- to trap shell companies for money laundering. For example, one creates a startup for software development and the startup ‘sells’ software to an overseas entity, controlled by the same person(s), at a low price (as it is difficult to value any intellectual property). In some cases, the domestic entity may even pass a blank CD as software. The overseas entity, in returning the favour, not only pays for the software but also invests in the equity of the startup at a hefty premium. The domestic startup thereby avoids paying tax on sale of software and this could be a fit case of money laundering. Such rogues should be nabbed and necessary actions should be taken against them. Back in 2012, it was difficult for the tax authorities to identify shell companies as they were not equipped with data analytics and hence were in the look out of external triggers to nab the wrongdoers.

The situation is completely different now- the surveillance systems of the tax authorities (e.g. CBDT) and the Ministry of Corporate Affairs (MCA) are now robust and in sync to identify money trail dynamically. Hence, one does not need angel tax to nab the money launderers.

Measurement of Angel Tax

Angel tax, as per the extant Indian Income Tax provisions, is levied when startups receive angel funding (i.e., from a wealthy individual) at a valuation higher than its ‘fair market value’. The ‘excess amount’ (proceeds minus the fair value) is taxed as income at the marginal rate. Finding fair market value of a startup is a challenge and sometimes depends on several qualitative parameters and not on objective measure like cash flows. The income tax authorities have used a roundabout way to find out the ‘excess’ by comparing value at which the subsequent round of funding is raised. For example, if a startup raises money at a valuation of Rs. 100 per share in a particular round and thereafter raises equity at a price of Rs.90 per share in the subsequent round, the income tax authority will claim that the startup had raised the earlier round at a price which was higher than the market value by Rs. 10 per share. This is absolutely ridiculous. The lower valuation in subsequent round may happen due to many factors like, market downturn, lower-than-expected growth of the startup. It is a well-established fact that valuation is time-dependent. Immediately before the global economic recession, commodity prices were trading at hefty premium and commodity-companies were priced at higher multiples. The commodity prices plummeted after recession and those companies lost significant market value. For example, the Australian metal giant, BHP Billiton suffered a 65% decline in the profit in 2009 after metal prices and demand plunged during recession. Therefore, if one does a valuation of BHP Billiton at two time points (e.g., in 2006 and 2009), its value would be significantly lower in 2009. This does not imply that valuation in 2006 was not justified on the basis of fair market value- no one could visualise global recession in 2006 and hence the company’s valuation at that time was purely based on available information.

Table 1: Startup Valuation

Business Valuation (per share) Valuation (per share)
Zomato Rs. 1,36,396 (Sept 2015)  Rs. 1,13,739 (Feb 2018)
Swiggy Rs. 24,839 (Dec 2015) Rs. 79,834 (Feb 2018)
Bigbasket Rs. 4380 (Oct 2015) Rs. 6377 (Jan 2018)

Source: Private Circle Database. The figures are issue price of preference shares.

Had Zomato raised the funds in February 2018 round from angels (this was not the case as the funds were raised from institutions), they would be imposed angel tax (Table 1) for the funds raised in September 2015 on an assumed income of around Rs. 23,000 per share. However, the fact of the matter is where Swiggy was consistently growing and raising funds almost every year, Zomato fell off the radar of investors in 2016 and 2017 as it was struggling with its business model. Zomato raised money in February 2018 after a gap of almost two and half years. The lower valuation of Zomato was mainly due to investor’s scepticism. The same company had later raised money in November 2018 at a valuation of over Rs. 2,18,000 per share.  Therefore, the valuation of any business depends on available information at the time of the exercise and has nothing to do with what happened in the past.

Large companies take the opportunity of a buoyant stock market while deciding on the timing of initial public offers (IPOs). A private company generally floats an IPO when the market trades at higher valuations. Many of the IPOs experience significant decline in the market price post issue (Table 2).  The IPOs listed in Table 2 were issued in 2018 and in a few months have witnessed non-trivial erosion in value. Wherever the decline is more than the fall in general equity market (e.g., index) that could be attributed to either overpricing at the IPO stage or poor performance of the issuer. Therefore, erosion in the market value of equity is a common phenomena and estimating overpricing of an earlier issue based on subsequent decline in price is not a justifiable measure.


Table 2: IPO Premium

Company IPO Price per share (Rs.) Current Market Price* (Rs.)
Ircon International  475  410
ICICI Securities 520 228.70
Bharat Dynamics 428 284.35
Garden Reach Shipbuilders 118   93.45
Indostar Capital 572   347

* As on 18 January 2019

Whenever a startup had contested the above-mentioned method for arriving at the angel tax and furnished fair valuation done by certified valuers, tax authorities did not always accept the valuation certificates of professional

firms. The section 11UA (2)(b) of the Income Tax Act provides that the tax department should accept valuation done by a registered merchant bank as evidence of fair market value. Therefore, there should be no scope for confusion. One may note here that Companies Act requires that whenever a firm raises equity, its fair value should be based on a value certified by an independent person. This is to ensure that startups get to raise their funds at fair value and the investors do not force any startup, looking for fund, to accept a lower valuation. If one accepts this logic, there is no question of any angel tax as funds are raised always at fair value prevailing at that time.

The whole purpose of angel funding is to support innovation and provide necessary funding at a stage of a business when established channels of funding (including venture capital) are not available. Angels take very high risk (next only to the promoters) while funding any early stage startup and thus believe in the idea or product of the investor. Angel funding happens when the business entity is in the pre-revenue or early-revenue stage. The firm will have no cash flows or profits at this stage. In such a situation, established methods of valuation (e.g., discounted cash flows, implied price-to-sales) may not be able to capture the fair value of such a startup. One uses several other methods (e.g., scorecard, cost method, opportunity cost of efforts) and there is high degree of subjectivity in those valuations. If one smells foul in these methods and attaches motive of money laundering, that is quite unfair. Many angel funding is made through established angel networks after sincere evaluation of the prospect of the startup and all the payments happen fairly through bank with proper credit validation. Hence, chances of avoiding tax by high net worth individuals through this route are limited.

Incentivise the Investors

Rather than imposing angel tax on fledgling startups, the tax laws should incentivise the angel investors so that great ideas get essential financial support at a very stage. It will not be an exaggeration to mention that many startups would not have reached growth phase had they not got angel funding. The reputation of angels at times provides comfort to venture capital funds when the latter make investment decisions. Countries, which promote innovation, offer tax credit to angel investors (Table 3).  Such tax relief provide huge incentive to the investors and thereby attract investments in early stage ventures.  In order to get tax benefits, the investors should be resident individuals of the respective nations and the startups should be the ‘qualifying’ ones. While in Singapore, the tax benefit is in terms of setoff facility from regular income, the benefit in the United Kingdom is even better. Rules provide income tax as well as capital gain relief. Tax on income in the USA is a state subject and hence angel investor tax credit programmes vary from one state to another. States, known for startup culture, have generous tax incentive programmes.

Table 3: Tax Credit to Angel Investors

Country Tax Benefit
Singapore Angel Investors Tax Deduction (AITD) Scheme is available to angel investors till 2020. An approved angel investor who invests a minimum of S$100,000 in qualifying startups is eligible to claim tax deductions for the 50% of investments made for each assessment year up to a period of two years with a maximum cap of S$500,000. The amount may be deducted from the individual’s total taxable income. The angel investor must hold the investments for a continuous period of two years to claim tax credit.
United Kingdom Under the Enterprise Investment Scheme (EIS), angel investment in the equity of a qualified startup can get income tax relief of up to £ 300,000 per year. Plus, the angel may also get capital gain tax relief on disposal of EIS shares after three years of holding period. If EIS shares are disposed at a loss at any time (after the mandatory three year holding period), the loss can be offset against income (and not capital gains) of the investor in the year of loss. EIS is for early growth stage startups. There is a separate tax incentive scheme for early stage startup, called the Seed Enterprise Investment Scheme (SEIS). Under SEIS, angel investors get tax relief of up to 50% of investment value, subject to a maximum relief of £100,000 per year. Further, investors can also benefit from up to 50% Capital Gains Tax relief (up to a maximum of £50,000) on gains, which are reinvested in EIS eligible shares.


Massachusetts (United States) Effective from 2017, angel investors get tax credit for investments in qualified business (based in Massachusetts) up to 20% of investment value, subject to a total tax credit of $50,000 per year.


Conclusions

In May 2018, the income tax department has clarified, through a notification, that section 56(2) (viib) will not apply to certain sections of the startups. The income tax authorities claim that startups registered with the DIPP will enjoy such exemption. However, recent newspaper reports suggest that even DIPP-approved startups were not spared from the angel tax threat. Following the global practices, it is required that startups are not harassed with the angel tax and the exemption from angel tax should be extended to all startups, approved or not. Only

criteria could be that the startup should be a registered unlisted company with some size restrictions. Further, in order to attract more angel funds, angel investments should be eligible for tax credits. In order to ensure that such tax concessions are not misused, eligibility criteria may be laid down for both the investors and the investee. The May 2018 notification of the Central Board of Direct Taxes (CBDT) providing angel investors a tax status at par with the Venture capital funds is not enough. What is required for angel investors is not equal status with venture capital funds, but tax credit for investments made. There is a high expectation from the Hon’ble Finance Minister on 1 February when he presents the budget. Hopefully, the controversy with the angel tax will be put to rest for good.

*******