Credit Growth in Indian Banking System: Green-shoots or Early Blips?

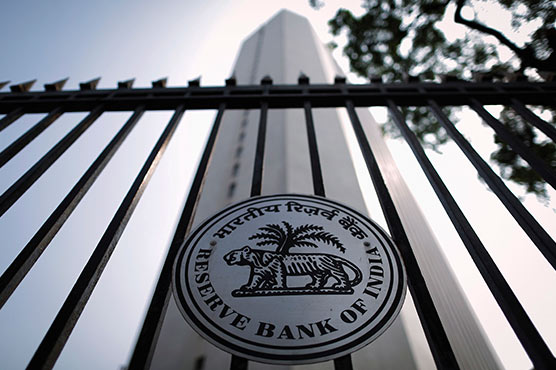
In an environment dominated by headlines on RBI-government difference of opinion and resignation of the erstwhile RBI Governor Urjit Patel, the recently released Financial Stability Report (December 2018) of the RBI seemed to have attracted less attention. But the report (RBI, 2018) offers a wealth of information and analytics on the Indian financial system at the time when the environment was marked by complaints on accumulation of non-performing assets, regulatory activism and credit shortage after the IL&FS crisis. This note looks into one specific aspect of the report, namely, credit growth of the Indian commercial banking sector.

Trends in Credit Growth

To put the matter in perspective, credit growth in Indian banking system has been rather low in recent times (Chart 1a). Of course, since early 2012 there has been a secular decline in growth of both non-food credit and deposit till end 2016. Because of the deposits inflow arising out of demonetization, during 2017 and 2018, there could have been a disconnect between deposits growth and credit with deposit growth experiencing a spurt during the first half of 2017 and a sharp fall thereafter. In general credit growth continued to fall till about February 2017; it headed for a recovery since then but yet to cross the 15 per cent mark.

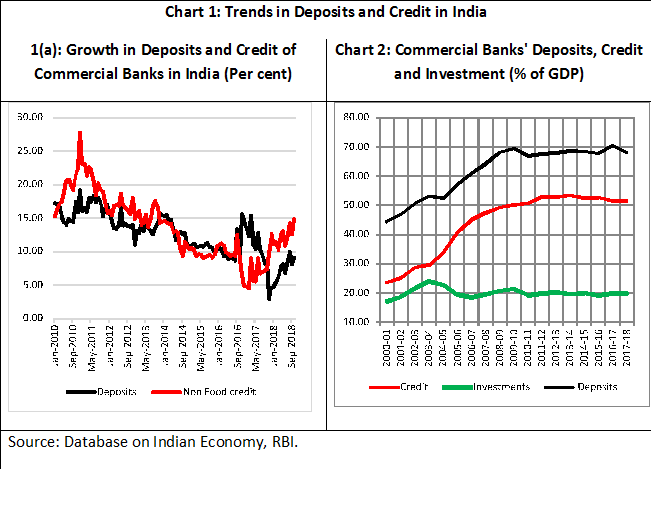
The situation is more stark if one considers the major banking aggregates as a percentage of GDP (Chart 1b).  Since 2011-12 three major banking aggregates, viz., deposits, credit, and investment have remained almost constant as a percentage of GDP. In particular, bank credit as a percentage of GDP typically hovered around 50 per cent in recent times. In terms of cross-country data from Wold Bank, India’s domestic credit to private sector appears to be quite low among most of the G-20 countries (Table 1).

Table 1: Domestic credit to private sector  in 2016 (As % of GDP)


Country Name Broad Credit-GDP Ratio (%)
United States 192.2
Japan 161.7
China 156.8
South Korea 143.0
Australia 142.5
United Kingdom 134.3
France 97.6
Italy 85.7
Brazil 62.3
Russian Federation 53.4
India 49.5
Indonesia 39.4
Argentina 13.7
Note: Domestic refers to financial resources provided to the private sector by financial corporations, such as through loans, purchases of non-equity securities, and trade credits and other accounts receivable that establish a claim for repayment.

Source: World Bank

Non-Bank Sources of Financing     

Considering the fact that India’s economy grew at 6 per cent plus since 2011-12, does this lack of credit pose a riddle?  How was the growth financed? Interestingly, contrary to the popular belief that the Indian financial system is bank-based, in recent times non-bank sources tended to dominate flow of financial resources to Indian non-financial sector. In fact, faced with a shortage of credit by banks, it seems that a large chunk of credit needs by select sectors were met from non-banking sources of finance – both domestic and foreign sources (Chart 2).

While FDI is the primary sources of foreign flow of resources, What are the domestic non-bank sources of credit? Prominent among these are: i) public issues by non-financial entities;  ii) gross private placements by non-financial entities;  iii) net issuance of CPs subscribed to by non-banks;  iv) net Credit  by housing finance companies;  v) total gross accommodation by 4 RBI regulated AIFIs (NABARD, NHB, SIDBI &  EXIM Bank);  vi) systematically important non-deposit  taking NBFCs (net of bank credit);  and vii) LIC’s net investment in corporate debt,  infrastructure and Social Sector. In particular, both gross private placements by non-financial entities and net issuance of commercial papers (CPs) subscribed by non-banks have, in recent times, emerged as major sources of finance.

                Chart 2: Flow of Financial Resources to Commercial Sector (Rs. Trillion)
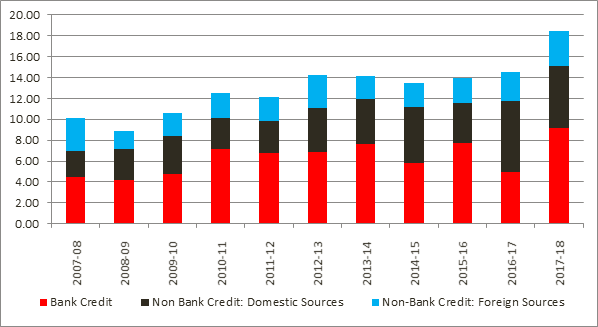
Source: Database on Indian Economy, RBI.

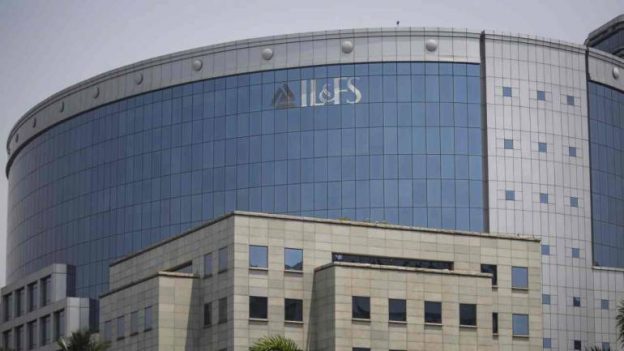
Did this non-bank sources of financial resources get dried up following the IL&FS (Infrastructure Leasing & Financial Services) crisis, when the IL&FS defaulted on a few payments and failed to service its commercial papers (CP) on due date in September 2018.[1] Two major trends are noticeable in this regard.

First, insofar as the flow of resources from domestic non-bank sources in concerned, the share of net credit by housing finance companies (HFCs) in the total flow of credit (from domestic sources) nearly doubled from 6.2 per cent in 2013-14 to 11.7 per cent in 2017-18 (RBI, 2018).

Second, mutual funds (MF) have played a catalytic role in the reshaping of the non-bank financial intermediation. In fact, the RBI report noted:

“The recent episode in the wake of IL&FS default however underlined certain issues in this market intermediated credit provisioning structure, the narrative on which can be broadly divided into: a) nature of credit intermediation of MFs and the IL&FS incident induced dislocation; b) price impact of MF dislocation with specific focus on money market rates; c) fair value of corporate issuances in banks and MFs; and d) credit concentration in MF portfolios and possible behavioural implications” (RBI, 2018; p. 14).

Recent Trends

Considering the fact that the rise in non-performing assets of the banking sector could have had a significant role in subdued credit growth, the RBI report indicated certain positive pointers. The following are important in particular:

  • The asset quality of scheduled commercial banks has showed signs of improvement with gross NPA ratio declining from 11.5 per cent in March 2018 to 10.8 per cent in September 2018.
  • The annualised slippage ratio (i.e., fresh accretion of NPAs during the year as a percentage of total standard assets at the beginning of the year) came down from 7.6 per cent to 4.1 per cent in the same period.
  • While the stressed assets to advances ratio has started converging to the gross NPA ratio following the withdrawal of various restructuring schemes, sector-wise analysis showed higher stress in mining, food processing and construction sectors.

Furthermore, the RBI report projected that the gross NPA ratio (under the baseline scenario) might decline from 10.8 per cent in September 2018 to 10.3 per cent in March 2019. Concerns however remained as sensitivity analysis indicated that 18 scheduled commercial banks (including all public sector banks under Prompt Corrective Action) may fail to maintain the required CRAR under a 2 standard deviation shock to the gross NPA ratio.

In recent times Indian banking has been occupying headlines mostly due to wrong reasons. Thus, some of these indicators seem to be good news in an otherwise not-so-bright scenario of Indian banking sector. It, however, remains to be seen whether these indicators are genuine green shoots or blips.

*****

[1] According to a Reuters report, by the middle of September, IL&FS and IL&FS Financial Services had a combined Rs 270 billion of debt rated as junk by CARE Ratings and a further six group companies had suffered downgrades with a negative outlook on another Rs 120 billion of borrowings.

Chaining the Blocks: A new frontier in modern accounting

In the world of finance and control, the word “Blockchain” has probably been heard for the first time in the context of Bitcoin. In October 2009, the New liberty standard established the first online service to buy and sell bitcoins at an initial price of eight hundredths of a cent per bitcoin. By December 17, 2017, the price of bitcoin reached $19,500 and it became the fifth largest currency in the world in terms of total amount in circulation. Despite growing evidence that suggests that the Bitcoin and other major cryptocurrencies are exhibiting signs of a speculative bubble, cryptocurrencies continue to enjoy enormous investor interest. Subsequently, the blockchain technology has become an interesting area to explore for researchers and practitioners. Although the explosion of cryptocurrency in past few years has brought blockchain into the mainstream, “blockchain” is the new buzzword in every industry – investing, banking, education, healthcare, insurance, real estate etc. In the field of accounting and auditing, this radical and disruptive technology has greater pertinence which is worth exploring.

Blockchain can be considered as a database which goes on building up incrementally by a network of participants who run the same software following the same set of constraints and rules. A “Blockchain”, as the name suggests, gets constructed by blocks of data that are gradually “chained” together. One can imagine it as a spreadsheet which is built up gradually by new cells being chained on. A blockchain database continues to be built and maintained as long as the software continues running. Therefore, unlike a single centralized entity, the chain continues to remain “alive” even if individual participants within the chain are pulled out (e.g. – bankrupted). Therefore, the “Blockchain” builds an indelible record that is completely resistant to any sort of tampering by any individual party.

Thus, it is quite likely that such robust and transparent technology would attract more companies to join in crypto economy. As soon as such economy gets larger in size, the accounting firms will be forced to account for cryptocurrency transactions in their accounting process. In the following figure, estimated capital market spending on blockchain over the years has been shown.

It is clearly understandable that the accuracy of transactions through blockchain technology should not be a matter of concern for the companies. However, they need to plan for how the transactions should be recorded and presented in financial statements. Even the process of valuations based on accounting records also needs to be decided. It is expected that in long term more and more accounting records will be moved to blockchains and that will facilitate the auditing and control of transactions on real time basis.

Impact on Accounting and Auditing:

“Digitalization” or integration of digital technologies in day-to-day life is one of the recent developments across the industries. However, its impact on the accounting system is still at preliminary stage. The most possible reason may be the extremely high regulatory requirements in this domain. In order to keep intact the validity and integrity of the entire accounting system, mutual control mechanisms have been built using multiple checks and balances. This in turn demands for extensive documentations, duplication of efforts and periodical controls. These are majorly manual and labour intensive tasks with larger impact on cost and efficiency. However, the recently emerged blockchain technology carries huge promises in this context. While using this technology, companies can enter their transactions in joint register directly and create an interlocking system of long-lasting accounting records. This replaces the need of keeping separate records of all transaction receipts. Moreover, since these entries are cryptographically sealed and distributed, there is practically no possibility of destroying or manipulating them. Hence, the time and cost required to perform an audit would decline significantly. In effect, more complex transactions or sophisticated internal control mechanisms those need more attention from auditors will be rigorously verified resulting better outcome of audit process.

Although the blockchain technology can radically change the entire accounting system, companies do not need to start with a joint register for all the accounting entries. Rather, it can be slowly integrated with conventional accounting procedures. It may start with ensuring integrity of accounting records and gradually form fully traceable audit trails. One of the factors that creates a barrier in the process of moving from paper receipts to electronic archiving is the perceived risk of unwanted modification. For physical instruments, especially for immutable records, chance of unnoticed modification is much lower than that of electronic files. This may be a potential reason why companies are not enough enthusiastic about digitalizing paper records. In this context Blockchain can be extremely helpful as a source of trust. By generating a hash string of a file, it may preserve the integrity of such electronic file. The hash string necessarily denotes the digital fingerprint of that file. The same fingerprint can be immutably time-stamped by scripting it in form of a transaction into the Blockchain. Subsequently, one can easily prove the integrity of the same file by matching newly generated fingerprint with the earlier fingerprint stored in the Blockchain. In case these two are identical, the document can be considered as unaltered since the time of first scripting the hash in the Blockchain.

Thanks to blockchain, recording and timestamping of documents will render all accountancy events permanently memorialized and immutable,” Ricky Ng, founder and chairman of i-House.com commented “Documents cannot be modified over their life cycles. Business processes that span multiple departments or even companies are recorded and fully traceable.

Although this new technology is expected to disrupt the entire accounting industry, the fear of replacement of human accounting professionals with much sophisticated “Blockchain” technology should not be a matter of concern. Rather, it offers a new opportunity for the accountants and CPA firms. They can now ensure the accuracy and truthfulness of the records to their employers and clients who are always worried about the safety and security of such records. Moreover, it’s also an opportunity for them to streamline the accounting and auditing processes and position themselves as innovative and forward thinking service provider.

Erik Asgeirsson, the President and CEO of CPA.com, believes that the “Blockchain” is the very next item which will transform the accounting world. “Through every phase,” he said in an article “what’s really happened is the accountant’s and auditor’s role has just evolved.”

Therefore, the role of an accountant in this new accounting world will be changed but will certainly be not eliminated. This new technology aligns seamlessly with accounting profession. “Blockchain” basically deals with a new type of accounting ledger which can only be updated and verified continuously without any risk of being corrupted or altered. With the evolution, the accounting professionals need to learn this new technology and offer some valuable differentiated service to their clients. More quickly they adopt, more beneficial it would be for them before the technology becomes standard and part of our daily jobs.

What do the “Big Four” think?

The current practice of auditing can be made far more automated even without pouring through the paper trails. “Blockchain” technology facilitate such auditing process by verifying key data underpinning company’s financial statements. For example, smart contracts that are automatically executed can be readily verified using codes. However, the auditors need to be familiar about the finer nuances of this new technology. In this regard, it is imperative to track how the world’s biggest four auditing firms –  Deloitte, Ernst & Young (E&Y), KPMG and PricewaterhouseCoopers (PwC), better known as “Big Four”, are  planning to deal with this major development.

E&Y is the first which has started accepting Bitcoin as a payment method. In April 2018, it has launched “Blockchain Analyzer” which will facilitate the review and analysis performed by E&Y audit teams on blockchain transactions. The pilot project aims to build the mechanism behind automated audit tests on assets, liabilities, equities and smart contracts that are recorded in blockchain. KPMG, a member of the Wall Street Blockchain Alliance”, has partnered with Microsoft to launch “Blockchain Nodes” initiative to identify and use new applications of blockchain technology. Besides, KPMG has started a “Digital Ledger Services” program back in 2016 to assist financial services companies in identifying blockchain applications. Similar to E&Y, PwC has also started accepting Bitcoin as a mode of payment from December 2017 at its Hong Kong office. Deloitte has launched Rubix, a “one-stop blockchain software platform”, way back in 2014. Using this platform, Deloitte started exploring initial coin offerings (ICOs) as an instrument to diversify their offerings.

It is clear from the above discussion that although the “Big Four” have not yet started their auditing services directly using “Blockchain” technology, but they are very much into the development phase. For example, In April 2018, PwC has announced its first ever blockchain auditing services which aims to ensure whether the already signed up crypto businesses are using this technology properly and effectively. Recently, the “Big Four” have joined a consortium of 20 Taiwanese banks to trial an auditing run on interim financial reports of public companies using blockchain service.


The Challenges

Although it is true that “Blockchain” technology provides a lot of promises especially in the domain of accounting and auditing, one can foresee a number of challenges lying ahead. Firstly, the audit tools developed by both E&Y and PwC most probably support private blockchains. In that case, the businesses that operate on public blockchains will be left out. Secondly, enterprise-ready blockchain solutions are yet to be available for the accounting industry. Thirdly, the widely used accounting softwares are not compatible with sophisticated “blockchain” technology as of now. Finally and more unexpectedly, in spite of remarkable interest among conglomerates and start-ups to explore this new technology, regulatory hurdles are pushing companies backward. PwC blockchain head, Steve Davies, has commented:

“Businesses tell us that they don’t want to be left behind by blockchain, even if at this early stage of its development, concerns on trust and regulation remain. Blockchain by its very definition should engender trust. But in reality, companies confront trust issues at nearly every turn.”

Conclusion

Blockchain can be considered as a source of trust which has the potential to bring a radical change in history of accounting. It safely records all transactions, reconciles and stores them permanently in the chain. In a way it provides speed, efficiency, accuracy and truthfulness. This, itself, is a major development over traditional accounting system which is fraught with errors and fraud. Although there lies a number of challenges, it can be easily combatted if accounting industry, its leaders, regulators and technology providers work together to achieve a win-win situation for all the parties. Once such challenges will be overcome, blockchain technology will undoubtedly emerge as a new frontier of modern accounting.

*********


Financial Markets, An Antidote For Utopia

Utopia, a word coined by Sir Thomas More as the title for his sixteenth century book, is an ideal world where everything is perfect, citizens live in bliss and there is no room for conflict. While the world we live in today is far removed from such idealistic conditions, an all perfect place can have unintended consequences for its inhabitants: ennui or boredom. Imagine if every day was like the previous day, and the future is expected to be a repeat of the past. Perhaps, if financial markets were permitted in utopia, the markets can break its monotony, and give its denizens the much needed spice in their otherwise humdrum existence.


THE RETURN OF VOLATILITY TO FINANCIAL MARKETS

The financial markets would not have lived up to such expectations in the year 2017, with its lack of volatility. To its credit, the markets more than made up for this in 2018, with volatility back with a bang. The Dow Jones Index, cheered on by President Trump and windfall corporate profits from the Tax Cuts and Jobs Act, reached a peak of 26951. Solid growth figures, benign inflation and falling unemployment underpinned the performance of the equity markets. But then, to use a cliché from the financial markets, the Fed stepped in to “take away the punch bowl”, before the party turned too boisterous. The Fed’s rate hikes, and more significantly its phased unwinding of its USD 4.5 trillion balance sheet built to counter the Great Recession, along with the self-confessed “tariff man” Trump’s trade war against China, pulled the Dow down all the way to 21,712. The R word (for recession) was mentioned frequently by the market pundits as higher interest rates could be a dampener for growth in the economy. The flattening yield curve, on the verge of inversion, was another ominous sign for the economy and equities.

Trump, who had tied his fortunes to the stock market, and having taken credit for the upside since his election, was furious with the Fed, blaming it for the fall in the markets and for a potential recession. Talk of neighbour’s envy or in this case a successor’s gloom: in one of his tweets, Trump bitterly pointed out how Obama benefited from “zero interest rates”, and that despite the Fed’s rate increases, the US economy was still doing well under Trump’s administration.  There was incessant pressure from Trump on the Fed, to reduce rates.


WHEN THE FED CAPITULATED

At first, Jerome Powell, the Fed’s Chairman and a Trump appointee, did not budge, maintaining that the Fed’s decisions were not influenced by political considerations. Rumours of Powell being fired made the rounds. Market pundits also chipped in, that the Fed needs to “listen to the markets”. Trump’s relentless tirade against the Fed on twitter and its Chairman Powell, accompanied by a collapse in the Dow Jones Index in a howl of protest against a tight monetary policy, ultimately broke the back of the Fed. In a move reminiscent of the “Greenspan put”, Powell abjectly surrendered, walking back from the talk of continued tightening, by agreeing to “be patient and flexible, and be sensitive to downside risks in the markets”. More significantly, he indicated flexibility on the Fed’s plans to wind down quantitative easing (QE). The equity markets rejoiced with the Dow immediately up by about 1000 points. As always, it was the Fed talk that moved the markets and not any actual announcement of monetary policy by the FOMC.


OIL, ON A WILD RIDE

The most watched commodity in the financial markets, oil, was also on a roller coaster ride along with equities. Starting the year at USD 66.6, Brent prices went up all the way to USD 86 on talks of sanctions on Iran, an oil exporter. The OPEC oil cartel apart, the three influential personalities behind oil price swings, Donald Trump of the US, Vladimir Putin of Russia and Crown Prince MBS of Saudi Arabia, had different agendas. Putin’s Russia, a non OPEC member, having learnt from the lessons from the past, on the risk of excessive dependence on oil and its wild price gyrations, continued to pump oil at its own pace. Saudi Arabia was caught between its economy’s dependence on high oil prices and its hesitation to offend Trump, a vocal advocate of low oil prices. The Khashoggi affair had also put MBS on the defensive.

Sanctions on Iran were supposed to take out a significant chunk of oil supplies off the markets. Hence Saudi Arabia, urged on by Trump, stepped up production to make up for the impending shortfall. Then, in a surprise move, Trump exempted several large oil importing countries like India, from the sanctions, for 180 days, bringing Iranian oil back into the markets.  By then, Saudi crude supplies had already been ramped up, to make up for the “Iran sanctions”, leading to significant over supply. Trump, with this apparent sleight of hand, played a decisive role in pulling down oil prices, with a near collapse of about 40 % from its peak in 2018. Perennially current account deficit economies like India, with huge oil imports, have much to thank for, in Trump.

US shale oil production, has made the country the largest oil producer in the world, with inventory levels at the massive oil storage hub in Cushing, Oklahoma a key metric watched by financial markets.  US monetary policy also impacts commodity prices, with an accommodative stance being a positive factor. Oil price movements and US stock indices in late 2018/early 2019, now closely track the progress of the US China trade negotiations.

CURRENCY MARKETS AND CORRELATION

The currency market with about USD 5 trillion a day in volumes, is the largest segment of the financial markets. 2018 was an interesting year for this market too. The Pound Sterling, fell sharply against major currencies, when the Brexit withdrawal agreement was voted down by the UK lawmakers. The Sterling’s fortunes are now closely tied to progress on reaching a consensus for an orderly exit of UK, from the European Union.

The US Dollar index DXY was up by 4.6% in 2018 helped by a tight monetary policy and strong growth in the US economy. Market watchers have observed a negative correlation between the Dollar index and US equities. One reason is that, a strong dollar makes exports uncompetitive for US multinational companies, dimming their earnings outlook and stock prices. The DXY index measures the Dollar against 6 currencies, Euro (highest 57.6% weight), Pound, Yen, Canadian Dollar, Swiss Franc and Swedish Krona.

The Japanese Yen (JPY) and the Aussie Dollar (AUD) exhibited interesting divergence. The Yen considered a safe haven currency, appreciates against USD when the global equity markets are in a turmoil, Japan being the world’s largest creditor to other countries. The US dollar too, as measured by the DXY index, appreciates in the face of risk off scenarios in the financial markets, against the Euro and Sterling, while weakening against JPY. When the markets are back to a “risk on” mode, the Aussie and Canadian Dollar (CAD) benefit. The Australian economy with its dependence on commodity exports saw its currency move in tandem with US equity markets. CAD too is considered a commodity dependent currency.

In addition, Powell’s recent dovish comments on interest rates benefited the Aussie Dollar and other “risky” assets. Any pause by the Fed, is a negative for the US Dollar, while emerging market currencies benefit from a dovish signal on interest rates by the US Fed.

Central bank easing on interest rates, is a negative for the domestic currency in emerging markets. On the other hand, economies like Indonesia and Argentina, in the face of fast depreciating currencies in 2018, resorted to monetary policy tightening with the objective of shoring up their currencies.

In Europe, the Swiss Franc (CHF) is considered a safe haven, with uncertainty in the continent, as for example in Italy, resulting in CHF appreciation.

MORE ON CORRELATION IN FINANCIAL MARKETS

Gold is another important commodity in the financial markets. Being priced in US Dollars, the price of gold moves inversely with that of the Dollar as measured by the Dollar index DXY. Dollar strength as witnessed in 2018, is usually accompanied by a fall in gold prices. Interest rates too have their impact, with Fed talk of easing rates, considered inflationary and therefore a positive for gold price; gold is considered a hedge against inflation. The early 2010’s, a period of quantitative easing, saw a rush into gold.  Lower interest rates also help in reducing the holding cost of gold, making it more attractive to own.  Gold is also considered a safe haven asset, with prices moving up in times of turbulence in the financial markets/weak equity prices. US treasuries too are considered a safe haven asset, benefiting in such a scenario, along with JPY.

Oil prices tend to move in tandem with equity markets, with turmoil in equity markets, instantly reflecting on oil prices, though no inferences on long term correlation can be drawn.

Emerging market currencies like the Rupee, witnessed a sharp depreciation in 2018, thanks to a surge in oil prices, which have an outsized impact on current account deficit and unwinding of QE/higher interest rates by the Fed. Though the Dollar index DXY was up by 4.3% only in 2018, the Rupee fell 9% bringing back memories of the 2013 Ben Bernanke induced taper tantrum. The off shore non deliverable forward markets for emerging market currencies were again spoken of with awe in the financial markets, for their ability to influence prices in the onshore spot markets. Rupee movements of 0.5 to 1% in a day which was unusual earlier, have become a common occurrence.

10 year India benchmark government bond yields beginning the year at 7.33% went up all the way to 8.15%, with RBI’s intervention in the FX markets to curb rupee depreciation impacting system liquidity. The central bank brought back liquidity by massive open market operations resulting in bond yields falling to 7.2%, though they have since risen.


WHEN THE CORRELATION IN THE MARKETS BREAKS DOWN

Earlier in this column we recommended that “citizens of utopia” be permitted to dabble in financial markets to break their otherwise monotonous existence. If the stock, money, bond, currency and commodity segments of the markets exhibit a standard pattern of correlation, such behaviour takes away some of the charm of the markets, despite their volatility. It is a generally accepted fact that prices in the equity and bond markets move in opposite directions, with euphoric equity investors moving money out of treasuries, driving down their prices. And when stock prices are down, treasuries outperform. However, in October 2018, there were times when both stocks and

bonds moved down together, breaking the past patterns. The other correlations in the various segments of the financial markets, discussed in earlier paragraphs are generic patterns, based on historical trends, which may not necessarily hold true in all future market conditions.

CENTRAL BANKS VERSUS THE GOVERNMENT

Central banks continued to have an outsized influence on the financial markets, through monetary policy, open market operations, day to day liquidity management, and intervention in the foreign exchange markets.  2018 saw tremendous pressure on the central banks on various fronts to cede some of that power to the Governments. India witnessed an outburst from the Deputy Governor warning of the wrath of the markets and “the igniting of economic fire” if the independence of the central bank is compromised. This appeared to work differently in the US, where financial markets set the trend and the central bank followed. A massive sell off in the equity markets caused the Fed to flinch on increasing interest rates, though Trump too contributed by his relentless pressure on the Fed to pause on its plans to hike rates.  In all the current tug of war between the governments and the central banks, it is noteworthy that the heads of the central banks are government appointees, who however become inflation hawks the minute they stepped into their new role, ignoring the pleas or tirades from their erstwhile masters. One is reminded of Julius Caesar’s last words to Brutus: “Et tu, Brute?” (You too, Brutus!).

While Powell meekly gave in to political pressure by reinstating the “Greenspan put”, the Governor quietly resigned in India. Subsequently, the central bank tweaked the NPA norms for the MSME segment, while appointing a committee to arrive at the “economic capital” requirement of the RBI. While these moves appear rational, the independence of the central banks is under threat globally. They no longer have the sole monopoly to move markets or set policy. The political class, which has “direct accountability to the people”, now has a very big say on aspects hitherto under the exclusive domain of the central banks.

A final note on who moves the financial markets. Some market watchers attribute the violent December sell off in US stocks to computer driven algorithmic trading. As technology takes over our daily lives, it may also have the last laugh in the central bank versus government tussle.

*******

Dynamics of Crude Oil Price

Crude oil is the most influential commodity affecting all countries and all sectors. Every economist, policy maker, business and even household regularly follows movement of crude prices and its likely impact on the inflation. Yet it is most difficult to predict crude prices. Econometricians, armed with advanced time series models, have been trying, over many decades, to predict movement of crude oil prices. They have failed.  What has worked so far is that empiricists were able to identify factors that explain movement of crude oil prices. But predictive models did not work.

India’s heavy reliance on crude imports is a known fact- 82% of our crude oil needs are met through imports. Hence, any upward movement in international crude oil prices adversely affects our current account deficit (CAD).  Though major oil importing companies in India do not entirely depend on Brent Crude or U.S. oil and they buy a crude basket, the basket prices are pegged to global benchmarks. Hence, a rise in Brent crude oil price would increase India’s oil import bill. It is a fact that crude oil (shown as crude petroleum) has only 1.95% weight in India’s wholesale price index (WPI). But its pervasive impact on the food prices (weight 15.26%) and manufactured products (weight 64.23%) makes this commodity as the single most influencer in the general price rise in our country.  So, no one can ignore the potential damage that spiralling crude price can have on any economy. Should we really worry about crude oil?  I show that the politics and economic imperatives of OPEC member (and non-member) nations would ensure that oil prices do not rise significantly in near future.


OPEC Members’ Disagreement

The Organisation of the Petroleum Exporting Countries (OPEC) now has 15 members and together they account for close to 45% of global oil production. Therefore, any decision by the OPEC members to reduce or enhance oil production would significantly affect global oil supply and hence its price. OPEC members have in the past been normally adhering to the production agreements reached among the members.  Economists believe that decisions of OPEC to curb oil production may influence oil prices in the short run. In the long-run, oil exporting countries may not honour any multilateral agreement on production as that would adversely affect revenue of each oil exporting country. The recent discovery of shale gas in the U.S. and growing initiative among oil importing countries to search for alternative fuel have already created some discord among OPEC members. The average oil production by OPEC members and the Brent crude price are inversely correlated (Table 1). The oil price (Brent) has declined by 40% in the past seven years, whereas the OPEC oil production has increased by only 10% during the same period. Thus, the clout of OPEC members on global oil price is declining. There could be several reasons for such weakening of influence: (a) behaviour of non-member countries in offsetting any attempt for cartelisation by OPEC members; (b) big bullies in the OPEC not honouring decisions of OPEC; (c) the U.S. turning into oil-surplus territory; and (d) emergence of alternative sources of energy.   It is interesting to note that the oil price declined by 70% in three years (2015 vs. 2012) and recovered to 2014 levels in 2016. The upward rally in crude price in 2017 is welcomed by oil exporting countries. OPEC members have agreed to a scheduled cut in oil supplies in January 2017.


Table 1: Crude Oil Price and OPEC Oil Production

Year Crude price ($/bbl) % change OPEC production % change
2012 111.94   30482  
2013 110.82 -1.00% 29919 -1.85%
2014 55.76 -49.68% 30302 1.28%
2015 35.75 -35.89% 32945 8.72%
2016 55.41 54.99% 33140 0.59%
2017 66.82 20.59% 32470 -2.02%
2018 66.62 -0.30% 33330 2.65%

Source: Bloomberg. Brent Crude prices and output data are at the end of respective years, except 2018 where the price and output figures are on November 15, 2018. Production figures are in 000 barrel per day.

However, big oil producing countries (Saudi Arabia and Russia) have not followed the OPEC consensus and in a way decided to abandon the agreement. The supply cut, which was put in force in January 2017, is going to expire in December 2018 (the next meeting of OPEC is scheduled on December 6th). With the U.S. pumping record volume of oil and prices tumbling further, the OPEC members would be under pressure to think about their next move. Many non-OPEC oil-producing countries had also agreed to join with OPEC to further limit oil production. However, here also not all the non-OPEC oil producing countries agreed to join the OPEC –mandated production cut. For example, the U.S., Canada, Norway did not join the production cut lobby.

Table 2: Oil Production: OPC Nations and Others

OPEC Nations Production cutback Non-OPEC Nations Production cutback
Algeria 97% Azerbaijan 79%
Angola 218% Bahrain 146%
Ecuador 85% Brunei 638%
Eq.Guinea 81% Eq. Guinea 95%
Gabon 76% Kazakhstan -352%
Iraq 39% Malayasia -13%
Kuwait 89% Mexico 196%
Qatar 143% Oman 92%
Saudi Arabia 98% Russia 63%
UAE 67% South Sudan -220%
Venezuela 424% Sudan 188%
TOTAL 121% TOTAL 76%

Source: Bloomberg. Production cutback indicates percentage of the target cut over the period January 2017-15 November 2018.

It can be seen (Table 2) that big oil producers in Saudi Arabia and Russia did not follow the supply cut diktat. The oil-producing giants have kept their tap open to counter any pre-emptive move to put upward pressure on the global oil price. This disagreement among oil producing nations has calmed global oil price. This would definitely benefit oil importing countries and their economy.

Oil Price and Stock Market

The relationship between oil prices and stock markets is not straightforward. While some studies find little correlation between oil price movements and stock returns, others find that oil price volatility transmits to stock market volatility.  Another study[1] finds that stock market returns do not respond to supply-side shocks, whereas positive responses are observed in cases of aggregate demand shocks. In other words, stock markets do not necessarily react to OPEC’s strategy to boost oil prices by cutting supply. Any increase in oil prices, due to increase in demand, sends signal of general economic growth and hence is treated as something positive by stock markets.  It is also believed that any impact of oil price shock on the stock market has to be examined at the aggregate level and not at firm level. Using stock market indices of oil exporting and oil importing countries, another study[2] finds little evidence of stock market being affected by oil price shock.

We look at the relationship between movements in the (Brent) crude oil price and stock indices of three oil exporting countries (Russia, Canada, and Norway) and three oil importing countries/continent (Europe, China and India). We find, using daily prices over seven year period (2012-2018), that aggregate correlation between stock market returns and crude price movements has been positive and low for both oil exporting and importing countries (Table 3)

Table 3: Aggregate Correlation[3] over the period (January 2012-15 November 2018)

INDEX Correlation with EUCRBRDT Index
IMOEX Index MOEX Russia Index (Russia) 0.21
SPTSX Index S&P/TSX Composite Stock Index (Canada) 0.44
OSEAX Index Oslo Stock Exchange All Share Index (Norway) 0.35
SX5E Index Euro Stocxx 50 Price EUR (Eurozone) 0.23
SHCOMP Index Shanghai Stock Exchange Composite Index (China) 0.07
NIFTY Index NSE Nifty 50 Index (India) 0.10
EUCRBRDT Index European Crude Dated Brent Spot 1.00
MXWO Index MSCI World Index 0.36

Data Source: Bloomberg


It may be noted that during this period, the crude oil price fell by more than 40%. It must be good (bad) news for the oil importing (exporting) countries. Yet, the correlation is very low for oil importing countries and somewhat higher for oil exporting nations. The correlation between movements in crude price and global stock market is also pretty low. Why is it so? One reason could be that oil prices are not longer relevant for stock markets as firms (in both type of countries) have adopted robust risk management techniques to mitigate impact of any fluctuations of oil prices on their profitability.

One may argue that there may be inter-temporal relationship between crude oil prices and stock market and hence the dependence is not captured when one looks at the relationship over a longer period of time. Another argument could be that the relationship would depend on the crude price regime (very high price vs. very low price). In order to address these concerns, we also look at annual correlations between stock market returns and crude price movements during periods of high crude price (2012 and 2013) and low crude price (2015). Results (Table 4) are not different.

Table 4: Annual Correlations with Brent Crude Price movements

INDEX 2012 2013 2015 2018
IMOEX Index 0.38 0.12 0.26 0.20
SPTSX Index 0.47 0.30 0.47 0.39
OSEAX Index 0.39 0.13 0.40 0.38
SX5E Index 0.39 0.17 0.21 0.23
SHCOMP Index 0.12 0.06 0.13 0.23
NIFTY Index 0.21 0.02 0.13 0.01
EUCRBRDT Index 1.00 1.00 1.00 1.00
MXWO Index 0.51 0.30 0.42 0.36
Crude Price ($/bbl) 111.94 110.82 35.75 66.62

Data Source: Bloomberg

Correlation between global stock index and crude price has been somewhat high across various oil price regimes.  Similar is the case with oil exporting countries. However, stock markets in China and India- two major oil importing countries- did not appear to bother about crude prices in both the regime. This is quite surprising.

Oil Price and Firm Performance

Though we do not find any significant relationship between aggregate stock market and crude oil price movements, firms do face market risks due to changes in oil prices. This is particularly true for firms, which sell crude oil (upstream business of oil firms) or use crude as raw materials (downstream business).  The upstream business showed stellar performance in the years (2012 and 2013) of high oil price (Table 5). The upstream profit margin turned negative for most of the companies in 2015 and thereafter. These results are on excepted lines- a sharp fall in crude price diminishes the top line of upstream business. The upstream oil major in India is an exception.

The downstream oil business, on the other hand, is a high-volume and low-margin business. Interestingly, the profit margin of downstream business, though low, has been positive irrespective of the level of crude oil prices. Investments in upstream projects increase when oil prices are high. One may notice that there had been a sharp decline in investments in upstream business since 2014. In fact, investment in downstream business increased post 2014, when oil prices softened.

Table 5: Performance of Oil Giants

2012 2013 2014 2015 2016 2017
EXXONMOBIL            
Revnue (US$ Million)                                           
Down Stream 341638 312117 289405 184615 155386 184576
Up Stream 38712 39061 37162 24053 19830 23857
Profit Margin (%)            
Down Stream 3.9 1.1 1.1 3.6 2.7 3.0
UP Stream 77.2 68.7 74.1 29.5 1.0 56.0
Change in Capex (%)            
Down Stream   -71.4 -4.8 237.6 -23.9 12.2
Up Stream   -11.0 7.9 -60.2 -96.7 5563.6
BP            
Revnue (US$ Million)            
Down Stream 345026 350150 323659 200501 166392 218053
Up Stream 29653 28047 28781 21286 15607 21261
Profit Margin (%)            
Down Stream 0.7 0.8 -0.7 2.6 4.0 NA
UP Stream 86.9 104.0 30.7 -4.5 6.0 NA
Change in Capex (%)            
Down Stream   -14.2 -31.1 -32.1 1.5 12.1
Up Stream   3.2 3.4 -13.6 -6.1 -14.2
ROYAL DATA SHELL            
Revnue (US$ Million)            
Down Stream 423638 403725 375752 236384 201823 264731
Up Stream 43431 47357 45240 6739 6412 7723
Profit Margin (%)            
Down Stream 1.3 1.0 0.9 4.3 3.3 3.1
UP Stream 51.2 26.7 35.0 -131.1 -57.3 20.1
Change in Capex (%)            
Down Stream   19.6 11.5 -15.6 6.4 9.7
Up Stream   24.0 -9.6 -47.6 -22.5 -10.4
ONGC            
Revnue (US$ Million)            
Down Stream 11984 12657 12463 10224 7811 40938
Up Stream 19059 17102 16274 16038 13377 13099
Profit Margin (%)            
Down Stream 2.3 -0.2 0.9 -4.0 1.3 5.0
UP Stream 43.3 37.8 38.0 30.7 22.4 28.5
Change in Capex (%)            
Down Stream   -45.3 -38.4 343.7 NA NA
Up Stream   -28.0 32.4 -36.8 NA NA

Data: Bloomberg. Computations: Author

Volatility in crude oil prices has intrigued many experts. However, it was difficult to predict oil prices. Studies have shown that movement in oil prices that was led by demand shock had impact on financial markets. However, attempts by OPEC members to curb oil supplies had no impact on its price nor did it have any adverse effect on stock markets. The correlation between stock market returns and oil price movements has been lower particularly for oil importing countries. This is found to be true in both high and low oil price regime.  Finally, downstream oil business was less affected by high oil prices as their product prices always passed on the crude price increase to en users. However, the upstream business of global oil majors was seriously affected during low oil prices. Therefore, both OPEC and upstream oil companies hope that the OPEC meeting in Vienna on 6 December 2018 would push for further cut in oil supplies. Not good news for global economy if that happens.

*******

[1] Kilian, L., & Park, C. (2009). The impact of oil price shocks on the US stock market. International Economic Review, 50(4), 1267-1287

[2] Apergis, N., & Miller, S. M. (2009). Do structural oil-market shocks affect stock prices? Energy Economics, 31(4), 569-575.

[3] Author acknowledges help of Mr. Anirban Banerjee, a PhD student at IIM Calcutta for estimating the correlation coefficients.

Liquidity Crisis at IL&FS – A Closer Look at the Big Picture

‘Never let a good crisis go to waste’


During September 2018, a series of announcements by the Infrastructure Leasing and Financial Services Ltd (IL&FS) Group, one of the largest infrastructure financing companies in India, revealed that the firm is going through a severe financial distress. Particularly, the public announcements informed the investors that the company had failed to meet its immediate obligations on a Letter of Credit (LC) payment to IDBI Bank, interest payments on Non-Convertible Debentures (NCDs) and other payment obligations with respect to bank loans, short-term deposits and term deposits.  These announcements took the market by surprise, and led to a significant disruption in the subsequent months. In this article, we shall attempt to explore a series of recent events that are related to the liquidity distress factors in the Indian NBFC (Non-Banking Financial Company) sector. We shall also discuss some of the major causes and consequences of these events for the Indian capital market investors, infrastructure and real estate companies, government and regulatory agencies and the broader economy in general.


How important are the issues under discussion? – A quick look at the market reaction

Even if you do not generally follow news related to the NBFC sector, the degree of market reaction to the IL&FS crisis might have attracted your attention. So, we begin our analysis by directly examining the market reactions first, before getting to the underlying events that have triggered these intense reactions in the capital market. This serves two important purposes. It will give you an insight into the market perceptions and reactions leading up to this crisis, its root causes and corrective and preventive actions. It will also enable you to see how a crisis may affect not only the corporate sector in general, but also impact your personal finance through its effects on your portfolio investments.

The table below presents the recent share price performance of some of the major NBFC companies. We compute the most recent 1 week, 1 month, 3 months and 6 months raw returns of the NBFC and Housing Finance Companies (HFCs). The highly negative returns in most of these stocks suggest the level of steep correction in the market valuation of the NBFC sector companies, particularly during the last 6 months. As evident from the table, most of the HFC stocks are trading at about half price as compared to 3 to 6 months back. The fall in share prices have been even sharper for two of the IL&FS group affiliated companies – IL&FS Transportation Networks and IL&FS Investment Managers, and Dewan Housing Finance Limited (DHFL), all of which have lost almost three-fourths of their market valuation during the last 6 months. And all three companies have been at the epicenter of the recent NBFC crisis. So, what are the causes of such sharp correction in the market valuation of NBFC stocks? What are the main concerns of the investors in these stocks? This takes us to the next section below.


Table 1: Share Price Performance of Non-Banking Financial Companies (NBFCs), as on 25-Oct-2018.


What Triggered the Panic Reaction in the Market? – Exploring the Causes

A series of defaults led the investors to panic and react the way the stock charts earlier indicated. For example, in mid-September, IL&FS Investment Managers Ltd. (IIML), one of the listed subsidiaries of IL&FS Group, announced that it had defaulted on INR 1,000 Crores loan from Small Industries Development Bank of India (SIDBI), a development financial institution. It had also defaulted on a Letter of Credit (LC) to IDBI Bank and another INR 12,000 Crores of other repayment obligations consisting of both short-term and long-term borrowings. Around the same time, there was news in the market that DSP Mutual Fund was selling the Commercial Papers (CP) of DHFL in the secondary market at a discount to its issue price (or equivalently, at a higher yield).

The market interpreted these announcements as signals of financial distress in the NBFC sector. As a result, most of the NBFC stocks came under severe selling pressure. DHFL tried to alleviate some of these investor concerns by announcing that it had not defaulted on any of its repayment obligations and did not foresee any liquidity issue in servicing their upcoming debt obligations. It thereby hinted that the secondary market sale of the CPs by DSP Mutual Fund were perhaps driven by liquidity needs of the portfolio managers rather than their concerns around the liquidity of the CP issuer. However, as the stock market reactions indicate, the market participants seemed to remain concerned about the financial soundness of these NBFCs.

So, what was it that led the investors to increase their risk aversion for portfolio exposure to these NBFC securities, and revise their valuation expectations sharply downwards? To answer this, we move on to the following sections.

Asset Liability Management in Banks and Financial Institutions – Managing the Mismatch

Banks and Financial Institutions are primarily in the business of borrowing or raising money from investors (shown as liabilities in their balance sheet), and lending them to other borrowers (shown as assets in their balance sheet). The assets (money lent) generate an interest income, while the liabilities (money borrowed) incur an interest expense. For profitable operations, these financial institutions must ensure that the average borrowing rate (cost of funding) must be lower than the average lending rate. The management of this interest rate spread is an essential component of the asset liability management operations in any bank or financial institution. This interest rate spread is often measured by the Net Interest Margin (NIM), defined as the interest income earned on the assets minus the interest expense incurred on the liabilities, divided by the interest-earning assets, and is one of the most important valuation drivers for the financial institutions.

Financial institutions actively monitor and manage this interest rate spread by optimizing the mix of assets and liabilities in their balance sheets. This involves deciding on the nature of assets and liabilities in terms of the following:

(a) Type of interest rates – fixed or floating

(b) Type of depositors and borrowers – retail or wholesale

(c) Type of maturity – money market (short-term) or capital market (long-term) and

(d) Type of denomination – domestic currency or foreign currency.

Asset Liability Management (ALM) involves managing the risks borne by these financial institutions due to mismatch between the nature of these assets and liabilities such as those just mentioned above. This includes interest rate risk (due to mismatch in nature of interest rates), liquidity risk (due to mismatch in nature of maturity profiles) and foreign currency risk (due to mismatch in nature of denominations). In the next section, we specifically focus on funding liquidity risk – the risk of inability of a firm to meet its current or short-term cash flow obligations, which is at the heart of the NBFC liquidity crisis story.

Funding Long-Term Assets with Short-Term Liabilities – Risks and Rewards

The recent NBFC liquidity crisis is primarily an off-shoot of asset liability mismatch in the balance sheets of NBFCs, as the financial institutions were relying heavily on short-term financing for funding their long-term assets. As a result, the amount of deposits and borrowings falling in short-term buckets (which were approaching their redemption dates in near-term) far exceeded the amount of repayments to be received from the loans in the same buckets. Given adequate liquidity in the money market, it can be advantageous for NBFCs to finance their long-term assets with short-term borrowings when the yield curve is upward sloping, as NBFCs can borrow at cheaper, short-term borrowing rates and invest their funds in higher, longer-term assets. This allows the NBFCs to increase their Net Interest Margins (NIMs), and earn higher profits with the same invested capital. However, such a strategy is also exposed to significant refinancing or roll-over risk, as short-term interest rates may fluctuate widely in the event of any illiquidity induced market disruptions.

Hence, when the subsidiaries of IL&FS Group announced a series of defaults on their short-term repayment obligations, and the news of mutual fund managers selling the Commercial Papers of DHFL at a discount in the secondary market became public, the market participants interpreted this information as a signal of impending financial distress for the NBFCs, and immediately became more risk averse in terms of their portfolio exposure to both debt as well as equity securities issued by the NBFCs. This increased risk aversion effectively meant that investors were now willing to pay lower prices for same NBFC securities than their prevailing prices, thereby increasing both the short-term rates in the money market, and the cost of funds of NBFCs, and adversely impacting the NIMs or profitability of NBFCs, as well as their equity valuation.

Over-dependency on Commercial Papers and Credit Rating Downgrades – Going Into a Tailspin

NBFCs were heavily dependent on the issuance of Commercial Papers for funding their long-term assets. Commercial Papers are privately placed, unsecured, short-term money-market instruments issued by highly rated corporate borrowers such as large manufacturing companies, leasing companies and financial institutions. Issuance of Commercial Papers require a minimum credit rating of A3, and have a maturity period that is typically between 7 days and 1 year. Since the yields on commercial papers were lower than the benchmark lending rates, it was beneficial for the NBFCs to borrow from the bond markets rather than the banks. On the other hand, many banks and mutual fund managers also preferred to invest their surplus funds in the money markets rather than government securities as the yields on the Commercial Papers were higher than the reverse repo rates.

However, it is risky and an ill-advised strategy to depend on short-term borrowings such as Commercial Papers as a permanent source of capital as money markets tend to be seasonal in nature, and can be susceptible to rapid tightening in the event of any adverse financial outcome. Therefore, when the subsidiaries of IL&FS Group failed to repay obligations worth INR 12,000 Crores in short and long-term borrowings, one of the Credit Rating Agencies (ICRA) downgraded the credit rating of the borrower from A1+ to Default, citing the liquidity pressure on IL&FS due to its upcoming repayment obligations. This triggered a panic reaction in the capital market, as IL&FS Group is a huge borrower, with an aggregated outstanding debt of INR 91,000 Crores, out of which more than INR 16,000 Crores were of short-term nature. The aggregate borrowings of IL&FS Group accounts for almost 2% of outstanding Commercial Papers in the money market, around 1% of Non-Convertible Debentures (NCDs) and roughly 0.7% of the entire banking system loans. Hence, any significant financial distress to IL&FS Group naturally poses a major systemic risk to the overall banking and financial system in India.

Moreover, as the Indian banks are already burdened with sizable proportion of Non-Performing Assets (NPA) in their balance sheets, they became reluctant in increasing their exposure to the NBFC sector, either through money market instruments or through direct lending. Money market mutual funds also came under heavy redemption pressure, as retail investors became more risk averse, given the significant exposure of mutual funds to IL&FS Group in particular, and NBFCs as a whole. Thus, the rapid deterioration in the credit rating of IL&FS Group led to a general loss of investor confidence in the creditworthiness as well as asset quality of the NBFCs, and a heightened risk aversion towards portfolio exposure to NBFC securities. This further tightened the money market, leading to sharp increase in the cost of borrowings of NBFCs. To make things worse, the rupee was depreciating heavily against dollar due to rapid rise in crude oil prices in the international markets and widening current account deficit. Hence, the interventions made by Reserve Bank of India (RBI) to stabilize the foreign exchange rate through open market operations were creating further liquidity pressures in the market.

Path to Redemption – In Search of Short-term Liquidity and Long-term Planning

Given the immediate liquidity distress, NBFCs are actively exploring various alternative fund raising opportunities to meet their immediate, short-term repayment obligations. This includes raising overseas debt (through instruments such as External Commercial Borrowings) and considering sale of stakes or direct sale of assets to banks, private equity funds and other financial institutions. In fact, financial institutions and private equity funds may also find this as an opportunity to selectively pick the good quality assets from the NBFCs at reasonable discounts, given their urgent needs for liquidity. In the current market conditions, NBFCs with strong balance sheet, prudent asset liability management and high asset quality will have a natural advantage in their fund raising activities. On the other hand, NBFCs with significant exposure to infrastructure and real estate projects with uncertain future cash flows will find it challenging to roll-over their short-term repayment obligations at reasonable costs. The Reserve Bank of India (RBI) has already initiated various steps to ease the liquidity conditions for the NBFCs, by increasing the ceiling for bank lending to a single NBFCs from 10% to 15%.

However, this IL&FS liquidity crisis may also serve as an important wake up call for all the participants in the overall shadow banking sector that has witnessed a phenomenal growth in the recent times, thanks partly to the less stringent supervisory rules and easier prudential norms relative to their banking sector peers. It is worth investigating, whether the rapid growth in NBFC assets came as a result of excessive lending to less creditworthy borrowers. The onus also lies with credit rating agencies to revisit some of their traditional ratings standards to include market intelligence and surveillance based inputs rather than solely depend upon historical data and management estimates of project cash flow forecasts for their credit ratings decisions. Finally, it will be important for the government and the Securities Exchange Board of India (SEBI) to initiate regulatory reforms that can address the shortcomings in their corporate governance mechanisms, and assign accountability and responsibility of top management and the board of directors for such hasty infrastructure and real estate investments alongside inadequate risk management practices, as well as the partners of the designated external audit firms for their audit failures in preventing possible misrepresentation of important financial information.

**********

An Open Letter to the CIO’s Of Mutual Funds

Dear CIO’s,

The fear over debt mutual funds, and in particular, “liquid” funds, triggered by the ILFS default, has been rising to a crescendo. This is an opportune moment for us from the investor community, both corporate and individual, to share our feedback with you, on the state of affairs.

We have reposed our faith in your asset management skills, by parking about Rs 12 lakh crores with you, in the debt mutual fund category. While we may not pay the handsome fees like the equity scheme investors, we have undoubtedly bolstered your Assets Under Management, and thereby helped you in claiming your place at the high table of the financial markets in Mumbai. But it’s not only an AUM game, many of the debt schemes are lucrative too, from your perspective.

In return, we ask for three things, like any other investor, including august ones like the Reserve Bank of India which invests the Foreign Exchange Reserves of the country: safety, liquidity and return, perhaps in the same order.

On the liquidity front, we observe that you have a tendency to cry “uncle” at the first sign of trouble. In 2008, you were bailed out by the central bank, at the peak of the Wall Street induced financial crisis. This time, by gorging on NBFC/HFC paper, you are facing a self-induced crisis and understandably expect the government and/or central bank to step in to bail out your NBFC friends and thereby your schemes as well. We as investors are fortunate to have such ardent champions on our behalf, who have no qualms in going hat in hand regularly to the powers that be, for a bailout. But we also have in our midst those who carp at the structural issues by way of liquidity facing the mutual fund industry, and the lack of concerted  effort to address it, rather than repeatedly falling back on the expectation and hope that the system liquidity provider will step in always. These pessimists in ask the unthinkable; what if the central bank one day fails to backstop liquidity, citing moral hazard in such actions to save the private sector, and to avoid complacency among NBFC’s and asset management companies.

Your reliance on the opinion of rating agencies is noteworthy. These agencies have an egalitarian approach to their fee paying customers, whose paper you buy on our behalf. “Innocent until proven guilty” goes the legal maxim. Extending this to the credit markets, rating agencies accord most large NBFC/HFC’s a “AAA” rating, unless proven otherwise. The latter scenario is where the rating agencies truly prove their mettle. No sooner a default happens, they promptly downgrade the rating from “AAA” to D. It appears that the rating scale is binary in their world.

As investors we suggest that the rating reports are taken seriously by you. Reading them before going to bed, will ensure a good night’s sleep. Your portfolio, as certified by these distinguished analysts is all “AAA”!

All those juicy fees dangled by the rating agencies’ customers in the NBFC/HFC space for their mega CP issuance, would surely not have clouded the judgement of the agencies. But here, one recalls Upton Sinclair, the American novelist, who said that “it is difficult to get a man to understand something, when his salary depends upon his not understanding it”.  We therefore suggest developing a parallel rating scale of your own. We as investors have chosen to pay you investment management fees for your credit skills. For investment decisions, if you are relying largely on the opinion of analysts at external rating agencies (“all honorable men” as Mark Antony said!), then we might as well pick up the investment papers directly. As investors we would be glad to see your internal ratings and their rationale, as part of your disclosures.

Some of us who are risk averse have invested in your Banking and PSU debt schemes. We are aghast that NBFC/HFC paper have crept into their portfolio, at times. While the fine print in your legal documents may permit you to take such exposure, this is a breach of faith, from our investor perspective. When the name of the scheme implies one thing, while the portfolio is something else, then all trust breaks down. Investors will never forgive you for losses if any, in our Banking and PSU debt schemes, on account of exposure to NBFC/HFC paper or for that matter, any non-bank/non PSU investment. The same holds good for gilt schemes too. We also urge you to research on the fiscal deficit and other parameters of state governments, impacting repayment of their State Development Loans.

Basel compliant Additional Tier 1 bonds issues by weak PSU banks, especially those under the ambit of the regulator’s Prompt Corrective Action mechanism, are best avoided, despite their attractive yields. The Basel III norms do not permit payment of interest on such bonds, unless the issuing bank has sufficient distributable reserves. Given the bottomless pit that NPA’s are turning out to be, these banks, to be Basel compliant, may have to either default or prepay the bonds with the help of the Government. While the latter route has been taken thus far, do not bet that this will continue forever.

We urge you not to expose us to duration risk in gilt funds. Your track record in dynamic bond schemes, which play on duration, is nothing to write home about. Most of you are rarely able to get the rate cycle correct on these dynamic bond schemes. Therefore, sticking to a portfolio of predominantly short term Treasury bills and Triparty repo through CCIL would remove both volatility and credit risk from the Gilt schemes. We are not greedy, we appreciate that such a portfolio will produce modest returns, but that’s the price we are willing to pay for safety.

We note that the current crisis has seen a manifold increase in the AUM’s of overnight funds. AMC’s who do not offer these schemes are rushing to launch them. The industry at last is realizing the true meaning of a liquid fund and its ideal portfolio. Keep away anything other than reverse repo and CCIL’s triparty repo from the portfolio of overnight funds. As normalcy returns sooner or later to the money markets, we trust that you will not dump your favorite NBFC paper in overnight funds, taking refuge in some obscure fine print in the scheme information documents. The current crop of liquid funds, stuffed with “AAA” rated NBFC/HFC paper, are best reclassified as Credit Risk funds (of low duration).

One of the biggest worries that we as investors in debt mutual funds face, is the fear of being the “residual or last investor” given the open ended nature of most of the schemes, barring fixed maturity plans. If a portfolio has 75% liquid/credit worthy paper, and faces a run, the first 75% of the investors who choose to press the redeem “panic button” and run for the exits, get 100% of their money back. The last 25% is stuck with the illiquid and dubious paper, and face potentially a 100% loss. Most investors are aware of this, hence any market rumour of a NBFC/non-financial corporate defaulting, will see a run on schemes which have exposure to it. The contagion can then spread to other schemes and then to the wider money markets, potentially leading to a grid lock, not unlike the extreme distress scenario witnessed during the dark days of the 2008 global financial crisis. We are currently seeing a mini version of this in India. The industry needs to work with the regulator to address this structural issue, on a war footing basis.

CONCLUSION

Your business model is enviable. Rating agencies are there to do credit assessment on your behalf, and the guardians of the financial system to handle your systemic liquidity problems in an extreme scenario. And unlike banks, you don’t have the Basel norms for capital adequacy to meet nor any reserves to keep with the central bank. If investee companies default, you pass it on faithfully to us, by marking down the daily NAV. Since all of you have near identical portfolios, there is no real individual reputational risk too. Rarely does a business produce such returns to shareholders, with negligible skin in the game. But we have a word of caution for you. The minority in our midst, are prone to lament about the investment management fees we pay you, and the value that you bring to the table. Before their voice becomes a majority, we urge you to introspect on all these facets, once the current crisis blows over.

A final word. If the government ever eliminates the tax arbitrage arising from long term capital gains benefit for investment in debt mutual funds, which is currently not available for direct investments in fixed deposits and other debt instruments, your very raison d’etre would be in question, and would require you to find a new business model or fade away into oblivion.

With best regards.

*******

Rational Expectations and the Design of a Central Bank

Many coffee room conversations in academic circles that follow the Indian economy have veered inevitably, these past few weeks, towards the headlines dominating India’s financial press: RBI’s independence, or the lack of it. For academics in the US, the situation is not completely unfamiliar: the Federal Reserve in the US, too, faces increasing pressure from the president. In fact, many other nations in the recent past – Japan for instance – have had their trysts with similar situations. On the bright side of things (at least for researchers who work on the topic), there seems to be a sudden spike in interest in understanding the foundations of Central bank independence among audiences – after a lull of many years.

  1. Rational Expectations

The roots of the movement towards Central bank independence lie in a school of economic thought called rational expectations. In a pioneering paper in 1961, John Muth, then at Carnegie Mellon University, proposed the idea that rational economic agents’ prognosis about the future should be consistent with the economic models used to predict the future. Sitting today, if an agent posited a model of the future that included the agent himself, he had to behave according to the model’s prediction when the future actually unfolded. This is a matter of basic consistency, and it represents the crux of rational expectations. Muth was a microeconomist, but very soon this revolutionary idea spread to the world of macroeconomics. The most influential adherents were based at the University of Chicago, and led by Robert Lucas, these macroeconomists fundamentally altered the way we think about the modern economy.

The 1960s and 70s were a period of great churning in central bank policy-making. The US had been facing runaway high inflation for many years and economists were at a loss on how to bring the situation under control. High inflation was destroying the livelihoods of people across the board and the repercussions were getting graver by the day. It was in this climate that two young macroeconomists, Finn Kydland and Edward Prescott, decided to attack the problem of inflation using the tools of rational expectations theory. Their main argument was intuitively easy. If politicians were in charge of monetary policy in democracies, there would be the perennial temptation to print more money. This is because an increased money supply provides a short-term boost to economic activity as well as reduces government debt in real terms. In a certain sense, it is like eating a chocolate ice-cream; in the short term things feel good. However, economic agents are rational, thus they would see through the politicians’ game. Rational agents would expect the inflation to spike as a result of the increased money in the system, and this would make them cut back on their economic activity. To cope with this, politicians would print even more money, and this would spook rational agents even more, and very soon the spiral would go out of control, destroying the economy.

This was what was happening in the US economy, these macroeconomists argued, and the way out was to entrust monetary policy to an independent authority that could rise above the temptations of ordinary self-interested politics. It was under this framework that President Jimmy Carter appointed Paul Volcker as Chairman of the Federal Reserve. Volcker’s epic battles with inflation are legendary in Central banking circles, but part of the reason he succeeded in the end was the bi-partisan he got support from politicians of the day. Volcker was appointed by a Democratic president, but many of his battles were under fought under the Republican regime of Ronald Reagan.

The success of Volcker’s term firmly established the rational expectations approach as the dominant paradigm of monetary policy. Many of the prominent academics in the rational expectations macroeconomic school – Lucas, Kydland and Prescott, among others – went on to win the Nobel memorial prize. Similar models of Central bank independence were operationalized in many countries around the world, and gradually, what was at the start a radical approach to monetary policy, became the prevalent orthodoxy taught in graduate school economics.

  1. Its Just a Theory After All

Unlike Physics, most theories in Economics are not immutable laws of nature. More often than not, economic paradigms are just a mix of astute observations and clever reasoning that provide acceptable explanations for puzzles of the day. Since economics deals with human reasoning, the theories evolve as our understanding of human decision-making process gets refined. This fluid nature of the field is a fundamental characteristic of the subject, and most academics readily acknowledge it. The key to success with economic theories in the real world, therefore, comes down to understanding the limitations of the theory, especially in the real world of policy-making.

At the heart of the rational expectations approach to high inflation lies a paradox. Recall the reason a government wants a monetary easing – it is to provide a fillip to the economy, which in fact shows that the government cares for the welfare of its people. The process of democracy institutionalizes this responsibility in the government. However, left to itself, the government trips up on this responsibility in the monetary domain much like how most of us have a hard time resisting a chocolate ice-cream. The rational expectations solution is to move the chocolate ice-cream away from our reach; in other words, move monetary policy-making away from the regular democratic orbit. Since the Central bank manages expectations for the long-term, it needs to be shielded from the short-term pulls and pressures of the democratic system. Presented in this light, rational expectations suggests a rather bleak choice: sacrifice of (short-term) democracy, or the pernicious effects of a binge of chocolate ice-cream! Observe that the problem would not arise (at least not in this form) in non-democratic governing systems. If a ruler were assured of a 50 year rule, short-termism in expectations would disappear. So in some sense the rational expectations approach says that in a healthy, functioning democracy, certain institutions need to be kept away from the rumpus of democracy. A paradox indeed!

Most problems with the modern central banking structure can be traced back to this basic paradox. In India, the problems we are witnessing are a common flavor of this paradox. Many other countries have faced similar tugs and pulls – some have chosen wisely, others have faltered. In large parts of the rich world, Central banks face a slightly different flavor of the paradox. Given many years of chronically low inflation, the Central banks now want to rev up the inflation engine. However, given that the very structure of modern central banking – independence etc. – was created to cool inflationary fears, markets have a hard time reconciling to this new stance.

  1. Look Around and the Paradox is Everywhere

The basic paradox between short-term incentives and long term expectations is not unique to banking. Corporate finance has been grappling with a similar issue for many years. Stock markets are a good check and balance on a firm, yet quarterly announcements and reports create an inevitable bias towards short term brouhaha that stymies longer term projects. Or, for that matter, employee stock options which provide short term incentives even though the job expectations might be long term. Scratch the surface, and you will find these kinds of issues in many different contractual situations.

In many ways, monetary policy is also a contract – this time a social one between citizenry and the monetary authority. The government becomes a necessary intermediary in this contract because they supposedly represent the will of the people. Yet, come to think of it, the meaning of “will of the people” is very fuzzy. When voting, do people take into account the myriad contracts that a government might execute on their behalf? Do people understand that the effects of many of these contracts far outstrip the term of the government they are electing?

The design of a robust central banking system thus links to a number of open questions in the field. When the time horizons of principals and agents do not match, how must one structure good contracts? Is there an optimal mechanism to collect opinions when a bundle of contracts need to be decided by a group? How rational are people when thinking through the long term implications of actions? We may not immediately realize it, but all these deep and open questions have a bearing on the optimal RBI-government equation. Rational expectations might provide a reasonable solution for now, but the final word on the topic is still to be written.

*************

Theory of Mind and Algorithmic Trading

A recent article in the Journal of Finance[1] argues that the heterogeneity in ‘individuals’ cognitive capacities suggests that we may observe significant differences in their financial decisions’.  Thus, behavioural finance literature claim that the failure of efficient market hypothesis (EMH) is mainly due to the variability in the abilities of the financial agents to process sensitive information in a complex financial environment.

The foundation of the EMH is based on a notion that if one financial trader makes a poor decision under the heat of emotion, another trader acting more rationally should see this as an opportunity and make an easy profit from the other trader’s mistake[2].  Thus, very quickly any individual’s irrationality (spurred by emotional outburst) will be squeezed out of the market by speculators exploiting even the smallest mispricing of assets. Therefore, due to presence of such rational economic agents (homo economicus), the price of any asset will race back to its fundamental value.  But is it possible, in real life, to read other’s mind? Philosophers talk about different layers of mind. For example, Sri Aurobindo highlighted higher levels of consciousness- the higher mind, illumined mind, intuitive mind, overmind, and supermind. These different layers help a human being better understand the ‘self’. The psychologists, on the other hand, propose that the power of mind depends on the ability of a person to anticipate another’s motive. So, anyone who simply follows what others are doing is devoid of a ‘mind’. The ability to read others’ mind is a great virtue in any social context. It may also be visible in certain sports, for example, chess.  Garry Kasparov could look three to five moves ahead during a typical chess game[3].  This ability may be limited when people interact with complex financial institutions, like financial markets. In order to reach the equilibrium price, under the EMH, the traders would require an infinite chain of reasoning capacity- ‘the seller knows that the buyer knows that the seller knows that the buyer knows’[4].

The ability to understand other person’s mental state or intentions is known in psychology as a theory of mind (ToM).  If the ToM holds true in financial markets, limit order providers in a high frequency trading environment would infer private signals from market orders. The trader would also need to know how much information other traders hold.

Theory of Mind and Human Brain

Reading others’ minds is a crucial aspect of social life. Understanding how people think about minds has long been a fundamental interest in the cognitive sciences. Recent research demonstrates that people intuitively think about other minds in terms of two distinct dimensions: experience (the capacity to sense and feel) and agency (the capacity to plan and act)[5]. Philosophers began work on theory of mind, or folk psychology, well before empirical researchers were seriously involved, and their ideas influenced empirical research. Theory of mind (ToM) is the ability to recognize and attribute mental states — thoughts, perceptions, desires, intentions, feelings –to oneself and to others and to understand how these mental states might affect behaviour. ToM attributes mental states to others in order to understand and predict their behaviour[6]. It is also an understanding that others have beliefs, thoughts and emotions completely separate from our own.  Theory of mind is called a “theory” because the mind is not directly observable. We never know for sure what is going on in the minds of other people — we can only make assumptions based on experiences with our own beliefs, emotions and perceptions. Empathy, a concept similar to theory of mind, refers to the ability to infer another’s emotional state, or to “feel” what another must be feeling. Theory of mind, on the other hand, is the ability to understand and attribute a particular mental state to a certain behaviour without necessarily feeling it or aligning oneself to that mental state.

Neuroscientists have explored the neural basis of the ToM. The typical human brain weighs just under three pounds, but it consists of approximately 86 billion highly interconnected nerve cells (neurons)[7]. Three basic functions of the brain, particularly relevant for financial decision making, are fear, pain and pleasure. The central cortex is the outermost layer that surrounds the brain. It is responsible for emotion, thinking, and information. The cortex is divided into four different lobes- the frontal, parietal, temporal, and occipital. Over time, the human cortex undergoes a process of wrinkling (Corticalization). This is due to the vast knowledge that the human brain accumulates over time. Therefore, the more wrinkly our brain, the more intelligent we are! The frontal cortex carries out higher mental processes such as thinking, decision making and planning. The prefrontal cortex covers the front part of the frontal lobe (just behind our forehead). The basic activity of this brain region is considered to be controlling of thoughts and actions in accordance with internal goals, called executive function. Executive function relates to abilities to differentiate among conflicting thoughts, determine good and bad, prediction of outcomes etc. The dorsomedial prefrontal cortex (dmPFC), a region in the prefrontal cortex, is well known to represent the mental state of other individuals- the theory of mind.

Testing the Theory

While existing literature has used experimental finance settings and neuroimaging methods to examine the applicability of the theory, we use trade and order book data from the high frequency cash segment of the stock market (NSE). Neuroimaging methods (functional magnetic resonance imaging (fMRI)) have become very popular because these are non-invasive and hence do not cause any physical pain to the subjects. Experiments are useful techniques because they allow researchers to isolate and change one variable at a time to identify causal effects. However controlled experiments have their own limitations- experimental research can create artificial situations devoid of reality. We have, therefore, decided to use market information and the behaviour of market participants to test the effect of the ToM.

We use the historical tick by tick order level data from National Stock Exchange (NSE) of India. The data is time-stamped and includes every message sent to the exchange. A unique aspect of this data is that each order message carries an exchange marked “algo flag,” to understand whether the message is coming from an algorithmic terminal or not and a “client flag” to understand whether the order is coming from a proprietary or a client account. Combining the two flags, we can segregate traders into three groups, proprietary algorithmic traders (PAT), agency algorithmic traders (AAT), and non-algorithmic traders (NAT). It is believed PAT is a superset of high frequency traders (HFT).

Relying on speed, HFT use algorithms for processing the information contained in the trading environment such as the order flow, the state of the order book, etc. and trades against the deviations of security value from its efficient price quickly. Agency algorithms are ultimately used to profit from investing in securities, whereas, proprietary algorithms are used to benefit from the temporary mispricing of a share. AAT mainly corresponds to using algorithms to break up the required order into smaller pieces with the objective of achieving average price better than some benchmark (such as Volume weighted average price). Thus, it may be said that AAT trade on the basis of price sensitive information and PAT display behaviour of uninformed traders. The issue we are trying to examine, therefore, is whether the PAT has ToM.

Using trade and order book data for the first two weeks of November 2012 (randomly selected), we observe that five large-cap stocks had witnessed trade of large market orders. We consider large market orders as those whose size exceeds 20 times the average size of the market orders for the stock-day. Then for each of the large market orders, we analyze the limit order book (LOB) for 60 seconds before and 60 seconds after the order. Large market orders are known to carry information. Hence, liquidity providers (evidenced by the state of the LOB) should be able to trade ahead of the informed trading if they have ToM. We consider two liquidity indicators-(a) bid-ask spread and (b) order depth from top five quotes. Results are reported in Table 1.

Table 1: Reaction of Traders

Note: Bid-Ask Spread is in basis points and depth indicates number of shares.

We find that overall bid-ask spread rises immediately (60-seconds) after the large market orders arrive. Interestingly, we also find that the spread computed only from PAT orders are quite large compared to overall spread as they always fear from ‘adverse selection problem’ (the threat of being cheated by informed traders). The cumulative depth (number of shares) in the top five quotes did not show any significant change after a large market order was placed. Even the depth in LOB before the large market order was not significantly different from the ones after the large order. Was sixty-seconds too short a time to react? Can’t high frequency traders (subset of PAT) read the mind of the informed traders?

We further examine traders’ reaction to a market shock. We define market shock as unanticipated change in price. We have considered only those cases in the month of November 2012 where the price of a share moved by more than 2% on a single day.

Table 2: Reaction to shock

Note: Change in price is one-day change. Net position denotes inventory at the end of a day.

Results in Table 2 show that the bid-ask spread did not follow any pattern. If PAT were able to ‘sense’ price change early, they would increase the spread on the day of the trade- which we find in the above table. However, if one looks at the inventory position of the PAT, the results are confusing. If PAT are able to ‘guess’ the action of the market traders, they should build inventory before any positive news (large positive change in price). But we find that PAT carry negative inventory the day before any large change in price. Interestingly, the PAT had positive inventory the day before for the stock (HDFC) which witnessed smallest daily positive swing. This again raises the question- do PAT have the ability to read others’ minds?  If not, they would always have the fear of losing and would seek compensation from larger bid-ask spread.

Conclusions

The results shown above cannot be generalised as the sample used is very small and one may accuse us of selection bias. However, our preliminary findings show that it is a phenomenon worth studying. It also demonstrates a new way of testing the ToM concept using market data which is not as clean as any data from controlled experiments. EMH fails precisely due to traders’ lack of ToM.


***********

[1] Corgnet Brice, Desantis Mark, and Porter David. What Makes a Good Trader? On the Role of Intuition and Reflection on Trader Performance. The Journal of Finance. Vol LXXIII, No. 3. June 2018, 1113-1137.

[2] Lo, Andrew W.  Adaptive Markets, Princeton University Press. 2017.

[3] The computer that ultimately beat Kasparov, Deep Blue, would look up to sixteen moves ahead (Kasparov and Greengard, 2007)

[4] Lo, Andrew W.  Adaptive Markets, Princeton University Press. 2017.

[5] Waytz, Adam, Gray Kurt, Epley, Nicholas, and Wegner, M. Daniel, Causes and Consequence of Mind Perception. Trends in Cognitive Sciences 14 (2010) 383–388

[6] Premack D, Woodruff G. Chimpanzee problem-solving: a test for comprehension. Science 1978; 202: 532-5.

[7] Lo, Andrew W.  Adaptive Markets, Princeton University Press. 2017.

Asset Concentration in Indian Mutual Funds: Is it Worrisome?

On 24th August, 2018 during the 2018 AMFI summit, the SEBI chairman expressed concern that despite the tremendous growth in the Indian mutual fund industry, a majority of market share remains concentrated with a few big fund houses[1]. He has called for appropriate measures to ensure that healthy competition prevails in the MF industry. He is also worried of the fact that a few big players have excessively high profits and revenue share. He stated that, “the share of revenue of seven large AMCs is more than 60 per cent of the total industry revenue. Profit margins of large MFs have also stood at a very healthy 40-50 per cent.”

The Indian Mutual fund industry has been growing at a very rapid pace, mainly due to the improved desire of the individual investors to participate in the stock markets without having to make the investment decisions by their own. For example, from March 2008 to June 2018, assets under management have grown from 5.21 lakh crore to 23.45 lakh crore.[2] Even after the global financial crisis, some fund families achieved pre-eminent status in the MF industry. For example, by the end of June, 2018 ICICI and HDFC Mutual fund individually control around 13 percent of the market share and together control one-fourth the industry market share in an industry which has 41 fund houses. At the lower end, we have Shriram AMC Limited and Sahara AMC Limited with a mere market share of 0.002 percent and 0.003 percent respectively.

From Table 1, it is interesting to see that four out of five top mutual fund houses in terms of AUMs are same in 2008 and 2018. These fund houses are ICICI Prudential, HDFC, Reliance Nippon, and Aditya Birla. These top 5 fund houses together command a market share of 52.76 % in 2008 and 57.23 % in 2018. The mutual fund industry has seen a significant increase in the AUMs over the past five years, though there has been a steady growth over the past decade. The industry has trebled in less than five years from 8.49 Lakh crore in 2013 to 23.43 Lakh crore in 2018 June. The main reason for this significant jump in the AUMs in the mutual fund industry is mainly due to the prevailing bull market over the last five years coupled with a below par performance of other investment classes such as debt, commodity, and real estate. The below par performance in several of the other asset classes triggered investors flocking to equity markets through investments in mutual funds. Especially, the mutual fund share in the equity market rose from 1.89 lakh crore to 6.84 lakh crore during this period.

Table 1: Market share of top 5 fund houses in 2008 and 2018

Top 5 Fund Houses in 2008 Market Share
Reliance Nippon Life Asset Management Limited 17.45%
ICICI Prudential Asset Management Company Limited 10.43%
UTI Asset Management Company Private Limited 9.40%
HDFC Asset Management Company Limited 8.59%
Aditya Birla Sun Life AMC Limited 6.89%
   
Top 5 Fund Houses in 2018 Market Share
ICICI Prudential Asset Management Company Limited 13.25%
HDFC Asset Management Company Limited 13.10%
Aditya Birla Sun Life AMC Limited 10.64%
Reliance Nippon Life Asset Management Limited 10.28%
SBI Funds Management Private Limited 9.96%

As seen from Table 2, there has been a significant rise in the mutual fund assets since 2008. The percentage of assets held by top 5 fund houses has been steady in the range of 53 – 57 %, whereas the percentage of assets held by top 10 funds is currently above 80 %. This shows the domination of top fund houses in the mutual fund industry. The large fund houses have excessively gained market share of the new business that has been attracting the industry over the recent years as seen in Table 2. Market share attained by the fund houses is the cumulative result of various decisions made by them and the response of the investors and stakeholders towards these decisions. It is the eventual reflection of selections made by investors, which is their disclosed preferences. Understanding the market share variable is very important as it reflects the revenue earned by the fund families as function of their AUMs. In this context, there is no surprise that SEBI is worried about the disproportionate market share of mutual fund assets. But, the evidence in the mutual fund industry around the world show that there are economies of scale and scope in the industry and as a result of this fund family size has an important effect on profitability.

Another issue that the SEBI chief is worried about is the impact of Total Expense Ratio (TER) on the profitability. “You would appreciate that from an overall industry perspective, some thinking is definitely required to bring in elements that facilitate a healthy competition in the industry”, said Mr. Tyagi[3]. This statement is reasonable as the revenue of the top most funds is in India is in the range of 60% of all the industry revenue. And the profit margin of the top fund houses is in the 40 – 50% bracket. The fund houses attain this disproportionate revenue with an average 0.75% to 2.5% TER, especially in the equity segment which is quite intriguing for SEBI. However, fund houses that charge a higher fee and do not pass the benefits to the investors will in the long run lose the market share. Also, not all types of fees have a negative relation with market share. We can expect a positive relation between market share fees charged for marketing and distribution expenses.

Table 2: Market Share of Top 5 and Top 10 Mutual Fund Houses

Year AUM (Crore) AUM of Top 5 MFs Share of Top 5 MFs AUM of Top 10 MFs (Crore) Share of Top 10 MFs
June-2008 554769 294893 53% 415861 75%
June-2009 660099 381007 58% 525826 80%
June-2010 667086 389376 58% 538754 81%
June-2011 735300 410554 56% 587736 80%
June-2012 688541 377104 55% 545286 79%
June-2013 849510 451448 53% 664201 78%
June-2014 993234 541054 54% 776621 78%
June-2015 1234432 685215 56% 985018 80%
June-2016 1446453 824275 57% 1164729 81%
June-2017 1957073 1112749 57% 1586704 81%
June-2018 2344590 1341721 57% 1896794 81%

While Mr. Tyagi and SEBI are concerned about this excessive market share as well profits by the top fund houses, industry veterans say that this is not something to worry about as this an organic form of growth in a progressive industry. Firms in an industry gain the market share if they are ready to compete in a growing environment. Especially in the Indian MF industry, fund houses which took advantage of the growth opportunities with their superior management skills as well as a stable corporate governance mechanism benefited the most. I agree with Mr. Tyagi that the MF industry with more number of players and healthy competition would benefit the customers, however it is true of most of the industries that few big players account for nearly 70 – 80% of the revenue. The analysts following the Indian MF industry have observed that big fund houses have been able to successfully consolidate their positions with their timely investments penetrating into smaller cities and towns over the past few years. This is not the case only in India, but across MF industries in the world.

Several other factors have also contributed to a positive market share in MF industry. There are several features of performance that enhance the market share; the objective-adjusted returns generated by the fund families, and at least one top performer in the family. Another important factor which led to an increased market share by some of the fund houses is their superior innovative abilities compared to their competitors. However, industry commentators say that high level of innovation will have a negative impact on market share. It is to be noted that investors are highly sophisticated due to the vast amount of information available in the public domain, and due to this fund houses initiating new schemes that are similar to existing funds have a less impact on market share. Finally, this trend of market share concentration is not specific to MF industry alone. This is even higher in the Indian insurance industry, where LIC commands more than 70% industry share with respect to the insurance premiums. Private insurance companies such as HDFC, ICICI, SBI along with LIC command more than 85% of the industry share. In the similar lines, off late some of the private banks as well as automobile firms have been commanding significant market share in their respective industries.

**********

[1] https://www.business-standard.com/article/markets/limited-competition-in-mutual-funds-irks-sebi-ajay-tyagi-calls-for-reforms-118082400042_1.html

[2] Author’s own computations. Data source: ACE Mutual Funds

[3] Retrieved from https://www.thehindu.com/business/sebi-to-review-mf-expense-ratio-limits/article24763045.ece

Mudra Loans In The Eye Of The Storm

Ten years back, the collapse of Lehman brothers with its trillion dollar balance sheet nearly took down the global financial system with exotic financial products like credit default swaps and collateralized debt obligations contributing to the debacle. A decade later, Raghuram Rajan, the former governor of the Reserve Bank of India has raised the prospect of fresh trouble for the Indian banking system from a much more humble source, micro loans up to Rs 10 lakhs. Dubbed Mudra loans, these are under the aegis of the Pradhan Mantri MUDRA Yojana (PMMY) scheme.

The loans are provided to non-corporate, non-farm small/micro enterprises and are sanctioned by Commercial Banks, Regional Rural Banks, Small Finance Banks, Cooperative Banks, Micro Finance Institutions and NBFC’s. Data reveals that lenders are predominantly public sector banks and micro finance institutions. Private sector banks have small size portfolios except for one well known Kolkata head quartered bank which has origins in micro finance. This bank has built up a significant Mudra loan portfolio.

The targeted beneficiaries are from the non–corporate small business segment comprising of proprietorship / partnership firms running small manufacturing units, service sector units, shopkeepers, fruits / vegetable vendors, truck operators, food-service units, repair shops, machine operators, small industries, artisans, food processors and others, in rural and urban areas.

The objectives of the scheme are laudable. The burgeoning salary earning middle class with corporate jobs and cozy retirement nest eggs, often forgets that the unorganized sector provides the livelihood for the vast majority of the population though lacking formal sources of financing. The Mudra portal has several success stories of micro businesses benefiting from this scheme.

Rajan’s voice is highly respected in the Indian and global financial community. Tucked away in a small corner of his recent 17 page note to the estimates committee of Parliament on bank NPA’s, is an almost passing reference to Mudra loans, exhorting the need for closely examining them for potential credit risk, and in that context also seeking urgent attention to the “growing contingent liability” emanating from The Credit Guarantee Scheme for MSME run by SIDBI. Despite taking up just a couple of lines in an otherwise lengthy report, the media has given wide publicity to this part of Rajan’s report.

So why should tiny loans less than Rs 10 lakhs to the likes of shopkeepers and auto rickshaw owners attract so much attention? The numbers tell part of the story. Even since the PMMY scheme was launched in 2015, the amount disbursed has grown by leaps and bounds to Rs 6.5 lakh crores, with a CAGR of about 35%. While this may constitute circa 5% of the asset size of Indian banking, potential high levels of defaults and a growing loan portfolio of the Mudra loans, may add to the current pile of non-performing loans (NPA) of more than Rs 10 lakh crores. In all fairness, NPA figures for the Mudra loans are not available thus far in the public domain. But Rajan having been at the helm of the banking regulator, must be basing his concerns on solid grounds.

Applying the traditional risk parameters for assessing corporate loans or the credit score based risk assessment for consumer loans pioneered by Fair and Isaac of FICO score fame, does not serve the purpose for Mudra loans.

Similar to commercial loan proposals, assessing “project viability” for Mudra loans is emphasized by lenders. Recently SIDBI called for “credit counsellors” to be empaneled by it to help small businesses in preparing project reports. At the other end of the spectrum, the disastrous fate of the multibillion dollar projects appraised by the capital markets arm of India’s storied public sector bank staffed by top business school graduates, is well known. Project appraisal needs to go much beyond an exercise in number crunching in a spread sheet.

The Mudra loan scheme excludes seeking collateral from borrowers. Only the assets financed by the lenders can be taken as security. What criteria do banks then adopt? The eligibility criteria for the Mudra scheme loans available in the portal of the largest commercial bank in India is pretty basic: potential borrowers should be residing in the same locality at least for the last two years, should not be a defaulter to any financial institution, and should have undergone some training.

Significantly, Mudra loans by banks are covered under the Credit Guarantee Fund for Micro Units (CGFMU) with the premium cost to be borne by the borrower. The fund comes under National Credit Guarantee Trustee Company, set up by the Government of India, thereby shifting the significant part of the credit risk to the tax payer.

Here are some salient details of the credit guarantee coverage for Mudra loans. Based on the amount in default,

  1. First Loss to the extent of 5% will need to be borne by the lender
  2. Out of the balance portion, the ‘extent of guarantee’ will be to a maximum extent of 50% of ‘Amount in Default’ in the portfolio, subject to maximum cap of 15% of the portfolio.

While banks are not entirely off the hook, public sector banks account for nearly half the Mudra loans, thereby shifting losses on account of future potential NPA’s back to the tax payer.

Here, Rajan laments about the growing contingent liability for the Government’s credit guarantee fund. The contingent liability to the tax payer would get fructified sooner or later in the event of large scale defaults. The number of Mudra loans sanctioned thus far is nearly 14 lakh crores. While this may not translate into the exact number of beneficiaries, the numbers are still mind boggling. It would be a political disaster as well as a nightmarish process for public sector banks to collect the defaulted loans back from the vast numbers of these tiny borrowers. Are they then essentially a handout from the Government masquerading as loans?

Herein lies the nub of the issue. The vast majority of the current NPA’s of about Rs 10 lakh crores is on account of lending to corporates. Gold plating of projects in the form of over invoicing of costs, alluded to by Rajan as well, means that there is very little, and often negative equity from well-connected promoters in bank financed projects, which have turned NPA’s. These few elite promoters continue to lead tax payer funded lives of luxury either in India or in safe havens abroad, away from the reach of the Enforcement Directorate, the CBI and Indian courts. Would it not be ironic if tax payers also need to pony up for NPA’s in the tiny Mudra segment where borrowers numbering in crores, are from the poorest strata of society?

Which segment of the tax payers is ultimately picking up the tab for defaults from the corporate promoters and potentially from the Mudra scheme borrowers? It is the few honest corporate tax payers and the vast segment of the middle class salary earners who have no choice in paying taxes on account of it being deducted at source. Maybe the middle class too should figure out a way of going hand in hand to the government for tax payer funded handouts, thereby balancing the scales now heavily tilted towards both crony capitalists and tiny borrowers at the opposite ends of the spectrum!

*******