Valuing Start-ups- Part I

The start-ups in India, as in other parts of the world, are having a dream run over the past four years. The startup India campaign of the Government was able to create a friendly ecosystem that has emboldened young minds to innovate, take risk, raise funds, and flourish. Private equity and venture capital funds are chasing startups that have massively grown in scale, irrespective of whether the idea is really disruptive. During the first quarter of 2018, startups and growth-stage ventures in India, excluding Flipkart and Paytm, have raised more than $2 billion from private equity market (Table 1). Notable among them are Bigbasket ($300 million), Zomato ($200 million), Gaana ($115 million), and Swiggy ($100 million).  Tech-based retail raised almost $700 million in past three months, closely followed by Finance (including FinTech).

How many of these companies (Table 1) really have innovative ideas? Well, innovation does not necessarily mean absolutely new and untried inventions. Innovation includes process innovation and in that respect most of the successful startups in India have demonstrated ability to scale up quickly.  Gaana, a music streaming platform, has about 60 million subscribers and witnessed a 700% increase in its Internet services accessed by customers in the past one year.  Established in August 2014, Swiggy, an online platform that delivers food from restaurants, delivers more than 100,000 orders per day. It has raised more than $255 million in past three years. Lendingkart, an online platform that provides working capital loan to SMEs, which was also incorporated in 2014 had reported a registered user base of 450,000. It has raised more than $173 million so far. Thus, funds chase those start-ups that chase growth.

Table 1:  Funds raised in private equity market (January-March 2018): Select List

Month Company/Startup Amount ($M) Sector Lead Fund
January Indiabulls Housing Finance    154.0 Housing Finance Yes Bank
Mediplus    117.6 Healthcare Goldman Sachs
Rivigo      50.0 Logistics SAIF Partners
Neogrowth      46.4 FinTech Leapfrog Investments
February Bigbasket   300.0 Retail Alibaba
Zomato   200.0 Retail Alibaba
Swiggy   100.0 Retail Naspers and Meituan Dianping
Lendingkart  87.0 FinTech Fullerton Financials
Browserstack  50.0 IT Accel
March* Gaana 115.0 Entertainment Tencent
  Grofers  61.3 Retail SoftBank
  Chargebee   18.0 FinTech Insight Venture Partners
  TOTAL 1299.30    

* Up to 26 March 2018

Source:  Tracxn and Internet

Start-up valuation is quite challenging and it is more an art than a science. Traditional valuation methods may not apply in most cases. The life cycle of funding of a start-up includes bootstrapping, grants, angel investments, venture capital (VC) funds and private equity (PE). Thereafter, any start-up will have to raise public equity. Of course, venture debt is now available to start-ups, which have already accessed venture fund. Banks would normally avoid financing a startup due to uncertainty and lack of collaterals. Valuation of any start-up, therefore, would depend on the stage of financing life cycle. Valuation method at grant stage would be quite crude and even at angel stage financing happens mainly on the strength of the team and the idea. Sophisticated valuation methods are used when institutional funding (e.g. VC and PE) is accessed by any start-up.  Valuation methods used by a PE are similar to the ones used for IPOs (Initial Public Offer).

Therefore, I will try to cover various methods of valuation of start-ups from idea stage to public listing. The multi-part essay will discuss various valuation techniques applicable for start-ups. This article looks at valuation of ideas.

Valuing Idea

How do you value an idea that does not even have a prototype or proof of concept? It is impossible to value an idea that does not have a minimum viable product (MVP)and hence no one would like to fund such an idea. Ideas may come easily if one has keen observation power. However, idea does not fetch money. One needs a committed operator to give shape to an idea that is eventually accepted by the market. Such an operator is called an entrepreneur. An entrepreneur has to get the prototype made with own (including family) money and secure customer validation. Making prototype (proof of concept) is no more costly in India with availability of affordable infrastructure. For example, entrepreneurship development centres in colleges/universities, fabrication labs in technical universities, and incubators supported by the Department of Science and Technology (DST) and Atal Innovation Mission (AIM), Government of India. These institutions or facilities are willing to provide small financial support sufficient to make a few prototypes for testing purposes.

The most important questions in any valuation exercise are (a) who are your customers? (b) how much is the market opportunity? and (c) how much market share one can capture? If a start-up does not have MVP, answering these questions would be almost impossible. Answering the first question (know your customer) is not always easy. On many occasions the beneficiaries may not be the ones who would pay. Famous examples would include Google and Facebook. Google and Facebook control almost 70% of the digital advertisement market. However the majority of the registered users/subscribers of these two Internet giants do not pay for the services. So, Google’s revenue will be driven more by the growth in digital advertisement spending and less by the linear growth in search engine hits.

Idea needs to be priced. Lot of it would depend on the quality of the innovator and her team. The problem with any innovator is in many situations, the inventor may have no clue about the MVP and hence price. In order to get close to the stage of pricing, ideas must be given shape in terms of proof of concept or prototypes.

Even for an established company, which has been into business for many years, pricing a new product or solution is difficult. Take the case of a tractor company that has in its stable an army of tractors of different capacities with maximum engine strength of 32HP (horse power). The tractor company now wishes to launch a new generation of tractors (Generation Y tractors) of 64HP. What should be the price of this proposed high-powered tractor? How much will be the business volume? Will it cannibalize business of its existing tractors? The company had never had such a tractor nor did any other company in India. So there is no compatible data available. The only way the tractor company may try to estimate the launch price of the tractor and the business volume is through a detailed market research. Such research will involve talking to prospective customers (i.e., farmers), identifying whether such a high-powered tractor is at all necessary and knowing what problem of existing users is the proposed tractor going to solve. The research will also help identify the unique selling propositions (USPs) of the new vehicle and perform a proper quality function deployment (QFD) to design the specifications of the tractor. Such an exercise will also help in arriving at the bill of materials (BOM) cost of production. Next question will be what is the USP of this tractor and whether the prospective customers would be willing to pay the price for each USP. For example, if the noise-level of the proposed tractor would be lower than the existing ones, would a customer be willing to pay any extra price for such a feature? If yes, how much more? Answer to these questions would perhaps give some idea of the extra price that a prospective customer will be willing to pay for the new product. It is a well-known fact that in a competitive market, price of a product is not determined by its cost of production. It rather depends on how much a customer is willing to pay (target price). Estimation of business volume for the new tractor would depend on how many of the respondents would like to migrate to the higher version of the tractor. The entire exercise may take anywhere between 6 and 12 months to obtain three basic input for valuation, i.e., the target price, market potential (size), and sales volume.  One would argue that it is still easy to price such a new tractor in view of the fact that the company understands the business and has good track record.

Things get further complicated if one wants to set up a new business. Suppose you want to set up a coffee shop chain in one of the metros of India. You plan to set up five coffee outlets in the city. How will you find out your revenue for the first year? It may appear very easy to estimate revenue of this venture as the nature of the business is well known and customers are clearly identified. Even then it may prove difficult to value such entities. Suppose you obtain annual revenue, floor space of outlets, and number of outlets of your competitors in the same city for the past three years. It may be noted that obtaining these information is extremely difficult. Using available information, one may find out two relevant multiples: (a) revenue per outlet, and (b) revenue per square foot. Can the proposed new outlets use these multiple to estimate its first year revenue? If the average annual revenue per outlet of the comparable firms is Rs. 10 million, can the new entity estimate its first year revenue as Rs. 50 million for the five outlets together? The answer is a clear no. Expected revenue per outlet of the new business would depend on the location of the outlet. If an outlet is located in central business district (CBD), average footfall will be higher, but for a limited number of hours. Similarly, if another outlet were set up in a shopping mall, it would expect more customers than one in a residential area. However, the final decision about location of outlets will depend not only on the expected revenue from that area but also on the cost of renting that space. Though an outlet in a shopping mall will enhance the probability of higher daily revenue, the cost will also be higher. The unit economics may show that it would be prudent to set up the coffee outlets in a residential area where the contribution margin could be higher even with a lesser volume. Another advantage of having a coffee shop in a residential locality is long hours of moderate business. Such predictable daily business volume would help the outlet utilize its capacity and staff better. Therefore, the new entrepreneur will have to first decide about the location of the outlets before estimating daily business volume. Next issue that the entrepreneur will face is visibility. How to get the first customer into a new coffee outlet? Customer acquisition cost is quite stiff in such business and the entrepreneur may have to spend a sizable amount in initial years for promotion of its business to get the desired business volume. Interestingly, if the outlet is in the CBD or a shopping mall, a minimum business volume will be assured with no or moderate promotion. Therefore, it may be prudent for the entrepreneur to diversify the location of the proposed five coffee outlets to CBD, shopping mall and residential areas to maximize business volume.

The third example is a tricky one. This is an absolutely innovative business with no parallel.  Suppose you have invented a portable brain-imaging machine that can do 50% of the job of a brain scanner at a much lower cost. The imaging machine uses Bluetooth technology to send image of a brain to a nearby hospital within a radius of 2 km. Such image will provide input sufficient for a neurologist to understand possible damage caused to the brain. Consider a road accident where a person having head injury with no external marks on the body was not immediately attended by the rescue team and normally sent home. Later the person may experience severe pain in the brain and develop symptoms of brain damage (e.g., vomiting, fainting). When that person was finally taken to the hospital, he (she) may have lost life due to delay in treatment. The proposed brain-imaging device may save such patients. No one would disagree that it is a socially desirable business proposition and hence should be supported.  Who will be the paying customer- the patient or a hospital or an insurance company? Patient will definitely not be a customer. A hospital will not have any incentive to buy such a device as it would have already invested in brain scanner, MRI machine, and other sophisticated devices. The insurance companies may be interested in such a product to minimize compensation claims on avoidable deaths. Therefore sometimes understanding who is your customer is a vital question and that will determine the potential revenue of the start-up. Should the founder therefore follow-up with the insurance companies with the MVP? Another related question would be on the business model. Is this a product or service business? Should the founders sell product or brain images? This is a vital question and the revenue estimation and fund requirement would depend on the business model. If it were a product business, revenue would be higher with associated problems of inventory management, logistics and distribution. If it is a service business, revenue would depend on usage of the device and upfront investment would be higher with longer gestation period for recovery of investment. The pay-for-service model would require additional investment in data storage and processing. The problem with valuing such ideas is that there is no comparable. The proposed device cannot be compared with a scanner and hence its business volume. Scanner would be far more efficient and hence costly. Also, the proposed imaging devise is not a substitute for the scanner. Therefore, estimating the market potential and revenue of such devices using brain scanner, as benchmark would be extremely risky.  Another problem with any medical device is that it needs certification of appropriate authority before it can be administered on any patient. Such certification in turn would depend on the use-cases. Therefore, the inventor of such a device would need to make dozens of prototypes and get some hospitals/ ambulance services use it for evaluating its efficacy. No one would talk about revenue till the idea is converted into an acceptable product that has got ‘satisfactory’ certificate from users.

The above examples highlight that it would be futile to try to value any new idea without an MVP. What is required at the stage of idea is to evaluate (a) what is unique in the idea? (b) is it possible to get a viable product from the idea; (c) how much investment would be required to get the first ten customers? It is only then one can think about valuing an idea. So, a winning idea will be funded on the strength of the team and how quickly it can be taken to the market. No valuation is necessary at this stage.

The next part will discuss valuation of pre-revenue companies.


Health or Wealth? An Automotive Dilemma

The debate on ‘environment vs development’ is undying and in spite of various polarized views on this debate, the world is always looking for a sustainable trade-off. Gradual change of climate, especially global warming, is a continuous threat towards the society. Hence, committed efforts from all stakeholders across countries are highly desired to achieve that trade-off. Further, phenomenal increase of air pollution caused by the vehicular emission has compounded the problem. India, in last few decades, has experienced a massive growth in automobile industry[1] and thus gets acutely affected by the menace of air pollution. As a controlling measure, the regulatory authorities have mandated vehicles to adhere to the certain standard norms of emission.

These standard norms have been evolved since enactment of ‘Bharat’ Stage (BS), the set of emission standards established by the Government of India to curb emission from motor vehicles. BS I and II were introduced long back in 1999-2000. Afterwards, mass-emission standards BS-III and BS-IV had been laid down in 2009. Each such progression denotes stricter norms of emission. Although India had been following BS-III regime from 2010, it had to take a shift to BS-IV regime by April 1, 2017. The progress of India in this regard is still lagging behind than its western counterparts as the developed nations had moved onto Euro 4 (January, 2005), Euro 5 (September, 2009) and Euro 6 (September, 2014).  In view of this, on March 29, 2017, the Supreme Court of India took a significant step by placing a ban on registration and sale of BS-IV non-compliant vehicles on and after April 1, 2017. However, the issue of whether the accumulated inventory of BS-III compliant motor vehicles manufactured on or before March 31, 2017 can be sold from April 1, 2017 onwards had been raised before the Supreme Court. The arguments in favor of such demand cited ‘weak market forces’ and ‘demonetization’ as potential barriers for clearance of stock. Moreover, the past two instances[2], where industry was allowed to offload accumulated stock even after the timeline, had brought into notice. However, this argument was refuted by the Supreme Court and the ban on sale of BS-III compliant vehicles has been sustained.

Immediate reactions:

The apex court’s order to ban BS-III vehicles appeared as a ‘shock’ for the automotive industry. It created an initial panic and some uncertainty over inventory of vehicles, their registrations and piling up stocks at the Original Equipment Maker’s (OEM’s) stockyards. Mahindra and Mahindra released a statement stating that the ‘unexpected ruling will have a one-time material impact.’ Tata Motors, the largest commercial vehicles manufacturer in the country said in a statement:

“The Supreme Court order banning sale of all BS-III vehicles from April 1 is an unexpected and unprecedented move that will have a material impact on the entire automotive industry, OEMs’ and dealer networks and is a penalty to the entire automotive industry…”

This sudden decision had left industry with two choices: either to export the existing BS-III vehicles after offloading maximum in three days (29 March, 2017 – 31 March, 2017) while providing heavy discounts to the customers or to upgrade the entire lot of BS-III into BS-IV compliant vehicles. The issue with the second option, i.e. to upgrade the vehicles to meet newer norms, was that it required huge time and resources to modify the engines and also there was lack of availability of BS-IV compliant fuel.

President of Society of Indian Automobile Manufacturers (SIAM) and MD of Ashok Leyland, Mr. Vinod Dasari commented: “While no one pushed for BS4 fuel availability for 7 years to change over faster, this sudden decision – just a few days before the changeover – is rather unfortunate as it causes undue stress on the entire industry, and causes loss of jobs. Auto Industry, anywhere in the world, requires a stable and predictable policy which allows for long term planning and investments”.

Another statement released by the industry representing body, SIAM, stated:

“Auto Industry is law abiding and is in full compliance with the emission norms set by Government that stipulates date of “Manufacturing”. The historical implementation of emission norms also reinforces the current law that stipulates “manufacturing”. Auto Industry has had the capability of making BS4 vehicles since 2010, but lack of proper BS4 fuel prevented it from selling such vehicles, nationwide. Running a BS4 vehicle with BS3 fuel can cause severe problems to some vehicles.”

Despite such reactions from the market players, few players had been found to be proactive in this respect. For example: Toyota had implemented BS-IV technology a year back and was least affected by such ban. Few auto companies even welcomed this decision. Chairman, MD & CEO of Hero MotoCorp, India’s largest two-wheeler manufacturer, Mr. Pawan Munjal said:

“I welcome this move by Supreme Court in the interest of public health. Hero MotoCorp, recognizing the need of the hour, carefully planned a proactive move to switch from BS III to BS IV compliant products across all our range well in time and have been producing only BS IV compliant products since one month before the given deadline. We have reduced our BS III inventory significantly in the past few months with the aim to minimize our stakeholder losses.”

Actual impact:

Impact from Discount Offered:

The commercial vehicle segment produced large inventory and continued manufacturing BS-III vehicles till March with the expectation of higher sales in April given the expected price increase of 8 – 10% on BS-IV vehicles. As per the CRISIL report, the cost of heavy discounts and incentives for commercial vehicle manufacturers amounted to INR 1,200 crore (approx) till March 31, 2017. In addition, INR 1,300 crore had been incurred as a cost of disposal of the unsold inventory (including exports). Although, the commercial vehicle segment experienced an impact of 12% value on inventory, pure player like Ashok Leyland was most affected. Others like Tata Motors or Eicher had been cushioned by their other product offerings.

The impact on two-wheeler segment and passenger car segment were quite insignificant. Two wheelers, such as BS-III bikes and scooters were sold with discounts up to 30%. ICRA estimated the loss faced by this segment due to discounts to be around INR 600 crore. On the other hand, the passenger car segment stayed largely unaffected as it had mostly shifted to BS-IV regime from beginning of last year. But 10-30% discounts and freebies assisted the dealers to clear most of the stocks in last three days of March.

Impact on Inventory:

According to the CRISIL report, the impact of ban on the level of inventory was comparatively low for the companies like Bajaj Auto, Yamaha and Eicher as they had already upgraded their inventory to BS-IV from January 2017. Even market leader Hero Moto Corp, and two others, namely Honda and TVS Motors, had upgraded most of their models before the ban set in. The report mentioned that 25% of the banned vehicles are expected to go to exports. At the time when the ruling came, the two-wheeler segment was holding an inventory of 6,70,000 BS-III models amounting to INR 3,800 crore which is approximately half of monthly sales of the automobile industry.

Impact on Estimated Profit:

To address the challenge of placing unsold inventories, the companies started exploring export markets and converting the vehicles to BS-IV. The cost of the vehicles increases by 8-10% in the process of conversion. According to the research firm Nomura, the Net Profit margins of the automobile firms had been impacted by this ban and the estimations are as shown below in Table-1:

Table 1: Net Profit Impact (as estimated)

Inventory (Units) Total Cost (Cr)* Name of Company Net Profit (estimated)

FY 18 (Cr)

Net Profit impact (%)
18,000 281 Ashok Leyland 1,435 19.6
11,300 149 Eicher 2,274 6.6
20,015 162 Mahindra & Mahindra 3,722 4.4
300,000 163 Hero MotoCorp 3,844 4.2
75,000 381 Tata Motors 14,249 2.7
65,000 9 Bajaj Auto 4,469 0.2
* Net impact after exports, retrofitting, discounts and inventory carrying cost

Source: Nomura Research

Impact on Stock Market:

On the date of announcement of the ban, the automobile market reacted negatively as expected. Although BSE Sensex and NSE Nifty were up by 73.96 points and 25.55 points respectively on that day, S&P BSE Auto sector and S&P Nifty Auto were down by 186.89 points and 42.05 points respectively. More specifically, those automobile manufacturers who had large amount of unsold BS-III vehicles in their inventory experienced a major blow. Table 2 lists down the stocks which had been significantly affected by the decision.

Table 2: Changes in Stock Prices

Company % Change
Hero MotoCorp -3.67%
Ashok Leyland -2.66%
Bharat Forge -1.13%
Eicher -1.08%
Tata Motors -0.95%
Maruti Suzuki -0.65%
Mahindra & Mahindra -0.61%

Source: www.zeebiz.com

Overall, it has been found that the shareholders of automobile industry had suffered an erosion of INR 88,390 million (approximately) in their wealth on the day of announcement of ban on BS-III vehicles. These results clearly indicate that the investors penalized the industry for its ‘wait-and-watch’ approach and lack of proactivity.

Challenges ahead:

When the debate on ‘environment vs development’ turns into a debate on ‘health vs wealth’, it is quite imperative that the stakeholders would give preference to ‘planet over profit’. On this particular event of banning BS-III compliant vehicles, the decision taken by Supreme Court of India shows the long term vision and priority of the apex court in achieving health of India. According to the experts and environmental bodies, moving from BS-III to BS-IV regime would significantly reduce overall pollution in the cities which have become notorious toxic chambers of vehicular emissions. Apart from demonstrating nobility, the decision carries significant managerial implications for the automotive industry. The quote from Ms Anumita Roy Chowdhury, Executive Director of Centre for Science and Environment (CSE), on ban of BS-III was as follows:

“This is a significant step forward as this gives the message and the lesson that the automobile industry will have to walk the extra mile to address the expansive concern around public health and not weigh down the transition by taking a very narrow technical view.”

At this juncture, such comment is more relevant as India has already decided to move to BS-VI compliant regime by 2020 while skipping BS-V. Expectedly, this will lead India achieving emission standard as par developed countries. However, the path is not so smooth. The automobile industry of India should now shift gears and need to be more proactive in adopting state-of-the-art green technology to manufacture BS-VI compliant vehicles. If such up gradation can be treated as an investment for a healthy future, then only a giant leap towards sustainable development can be possibly attained.

[1] The automobile sector alone contributed 7.1% of India’s overall GDP, 4.3% of overall exports and was accounted for 8% of India’s entire R&D expenditure in 2014 (GOI, 2016)

[2] After the cut-off date of April 1, 2005 BS-I and BS-II compliant vehicles and after the cut-off date of April 1, 2010 BS-III compliant vehicles were permitted to be sold, until the stock had been exhausted

Central banks act in tandem to unwind a decade of easy money

Long before the Great Recession that struck the United States in the aftermath of the financial crisis, Japan was in the throes of a multi decade era of low growth and deflation following a boom and bust phase. Years of zero or negative interest rates failed to move the needle on inflation. Emerging market denizens perennially worried about high inflation eating into savings and affecting purchasing power, may wonder what the fuss is all about. Noted economist Paul Krugman explains in a New York Times post that deflation causes people to spend and borrow less thereby keeping the economy in a depressed, deflationary trap, raises real debt levels and leads to fall in wages though he also highlights downward nominal wage rigidity. Therefore goal of monetary policy is not price reduction (negative inflation) but price stability, in other words low and stable inflation. Detractors of Keynesian economics may of course, disagree on the demerits of deflation.

The United States too has been struggling to reach its inflation target of 2% ever since the 2008 crisis. Bringing down the Federal funds target rate to 0% and asset purchases through the New York Fed resulting in a balance sheet of $4.5 trillion dollars, did not help in moving up inflation.

The European Union too has been struggling with poor growth and again low inflation. Apart from the ripple effects of the financial crisis originating in the US, the EU saw one debt crisis after another spanning across Portugal, Italy, Ireland, Greece and Spain. The European Central Bank brought down interest rates below zero and resorted to massive asset purchases to revive the economy.

Until recently, the effect of the central bank intervention globally, appeared to have had the primary effect of inflating asset prices, with stock indices touching all time or multi year highs, be it the Dow Jones, Nikkei, Hang Seng or other market indices. But inflation and growth remained below expectations.

The tide turns

Starting with the US, the news from all the major economies in the world has turned positive since the middle of 2016.

The January 2018 statement issued by the Federal Open Market Committee which decides monetary policy in the US, cites continued strength in the labor market, economic activity rising at a solid rate and low unemployment rate. Inflation is expected to move up and stabilize around the Committee’s 2% objective in the medium term. Earlier in June 2017, the FOMC laid out a calendar for a gradual winding down of the Fed’s massive holding of $4.5 trillion of Treasury securities, agency debt and mortgage backed securities built up during the quantitative easing phase, up five times from its pre-crisis balance sheet level of $900 billion. But the recent tax cuts approved by the US Congress is in effect a $1.5 trillion dollar stimulus which can exacerbate inflation. The latest job growth numbers for February 2018 was beyond expectations. The market expects that the FOMC could go beyond the projected three rate increases this year. 10 year Treasury yields have surged to 2.9%. Yields reaching 3% are considered a line in the sand for financial markets.

At Japan, while the short term policy interest rate continues to be in the negative, the Governor of the Bank of Japan, has started taking of an end to monetary stimulus from next year, something which was practically heresy till now. The central bank now expects inflation to reach its 2% target in fiscal 2019. Unemployment rate has fallen to multi decade lows. The central bank has an upbeat view on the economy now.

The European Central Bank joined the other major central banks in dropping its easing bias. In a surprise tweaking of language in its March 2018 monetary policy statement, which is closely watched by the financial markets, the ECB dropped its previous commentary that “it stands ready to increase the asset purchase program if the outlook becomes less favorable or if financial conditions become consistent with further progress towards a sustained adjustment in the path of inflation”. The move was unexpected given the political uncertainties stemming from the rise of the anti-European Union parties in the Italian elections, trade wars stoked by the US, and volatility in stock and bond markets. Despite these headwinds, the central bank has a more positive view of growth prospects for the euro zone. The quantitative easing program stands to tentatively end by September this year.

The world’s second largest economy China has different set of challenges stemming from high levels of debt and fiscal deficit. While no major changes in monetary policy is expected in 2018, the government projects moderate growth in the economy and has vowed to cut fiscal deficits, while keeping monetary policy neutral.

Is India’s Central bank behind the curve?

India faced below target inflation, at 1.5%, during a very small window during the year 2017.The Reserve Bank of India faced flak for not reducing rates in line with falling inflation and failing to support growth. Since then, the surge in oil prices and the increase in consumer price index based inflation consecutively over six months have silenced the critics of the RBI. The vindication of RBI/Monetary Policy Committee’s stance in holding on to rates would have provided an opportunity for the central bank to crow about it, in its latest monetary policy statement; however the tone of the statement was measured.

The recent relentless rise in the 10 year benchmark security’s yield to 7.7% (the previous benchmark is close to 8%), has caught most market players by surprise. The yield was barely 6.5% six months back. With the policy rate i.e. repo rate unchanged during this period, the differential between policy rate and benchmark yields has widened to 1.7%. Some would interpret this as a signal that policy rate increases are just round the corner and/or behind the curve. Oil prices have moved by more than 30% in six months adding to inflationary pressures and current account deficit. Fiscal deficit slippage, increase in Minimum Support Price for crops, expected HRA increases by state governments, normalization of monetary policy by advanced economies have all clouded the outlook for inflation in India. The banking frauds that have come to light recently have added further uncertainty to the financial markets. The only saving grace for an import dependent nation, so far has been the Rupee, which is still way below the levels reached during the 2013 taper tantrum days. A stronger currency makes imports less expensive in local currency terms. While central banks in advanced economies have been struggling to increase inflation, India after a brief pause, is back to fighting the inflation monster.

Central bank speak!

The erstwhile Governor of RBI Raghuram Rajan called for greater monetary policy coordination from central banks of major economies, especially in managing spillovers on emerging economies while winding down the long phase of monetary expansion, drawing from the lessons of the 2013 taper tantrum episode under Ben Bernanke when emerging market currencies suddenly plummeted. While we have not witnessed central banks getting into a huddle prior to announcing monetary policy (which of course is the prerogative of the monetary policy committees of the respective regions), their almost uniform action over the last few months towards ending the decade long phase of loose monetary policy, is a sign of return of inflation and growth in an inter connected global economy and the near identical mindset of the central bankers. Perusing the monetary policy statements of the respective monetary policy committees across advanced and emerging markets, reveals almost indistinguishable language; call it “central bank speak” !


Who Do We Blame?

For the past few weeks, India has been fixated on the Nirav Modi-PNB saga—with every passing day exposing some new or unexpected affront of the regulatory system. Investigative authorities have finally begun swooping in on the details, and like every time, there is the hope that at least this time, the guilty would be brought to book. At the heart of this, or, for that matter, any other investigation lies a basic assumption: that the sleuths, judges, juries, authorities—and even suspect—understand and agree on the rules of the game. But imagine a world where no one fully grasps the rules underpinning the system—this, increasingly, is the world of financial markets manned by sophisticated, intelligent algorithms. Now if something goes wrong in such a world, who do we blame?

  1. Learning the Rules of the Game

How do societal rules arise? This question has a long, rich history that has spawned entire fields of study, like Sociology. Within economics too, there is a vibrant tradition of research on this question. While different schools of inquiry differ on the finer details, at the broad level, there is consensus that the rules are a form of context-dependent equilibrium that help us to do well as a community.[1] Think of it this way: if we did not have traffic lights, there would be many more accidents. Traffic lights also work because we drive cars on flat 2-dimensional surfaces— that is the context. If and when we all start driving drones in 3-dimensions, our traffic system will have to evolve. Because social rules are conditional on context, they depend crucially on our learning and state of knowledge. If we did not have the technology for cars, and our only mode of transport was walking, we would not need traffic lights! The world that we inhabit has not changed much in the past few hundred years, yet our social rules have evolved enormously because we have learned more and more about ourselves and the world.

Learning is so innate in us humans that we seldom marvel at the enormous complexity of the process. Researchers, for many decades, have struggled to understand and replicate the intricate cadence that underlies human learning; yet even now, our grasp of the process is shaky. In the last few years, however, we seem to uncovered a few basic principles that underpin practical learning. Whether these are the same principles that animate human learning, no one knows for sure; yet there is increasing evidence that these principles do produce a flavor of learning. In particular, two important ideas lie behind the explosion in algorithmic learning applications in the last few years: deep-learning, and, increasingly, self-learning.

  1. Learning Deeply, On Your Own

  A popular technique to increase one’s skill at chess, in the early stages, is to play against oneself. The idea is that as your own opponent, you will create some small variation, to which you will learn to respond optimally – increasing your feel for the game. It is this intuitive idea that motivates the principle of self-learning. If the space of strategies of each player is sufficiently well-behaved mathematically, it is possible in-principle to learn the game fairly well by playing against oneself.[2] For example, think of a simple “Guess an integer” game, where you and your friend sequentially announce a positive integer between one and one billion; each integer that is announced has to be higher than all previously announced integer; and the winner is the one who can make the last announcement. You don’t really need to play against a friend to understand how best to play this game. Very mechanically, you can assume simple variations for your friend’s play (say, for instance, you can assume that your friend will always guess one higher than you—so when you guess 2, he will guess 3) and exhaust all possibilities for the game. The big problem, however, with such a brute force mechanical approach to self-learning is that it takes an awful lot of time. Even for mathematically well-behaved strategy spaces, the time bottleneck is impractical. For self-learning to work, therefore, we need insights about the data that can cut through the fluff and guide us on how we select our hypothetical opponent’s strategy.

The constellation of techniques that go under the name of deep-learning has been around since the 1960s, but crucial breakthroughs beginning the late-2000s made the approach practical (for example, [3]). The basic idea is to have multiple layers of connected nodes (like human neurons) in a hierarchy, with each layer focused on a certain level of abstraction, and the output of a lower layer serving as input for the subsequent higher layer. So given a game of chess, the lowest layer might recognize just the board and pieces, the next layer might use this input to identify legal moves in the game, the layer after that might begin to recognize “good” moves, and so on. As each further layer in the hierarchy recognizes more and more abstract features, the strength of inter-connections in the lower layers are re-adjusted to better reflect the overall interpretation. Gradually, as the process gorges on more and more data—adding and subtracting inter-connections in various layers on the way—the network begins to “understand” the game. At the big picture level, deep learning is a technique to generate deep insights that requires copious amounts of data.

Now let’s put the two and two together. Self-learning generates a lot of data but needs insights about the data to work successfully. Deep learning generates insights but needs bountiful quantities of data to work well. So what is the obvious conclusion? Self-learning and deep learning seem just made for each other! Well, not really, because the real world has innumerable stochastic variables that are highly unpredictable.[4] Think, for example, of a sudden pothole that may emerge in the path of a self-driving car due to unanticipated rain the previous evening. Nevertheless, in certain special settings, the match between self-learning and deep-learning is indeed strong. These are settings where the rules of engagement are clearly defined, and the majority of players use similar algorithmic techniques. In other words, financial markets!

  1. The Financial Market Black Box

If there is one field outside of computer science where algorithmic techniques are having an outsize impact, it is finance. Financial markets present a relatively manageable, controlled environment, which is nevertheless sufficiently rich to present many interesting challenges. Not surprisingly, outside of Silicon Valley, Wall Street firms are among the biggest recruiters of tech talent.[5]  At the same time, recent techniques in artificial intelligence and algorithms build on the tools of game theory. Game theory, incidentally, has been the bread and butter of serious economists for many decades. Thus a two-way street seems to have opened up between computer science and economics & finance that is gradually changing the contours of both fields.

Going back to our topic at hand, in a market where traders are self-taught, deep-learning networks, if something goes wrong, how do we know who to blame? In order to assign guilt, we need to understand the motives of the guilty. But self-learning/deep-learning networks are closed loop black boxes where we neither understand how the data for learning is generated, nor how the insights about trading decisions are arrived at. Self-learning and deep-learning, in tandem, are almost a self-regulating structure that brooks no outside intervention. It is quite possible that market outcomes which appear deviant to us, might in fact be stepping stones to smart trades. But we have no way to know. Going back to our old example, algorithms might be capable of 3-dimensional drone maneuvers while we are still stuck in our primitive 2-dimensional traffic lights.

The rules that we have defined for our markets reflect our human capacity for learning. If such markets were inhabited by artificially intelligent algorithms (as they increasingly are), how must we create the rules – especially when algorithmic learning is a black box to us?

  1. The Opportunity

Strangely, though the present algorithmic setting is completely novel, this is not the first time humans have grappled with such questions. Ancient traders faced the same question when they landed on an unfamiliar shore, and you and I face the same question when we adopt our first pet. In fact, whenever two distinct cultures of learning come into contact for the first time, we almost always grapple with such questions. Though it appears far removed, the clues to a solution to our ongoing algorithmic conundrum might lie in such encounters. From history, we have learned that exchanges between adherents of distinct styles of learning have proved most successful when there has been no imposition. Instead, what works is a shared system of ethics, and a commonly accepted system of values within which everyone operates. Thus we have concepts like democracy, privacy, morals and universal rights. A nascent movement in the algorithmic community towards these ideas is already underway.[6] Going back to our traffic analogy, what we really care about is no accidents, not the specifics of any particular traffic system.

Most of these ideas are still in their infancy and only vaguely understood at the present time. As we map out this new and unfamiliar algorithmic terrain, a lot of academic and real world fortunes will be made. After all, every one of us wants a Nirav Modi to stand trial, even if he were an algorithm!

[1] Herbert Gintis, “The Bounds of Reason. Game Theory and the Unification of the Behavioral Sciences,” Princeton University Press, 2009.

[2] Noam Brown, Tuomas Sandholm, “Superhuman AI for heads-up no-limit poker: Libratus beats top professionals,” Science, January 26, 2018.

[3] Krizhevsky, A., Sutskever, I., & Hinton, G. E. (2012). Imagenet classification with deep convolutional neural networks. NiPS12, pp. 1097-1105.

[4] Joshua Sokol, “Why Self-Taught Artificial Intelligence Has Trouble With the Real World”, Quanta Magazine, February 21, 2018.

[5] Nanette Byrnes, “As Goldman Embraces Automation, Even the Masters of the Universe Are Threatened,” MIT Technology Review, February 07, 2017.

[6] Kevin Hartnett, “How to Force Our Machines to Play Fair”, Quanta Magazine, November 23, 2016.

Performance of Hedge Funds in India

Hedge fund industry is drawing media attention in India. Recently Avendus Capital has reported as the first domestic hedge fund to have $1 billion asset under management.[1] A hedge fund is an alternative investment fund (AIF), which employs diverse or complex trading strategies and invests and trades in securities having diverse risks or complex products including listed and unlisted derivatives.[2] AIFs are classified into three broad categories. While category I AIF includes Angel, venture capital, social and infrastructure funds, category II includes private equity, real estate, distressed and PIPE funds. Hedge funds are classified as category III AIFs as per SEBI regulations.  There are currently 346 AIFs registered with SEBI. The Indian income tax law is not very supportive of AIFs; particularly for hedge funds. Income accruing to category I and category II AIFs, registered with SEBI, is taxed at the investor and not at the fund level.  However, category III AIFs are not accorded pass through status.  In other words, any income or gain of category III AIFs is taxed at the fund level. This is contrary to the taxation on mutual funds, where tax is charged at investors’ level. This provision leads to increase in the operating costs of hedge funds. In fact, hedge funds are not clearly defined in the income tax laws in India. If any AIF, irrespective of category, suffers a loss, such loss has to be absorbed at the fund level and cannot be passed on to the investors. This is quite a punitive provision and calls for review. Like income or gains, losses should be given pass through status.

High net worth individuals and institutional investors are allowed to invest in risky AIFs. Each scheme of AIF should have a minimum corpus of Rs. 200 million and the minimum investment amount by any investor is pegged at Rs.10 million.   Private equity (PE) and venture capital (VC) are the most popular AIF followed by real estate funds; hedge funds come as distant fourth.[3] Alternative Assets under management in India is very small compared to USA ($2.8 trillion), UK ($495 billion and China ($265 billion). However, the Indian market has huge growth potential- it grew by 55% in 2017.

There are several important differences between hedge funds and PE (and similarly VC) funds. Managers of hedge funds have flexibility to buy or sell a wide range of assets. PEs can hold long only portfolios. Hedge funds can take leverage positions, which PE cannot. Hedge funds normally seek to make profits from market inefficiencies (mispricing), rather than purely relying on economic growth to drive returns. While hedge funds have low holding period (sometimes even intraday), PEs have much longer holding period (5-7 years). Managers of hedge funds are pure financial investors, whereas PE investment comes with some degree of operational control on the investee company. Since investment horizon for hedge funds is relatively short, performance of such funds is estimated on monthly/quarterly basis. PE funds see returns only after 5-7 years.  Private equity investors simply cannot withdraw capital before the end of a fund’s life.

Investment Strategies

The returns of a hedge fund depend on the manager’s skill, as well as on market conditions. The source of returns (skill vs. market) varies significantly depending on the investment strategies adopted by hedge funds. Broadly, investment strategies of hedge funds include directional and market neutral strategies. Directional investment strategies aim to capture market trend (going long during uptrend and short during downtrend) and market neutral strategies seek to generate absolute returns independent of market conditions.  Successful hedge fund managers generate alternative beta and skill alpha. While the traditional sources of beta are the stock market spreads (for equity assets), alternative sources of beta are liquidity, volatility, beta of commodity markets etc. Similarly, structural alpha is driven by regulatory advantage that hedge funds enjoy and the latitude offered by having no benchmark. Alpha linked to the manager’s skill (ability to pick right assets at the right time) is known as skill alpha.

Common investment strategies followed by hedge funds are listed below:

Directional Strategy: This strategy seeks to take advantage of major market trends rather than trends observed in individual stocks. Managed futures and global macro strategies are two examples of directional investment strategies. Managed futures refers to taking a bet on the forward curves of futures contract. If a near-month futures contract is over-priced compared to a far-month futures contract on the same underlying asset, one may short the near-month contract and go long the far month contract. Global macro strategies apply macroeconomic views to global markets to decide entry/exit strategies. Instead of analysing macroeconomic events affecting companies or assets, they view the world from a top-down perspective (e.g., a manager taking a pessimistic view on UK currency, GBP vis-à-vis US dollar weeks before the referendum on Brexit and shorting GBP).

Long Bias and Short Bias: A fund with long bias strategy takes mostly long positions on the market. On the other hand a fund with Short bias strategy takes mostly short positions.  Long (short) bias also includes net long (short) portfolios. Typically long (short) bias indicates bullish (bearish) view about the underlying asset.

Arbitrage Relative Value: This strategy involves simultaneous buying and selling of two closely related securities whose prices have diverged “relative” to each other. Typically these securities are very highly correlated. Both the securities could be from one asset class (e.g. equity, debt, futures, options etc.) or multiple asset classes. This strategy has potential to generate returns even when the market is moving sideways. One popular example of relative value arbitrage strategy is pairs trading.

Fundamental: In this strategy a fund manager takes fundamental factors, which affect the security returns, into consideration in making investment decisions.

Bottom Up: A strategy in which fund starts with analysis of specific securities and later on move on to industry and other macro analysis.

Top Down/Macro: This is exact opposite of Bottom Up approach. In this strategy the fund manager starts off with macro analysis and then slowly moves onto analysis of specific securities.

Opportunistic: In this strategy a fund manager opportunistically employs one or more strategies which he believes can generate the best return for that asset class    

Systemic Quant: When a fund manager uses algorithms to evaluate the market, the fund is said to follow Systemic Quant strategy.  Managers typically use price, volume, volatility and liquidity information to develop quant strategies.   

Performance

The five-year (2013-2017) average performance of hedge funds in India was better than performance in many other countries (table 1). Indian hedge funds reported an average annualised return of 18%. The average monthly returns of hedge fund in India were even higher in comparison to the performance of ETFs. ETFs generated lower return with greater risk, thereby reporting a lower sharp ratio. It is important to note here that fund performance should not be judged by returns alone- one should rather look at risk-adjusted returns. Indian hedge funds have generated better returns at greater risk (standard deviation of returns) with higher drawdowns. One may argue that hedge funds in India have still outperformed (on risk-adjusted basis) Europe and USA. Within country, hedge fund has higher risk-adjusted return (mean return divided by standard deviation) than ETFs.  Since hedge funds normally generate absolute returns, there is no need to compare their performance with any benchmark.


Table 1: Average Performance of Hedge Fund Industry

Asset Type Country Mean Monthly Return (%) Standard Deviation of Monthly Returns (%) Worst Month Performance (%) Best Month Performance (%) Average Performance in Positive Months (%) Average Performance in Negative Months (%) Percentage of Months with Positive Return Max Draw Down (%)
Hedge Funds Asia/Asia-Pacific 1.00 2.51 -4.75 8.19 2.06 -1.66 71.67 -9.11
Hedge Funds Europe 0.59 2.28 -5.16 7.98 1.95 -1.30 58.33 -12.44
Hedge Funds Global 0.51 1.88 -4.21 7.69 1.44 -1.36 66.67 -4.61
Hedge Funds India 1.53 3.00 -8.24 9.74 2.71 -2.37 76.67 -13.39
Hedge Funds USA 0.85 2.13 -3.72 8.41 1.88 -1.22 66.67 -4.18
ETFs SENSEX 1.12 3.74 -7.45 10.51 3.48 -2.43 60.00 -19.91
ETFs NIFTY 1.15 4.18 -7.76 11.37 4.15 -2.52 55.00 -20.70

Source: Thompson Reuters Lipper. Authors’ calculations


Different investment strategies provide mixed results. While the systematic quant strategy reported highest average returns (table 2), it comes at a greater risk. The directional strategies, on the other hand, have minimum downside risk and lower standard deviation.  Surprisingly, short bias has performed better than long bias strategy with positive returns in seventy five per cent of months.

Table 2:  Strategy-wise Performance

Country Mean Monthly Return (%) Standard Deviation of Monthly Returns (%) Worst Month Performance (%) Best Month Performance (%) Average Performance in Positive Months (%) Average Performance in Negative Months (%) Percentage of Months with Positive Return Max Draw Down (%)
Arbitage Relative Value 1.74 3.40 -11.26 9.39 3.00 -2.40 76.67 -17.40
Bottom Up 1.70 3.46 -8.65 12.02 3.16 -2.68 75.00 -13.42
Directional 1.31 2.87 -6.23 10.46 2.58 -2.17 73.33 -10.37
Fundamental 1.57 3.58 -8.68 13.30 3.37 -2.30 68.33 -13.31
Long Bias 1.65 3.71 -9.01 12.25 3.38 -2.75 71.67 -14.22
Opportunistic 1.33 4.08 -8.18 12.84 3.41 -3.15 68.33 -18.57
Short Bias 1.85 3.88 -10.55 13.09 3.48 -3.02 75.00 -15.20
Systematic Quant 1.91 4.02 -10.51 13.04 3.64 -3.26 75.00 -15.04
Top Down Macro 1.11 3.38 -8.85 11.87 2.97 -2.10 63.33 -12.28

Source: Thompson Reuters Lipper. Authors’ calculations


There has been consistent decline in the number of strategies adopted by hedge fund managers in India over the past five years (table 3). One can observe maximum decline in relative value arbitrage strategies, followed by long bias strategies. It does not necessarily mean that Indian financial markets have been bearish during the period 2013-17. One has to look at the asset under management under each strategy to draw any conclusions about investors’ preferred strategies. Investment strategies based on fundamental information has been consistent throughout the observed period.


Table 3: Investment Strategies during the year

Strategy 2013 2014 2015 2016 2017
Arbitrage Relative Value 124 73 56 48 48
Bottom Up 117 101 100 93 84
Directional 35 24 24 21 12
Fundamental 111 113 120 117 108
Long Bias 141 113 112 105 96
Opportunistic 24 29 36 36 36
Short Bias 25 12 12 12 12
Systematic Quant 13 12 12 12 12
Top Down Macro 26 24 24 21 12
Grand Total 618 501 496 465 420

Source: Thompson Reuters Lipper. Authors’ calculations. Each strategy is assumed to liquidate at the end of the month.


The asset under management has increased over the past five years (table 4) with maximum investment in long bias strategies in 2017. There has been a decline in investments under relative value strategies. Investment exposure to fundamental strategies has doubled over the past five years. When one compares fund performance with AUM, one may note that long bias did continue to attract large funds despite not so noteworthy performance.  It implies that AUMs are not necessarily based on historical performance.

Table 4: Asset Under Management (AUM)

Strategy 2013 2015 2017
Arbitrage Relative Value 7778.3 6498.2 6915.6
Bottom Up 1569.8 5075.7 8692.8
Directional 50.3 148.8 NA
Fundamental 4156.7 8014.9 8692.8
Long Bias 6103.6 11904.9 15351.3
Opportunistic 2587.0 3142.4 542.5
Short Bias NA NA NA
Systematic Quant NA NA NA
Top Down Macro 2545.8 3030.9 NA
Total 24791.3 37815.8 40195.1


Source: Thompson Reuters Lipper. Authors’ calculations (figs in INR million)

Hedge funds, as an alternative asset class, has potential to grow. However, activities of hedge funds need to be carefully monitored without stifling its growth potential. Hedge funds do indulge in proprietary trading at high frequency and this is an area presently under close scrutiny of market regulators.  Regulators believe that high frequency traders abuse their advantage of ‘speed trade’ and adversely affect market quality. However, empirical finds about the role of high frequency traders is mixed.


*************


[1] Times of India, 25 January 2018

[2] SEBI (Alternative Investment Funds) Regulations 2012

[3] As of December 2016 Asset under management (AUM) of PE and VC funds was $23.6bn, followed by real estate funds $10.2 bn; and hedge funds comes fourth with AUM of $1.4 bn. (Source: Preqin Insight Report, November 2017)

Bank Stocks: Irrational Exuberance or Government Assurance as the Ultimate Risk Manager?

In recent times the stock market has been performing rather spectacularly all over the world – so much so that the recently released World Economic Outlook of the IMF (released on January 22 2018) flagged “rich asset valuations” and the possibility of a “financial market correction” as a risk that could dampen growth and confidence.[1] India is no exception to this global trend. Each day we get pleasantly surprised to find BSE Sensex / NSE Nifty crossing another stratospheric mark.  While the aggregate stock market story could perhaps be explained in terms of herd behaviour of the investors chasing of yield in consonance with a global trend, the purpose of this commentary is much narrower. This commentary looks into the recent trends in bank stocks and argues that the performance of bank stocks is out of sync with the performance of the banking sector.

Performance of Bank Stocks

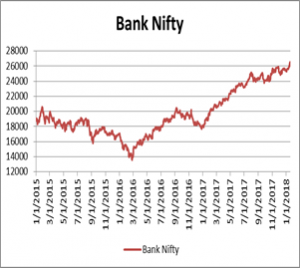
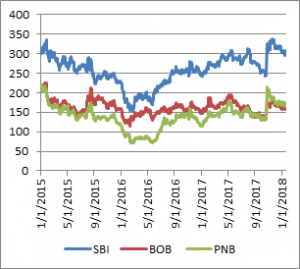
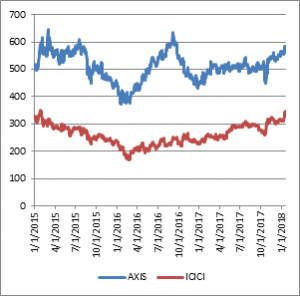
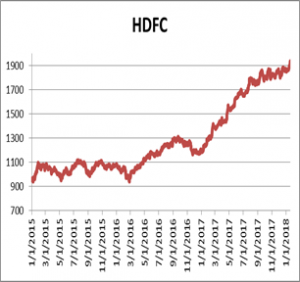
Chart 1 depicts the inter-temporal behaviour of banks stocks. Couple of stylized facts emerges from eyeballing the charts. First, Bank Nifty, the aggregate index representing bank stocks, is on a journey in the north-east direction nearly for the last one year. Second, in our selected sample of three public sector banks (viz., State Bank of India (SBI), Bank of Baroda (BOB) and Punjab National Bank (PNB)) stock prices of these three banks have also shown an increasing trend. Third, in our selected sample of three private sector banks, viz., ICICI Bank, Axis Bank and HDFC Bank, stock prices of these banks have also exhibited similar tendency; of course the extent of upward movement is shaper in case of HDFC banks.

But what is wrong with these increasing trends in the stock prices? Stock prices routinely go up or come down and it might be foolhardy to attempt to explain their behaviour. The only uncomfortable piece of information in these cases is that these upward trends in bank stock prices have been accompanied with a deteriorating performance of the commercial banks – particularly that of the public sector banks.

Chart 1: Performance of Bank Stocks
   
   
Source: Bloomberg.


Performance of the commercial banks

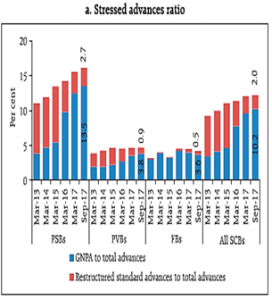
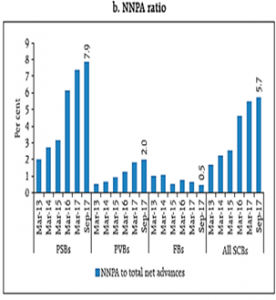
What has been the risk-return profile of commercial banks? Towards probing this question, I looked into RBI’s recent Financial Stability Report (FSR), December 2017 (released on December 22, 2017). The FSR categorically noted, “The overall risks to the banking sector remained elevated due to asset quality concerns”. Besides, it finds that the gross non-performing advances (GNPA) ratio and the stressed advances ratio of the banking sector increased between March 2017 and September 2017. Finally, the stress tests conducted by the RBI tended to suggest that in the baseline scenario, gross NPAs of the banking sector “may rise from 10.2 per cent of gross advances in September 2017 to 10.8 percent in March 2018 and further to 11.1 per cent by September 2018” (Chart 2). These warnings are indeed a case for concern particularly for the public sector banks.

Chart 2: Asset Quality of Indian Banks


Source: RBI, Financial Stability Report, December 2017.

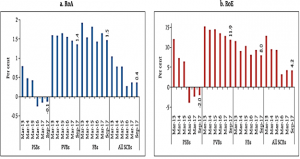
What has been the performance of the banking sector? Chart 3 plots two profitability indicators, viz., return on assets (RoA) and return on equity (RoE). Two important facts emerge from this chart. First, at the aggregate level, return on assets remained unaltered at 0.4 per cent between March 2017 and September 2017 while their return on equity declined from 4.3 per cent to 4.2 per cent during the same period. Second, for the public sector banks both the returns on asset and equity stood at a negative 0.1 per cent and 2.0 per cent, respectively as on September 2017.

Thus, as far as public sector banks are concerned, recent data reveals that their performance has been unsatisfactory and their risk profile has deteriorated in recent times.

Chart 2: Profitability of the banking sector


Source: RBI, Financial Stability Report, December 2017

What is going to be the future risk return profile?   We have already noted that the RBI’s Financial Stability Report has indicated that even under the baseline scenario, the gross NPA of all commercial banks are likely to deteriorate. But, under the severe stress scenario, seven banks have common equity tier (CET) 1 capital to risk-weighted assets ratio below the minimum regulatory required level of 5.5 per cent by September 2018. In sum, not only the present but the future of the public sector banks does not seem to be rosy. More specifically, the stressed condition of the commercial banks and their impressive performance in the stock market do not seem to add up.

Towards some conjectures

What would be possible explanations of this riddle? One obvious explanation is the presence of some irrational exuberance in bank stocks. But there are commentators who think otherwise. In fact, it has been pointed out that in explaining this impressive performance of bank stocks factors such as, shift in monetary policy or advances in technology, could have played a role.[2] Another explanation could be that the infusion of capital into the banks have assured the market players about the presence of the government almighty to rescue the public sector banks in the eventuality of any liquidity / bankruptcy problem or shortage of capital. Latest hue and cry about the Financial Resolution and Deposit Insurance Bill 2017 could have also convinced the market players about the infallibility of the banking system in India. The Union government announced the infusion of Rs. 88,000 crore of capital in ailing public sector banks on January 25, 2018. While it was a good to see that such capital infusion has been linked with a set of performance metrics, hope it does not encourage the syndrome of “privatization of profits and socialization of losses” in banking. Professor David Moss of Harvard Business School looked at government as the ultimate risk manager.[3] Metaphorically speaking, hope such an implicit role of the government as the ultimate risk manager would not fuel further the extent of irrational exuberance in bank stocks.


********


[1] http://www.imf.org/en/Publications/WEO/Issues/2018/01/11/world-economic-outlook-update-january-2018

[2] See for example, “4 reasons to ‘keep buying bank stocks”, Interview of Equity research analyst, Richard X. Bove to CNBC, available at https://www.cnbc.com/2018/01/23/banks-reach-a-state-of-nirvana-thanks-to-gop-bove-commentary.html

[3] David Moss (2002): When All Else Fails: Government as the Ultimate Risk Manager, Cambridge, Massachusetts: Harvard University Press.

Banks ignore early warning signs at their peril

The non-performing loan woes of public sector banks have been discussed threadbare for a while now. Private sector banks have not exactly covered themselves with glory on this front. The inspections of the Reserve Bank of India have revealed a significant divergence between their declared NPA’s and that determined to be non performing by RBI. The NPA figures in the banking industry which seems constantly on the upswing, have now crossed USD 100 billion, while total stressed loans could be twice this figure.

Do corporate loans turn bad overnight? The Relationship Management team is supposed to have an ear to the ground, being closest to the market. Many banks have independent credit monitoring teams which also look for signs of potential trouble. Large accounts have direct visibility at the CEO and board level. Yet we see the relentless onslaught of non-performing loans emasculating Indian banking.

Early warning signs

Banks have a treasure trove of data in their core banking and other systems on the conduct of accounts. One of the first signs of trouble is stressed cash flows of the corporate borrower. This usually manifests in the form of ad hoc requests for temporary overdrafts. A one off instance is understandable. But frequent over drawing in the account is a red flag.

The borrower could then request for additional working capital facilities to avoid the day to day hassle of over drawings in the account. While such a request could be genuine at times, more often than not, it is a warning sign to the bank management.

As things further deteriorate, there is delay though not necessarily outright default in meeting loan interest and principal installment obligations. Letters of credit favouring suppliers of raw material could start devolving. Cheques issued by the borrower return unpaid. Quarterly results start reflecting weak margins and stressed cash flows.

As the scenario worsens, the corporate borrower may stop routing its sales receivables through the bank for fear of the cash flows being seized for loan obligations. Decline in credit turnover in the account is an early warning sign which banks must look out for.

Macro-economic factors

While operational issues are clearly discernible after the event, analyzing and anticipating changes in the industry scenario requires different skill sets. Dumping of steel from low cost producing countries, cancellation of coal blocks a critical raw material source due to judicial intervention, power purchase agreements not being signed or rescinded are some of the factors behind the larger NPA’s. Banks with huge exposure need to build in house industry expertise in segments where they plan to take huge exposure and for subsequent monitoring, rather than relying on consultants who do not have any bottom line, for appraising projects.

Institutional mechanism

Banks in India, US and other geographies have put in place systems to identify corporate borrowers who exhibit incipient signs of stress. The Reserve Bank of India lists 40 early warning signs which would qualify for a borrower being placed under a red flag status. Banks would need to report such accounts to the Central Repository of Information on Large Credits (CRILC) set up by RBI. The status of such accounts needs to be reported to the CEO every month. Such accounts thenceforth receive senior management attention in the form of close reviews.

The risk rating of such accounts usually gets downgraded. Efforts are made to reduce exposure. An exit strategy is put in place. Once the account technically becomes a NPA, it is a common practice to transfer it from the sales/relationship management team to a specialized recovery team.

The OCC in the US

The Office of the Comptroller of Currency, which supervises national banks in the US, calls for early identification of credit weaknesses and adverse credit trends, as a precursor to successful loan workouts/recovery. The OCC seeks a credit culture at banks, and rating systems that encourages lenders and managers to identify problem loans in a timely manner.

Technology can play a role

While large corporate accounts need a more nuanced and subjective approach in flagging off stressed conditions, software can help in identifying small and medium accounts which exhibit early warning signs. The software can read data from a bank’s systems as well as from external sources to flag off such accounts.

The system fails

Despite having a wealth of data, systems and institutionalized mechanisms, the non-performing loan levels in India are an indication that corporate bankers rarely pay heed to early warning signs in a borrower’s account. Several reasons can be attributed to this failure.

Fear of pulling the plug: the account team may be wary of precipitating a crisis by calling back the loan prematurely. Taken to the extreme, this might tantamount to “extend and pretend” that all is fine, by kicking the can down the road as far as possible. Conversely, the client facing team could be apprehensive of losing business in what could otherwise be a genuine short term issue.

Corporate accounts are booked in a bank as part of a fairly drawn out wooing process, spear headed by the sales team, often with senior management in tow. It is not easy to admit failure and recall the loan when it appears to be heading for trouble. It is common to see the sales team pushing the credit approving authorities for additional facilities, citing “temporary” cash flow mismatches of the borrower instead of calling back the loan and instituting recovery process. The client facing team which generates revenue for the bank, having an upper hand over the “old men” in credit management, is not uncommon in commercial banking. The banking supervisor OCC in the US too, talks of commercial lenders being reluctant to transfer a credit to the recovery team even after a problem loan has been identified and deems senior management/board support essential for making sure than lenders surface loan problems at the earliest possible stage.

While working capital facilities may potentially be recoverable by way of the borrower making alternative arrangements, long term project finance is not readily amenable to such refinancing. Having lent to the project, the fate of the bank’s loan is often irrevocably linked to the success or failure of the project.


Willful defaults

A gold plated project is doomed to fail, from the word go. Once the promoters have taken out their contribution manifold, the project/company becomes unviable, and is now the bank’s problem to solve.

Such defaulters have perfected time tested methods to take out funds from bank funded legal entities by diverting cash flows to related parties, failing to repatriate export proceeds with the foreign “buyer” being a shell company of the promoter, deliberately invoking bank guarantees issued for non-existent projects awarded by the promoter’s own related company, fraudulent/accommodation inland bill transactions under letters of credit issued to associate companies without an underlying trade transaction etc. In most cases, shell companies/related parties of the promoter are the commonly used vehicles to divert funds from the bank funded borrower to the coffers of the promoter. Early warning signs flash all over such accounts, but for reasons best known to them, corporate bankers ignore them until “the bird has flown”!

Indian banking has seen several such egregious cases with rarely any such corporate defaulter paying the price, despite the seemingly strong resolve of the current administration. This must be perplexing as well as vexing to the tax payer, whose funds are ultimately used to bail out ailing public sector banks through recapitalization. Perhaps, the Indian taxpayer can take some small comfort that it’s a global phenomenon, with no criminal prosecution of either CEO’s or errant bankers in the United States, in the aftermath of the 2008 crisis which almost brought down the financial system, requiring a mammoth government led bailout of Wall Street banks.


The Magic of Blockchain

In October 2008, almost out of nowhere, a mysterious figure named Satoshi Nakamoto posted a short paper on cryptographic mailing lists describing an architecture that could – the paper claimed – replace existing centrally controlled currencies. Dismissed initially by the mainstream as a nerdish fantasy, interest in crypto currencies exploded abruptly last year. All of a sudden, it seemed that the financial press and investing public could not get enough of bitcoins and its cousins, and the daily gyrations of crypto markets quickly became the subject of animated discussions on coffee tables all around the world!

Many opine that the current crypto currency craze is a bubble, and that it may very well be. However, there is a growing realization – among researchers and practitioners alike – that the fundamental scaffolding on which bitcoins operate is indeed radical. This scaffolding is the Blockchain.

  1. The Idea of Blockchain

Try teaching your grandma about the internet, and after the first few sessions there is the inevitable question – is WhatsApp the Internet – or, is Facebook the Internet – or otherwise, is Gmail the Internet? As you may have patiently explained, indeed WhatsApp, Facebook and Gmail are the Internet, but the Internet is much, much more. The relation between crypto currencies and the blockchain is similar. Bitcoins are an application built on top of blockchain. As interesting as bitcoins potentially are, the truly fundamental innovation is at the level of the blockchain.

At the most basic level, blockchains provide practical solutions to two inter-related problems in game theory and cryptography – creating common-knowledge and obtaining consensus – in a large population of independent entities. These were open questions in the fields for a long time. Complete technical details of the blockchain solution to these problems would require a lot of computer science jargon; however, the essence of the innovation can be captured through simplified analogies.

  1. Blockchain and Consensus

To understand how a blockchain obtains consensus, let us turn to an analogy with the most popular consensus creating mechanism we humans have created – voting.

Suppose we have an honest distributed system. Distributed: means that each node is a stand-alone entity. Honest: means that at least a majority of the nodes in the system are non-corrupt (“nodes in a system” is really an abstract representation; a concrete realization could be anything, for instance a scattered population of voters). How can one poll such a distributed system so that one gets the honest majority’s opinion? One way could be to undertake “conventional” voting — one node, one vote. But simple voting is “cheap” and easy to rig in a distributed system. Suppose corrupt nodes send two votes instead of one, it would be very hard to detect, and the outcome is compromised. The first essential innovation of blockchain is to propose a robust alternative voting mechanism building on a technique called “proof-of-work”. What does that mean? Suppose there are multiple candidates in an election. Instead of simply asking the nodes to choose between candidates, a blockchain requires each node to solve a special kind of puzzle, and then attach their solution to the puzzle along with the vote. The class of puzzles that is used is another novelty and they involve specialized cryptographic techniques, but the idea can be explained through another analogy.

Suppose every node of the population is equipped with an infinite number of sealed boxes – each such box containing the 52 playing cards, with the Queen of Hearts on top. These boxes are special: they are very heavy; to shake a box (in other words, to shuffle one pack of cards), it takes a single node 20 seconds. At the end of 20 seconds, each node makes a mark indicating its vote on the box – that’s the vote – and submits as many boxes as it wants to. So technically, each node can submit more than one vote. Once all the boxes have been submitted, they are opened, and the number on the card at the top of the deck in each box is noted, along with the vote mark on the box. Now comes the catch – not all votes are taken as valid. Only if the card on top of a box is a King of Hearts, the vote is recorded; otherwise the vote is discarded. Importantly, no node knows which card has to be on top for the vote to be recorded – that’s a secret – and it is different from the card that is initially on the top of each deck (for example, we had a Queen of Heart on top of each deck initially).

The above mechanism guarantees that the “probability of recording an honest vote” is greater than “probability of recording a corrupt vote”, as long as the majority is honest. The guarantee comes from the randomization of the shuffle, and because the boxes are “heavy”, and the card needed on top for the vote to be recorded is secret – and different from the card on top of the decks initially. Corrupt nodes can submit multiple boxes with corrupt votes, but unless the boxes have been shuffled, it is no good. And since it takes 20 seconds to shuffle, a corrupt node will have shuffled only one box when the boxes are collected. As one has multiple independent rounds of voting, since probabilities multiply, the difference in probabilities keep piling up. After sufficient number of rounds, we are almost guaranteed to record the honest opinion. That is the beauty of the blockchain: it is a computational solution to the problem of corrupt nodes. But that’s not all!

  1. Blockchain and Common Knowledge

The examples above assumed that we have an honest aggregator of the votes. However, there is no reason to believe that election commissions will always stay impartial and honest! What if the arbiter of votes is itself corrupted? The blockhain handles this problem by doing away with the centralized vote aggregator completely, relying instead on a “public ledger”. A public ledger, in its most simple form, is like a giant scoreboard of live updating vote-counts that all entities can observe. The technical problem that a giant scoreboard addresses is one of common knowledge.

The apocryphal tale of the unfaithful wives is a good fable to explain the purpose of a public ledger (it might very well have been the tale of unfaithful husbands, just interchange the wife and husband in the story). The story goes something like this. In a quaint old village live a 100 married couples. Every evening the men of the village meet around a fire and praise the virtue of their faithful wives. However, if a husband suspects that his wife has been unfaithful, he invokes a curse at the fire that immediately turns his wife into a stone statue. If a wife is ever unfaithful, through some magical telepathic device, everyone in the village gets to know about the affair, except for the husband. Now suppose all women in the village are unfaithful. What happens? Nothing – because the husbands have no way of knowing. Due to the magical device, each husband thinks that the other wives are unfaithful, but he never gets to know about his own wife. For many years this village is thus a picture of tranquility with the husbands praising their wives every evening, till one day, a holy man comes and publicly declares that “a wife in this village has been unfaithful”. For 99 days thereafter, all stays the same, with the husbands praising their virtuous wives, but on the 100th day, all the 100 ladies in the village become stone statues!

It is easy to see the reason for this calamity. From the magic device each husband knows that 99 other wives are unfaithful, so for 99 days a husband can hold on to the belief that his own wife is above suspicion. But if every husband in the village holds on to this belief for the 99 days, there are no curses invoked at the fire for 99 evenings, and thus everyone knows that everyone holds this beliefs. On the 100th day, this belief system has to unravel because at least one wife has been unfaithful. Thus you have the 100 stone statues on day 100. Game theorists use this fable to illustrate various finer points about knowledge, reasoning and belief. In reference to the blockchain, the main message is that without common knowledge the truth of a situation can stay distorted for indefinite amounts of time. Till the holy man’s arrival, the husbands praise the wives at the fire even though the wives have been unfaithful. The holy man’s declaration is like an announcement on a public billboard that everyone can see. The public ledger in the blockchain plays a similar role.

  1. The Opportunity

 The land of the blockchain today is like the terrain of the internet in the early 1990s. A bitcoin is like the Alta vista search engine or AOL chat tool: interesting early applications of the internet, but hardly ones that scratched the full potential of the World Wide Web. The disruptive potential of the blockchain mechanism is still unfolding and early entrepreneurs with the vision have the chance to make a real difference.

This opportunity is especially important for India. Indian businesses have not had a major hit since the IT outsourcing revolution, which has largely run its course. Further, the new waves of startup fueled tech-based businesses in India are largely knockoffs of Western or Chinese ideas, adapted to local Indian conditions. This is unlikely to lead to revolutionary global innovative companies that can disrupt businesses the way the Googles or Amazons have done.  The blockchain revolution provides India another chance to take a place at the high-table of global innovation. If India can create an ecosystem that is at the forefront of research and innovation in the blockchain, the next Google can very well come from the country.


GST and Corporate Finance- A note

The Goods and Services Tax  (GST) is the most important indirect tax reform in India. It was debated enough over the past sixteen years and yet when it was launched in India, a common criticism was that the present government hurried its implementation. Experts complained that the IT infrastructure was not robust to handle such large volume of data that would get generated in the GST portal. Better beta testing would have avoided initial technical glitches.  Perhaps due to pressure from business community and opposition (some claim that impending election in Gujarat did the trick), the government had to recently announce some major changes in the GST rates and also simplified compliance requirements. The major changes include reduction of GST rate for more than 178 items, composite scheme limit increased to INR 15 million, exemption from GST registration for all service providers with turnover up to INR 2 million, pruned by nearly three-fourths the number of items under highest GST rate, halved the composition tax of 1% on turnover of taxable goods, and provided relief to the e-commerce sellers if total turnover is less than INR 2 million.  However, marketplace operators and sellers are still not happy with the recent changes in GST rules.  One may note the recent announcement by the GST Council would cost the exchequer.

France was the first country to introduce VAT (somewhat equivalent to GST) in 1954 and now more than 160 countries implemented GST or its equivalent. Brazil has higher peak GST rate (35%) than India (28%). There is a difference between GST and VAT as the former is a destination-based tax.  USA does not have single GST as taxation decision lies mostly with the states.  Closer home in Singapore, GST was implemented in 1994 with a single rate of 3%. What is interesting is the Singapore government assured the business community at time of GST implementation that the rate would not be raised for first five years.  In practice, GST rate was increased to 4% in 2003- after a gap of 9 years. Later the rate further rose to 7% in 2007. Such a clear and categorical signal did help business community migrate to GST regime without much difficulty.  Another smart decision of the Singapore government was lowering of direct tax to reduce the burden of GST on business and common citizen.  It showed great sincerity on the part of the government to care for its citizens. China also implemented GST in 1994. Initially it had many GST rates. And realising the administrative difficulty in maintaining several rates, China has now (July 2017) moved into three-rate band – 17%, 11% and 6%.

It is said that India had followed the Canada model of GST- the dual tax (state GST and central GST).  Let us not forget that introduction of GST in Canada in 1991 was very controversial. The manufacturers had complained that GST had rendered them less competitive in international trade.  Canada also did not change the GST rate for initial one and half decade.  Unlike Singapore, Canada had lowered GST rate over the years- from 7% (1991) to 6% (2006) and further to 5% (2008).  Canada has recently raised the GST rates though and it now ranges between 13% and 15%.


Lessons from Corporate Finance

While framing GST rates, the focus was on ‘revenue neutrality’- rates that would not decrease pre-GST revenue of central and state governments.  Hence, we end up with four GST rates (excluding the zero rate). It may be mentioned that it is possible to have a single revenue neutral rate (RNR). However, the central government has chosen, and rightly so, to have more than one rate in order not to tax at a higher rate a basket of goods and services which were attracting lower tax in earlier regime. Even after such careful consideration by the GST Council, there was large number of items under the peak rate resulting in protest by traders, and political opponents. The idea of introducing GST with the ‘principle of equivalence’ was perhaps a mistake. One could use lessons from corporate finance to set the initial GST rates.

Corporate finance literature mentions that when a company wants to raise money through public offer for the first time, it ‘underprices’ its shares. It is a worldwide phenomenon.  A recent example would be IPO (initial public offer) of LinkedIn, which is stated to be underpriced by 100%.  Why do companies underprice IPO? One explanation is ‘information asymmetry’.  When an unlisted company comes to the market for the first time, no analyst would be tracking that stock and hence investors would demand ‘premium’ for the fear of unknown.  Underpricing is generally lower when information about the issuer is more freely available.  The GST Council could have drawn from the IPO underpricing literature and introduced lower GST rates initially taking a hit in the indirect tax revenue for the first few years. Actually government had to do it anyway- an estimate shows that recent pruning the list of items under 28% slab would cost the government around INR 200 billion.  There were lots of uncertainty and apprehensions surrounding the GST rates and the possible adverse impact that one-nation-one-tax policy would have on the business sentiment. What was required was to ‘assuage’ the initial ‘fear of unknown’ through lower GST rates and simple compliance (reporting) requirements.  That would have ‘earned’ the government confidence of business and thus initial technical glitches would be ignored as something common with any large implementation. Anti-profiteering provisions and market competition would ensure that business community pass on benefits of lower tax to end consumers.

The recent changes in GST rates within four months of GST launch further show tentativeness of the Council. Rates were reduced for 178 items from 28% to 18% and for restaurants (with exceptions) from 18% to 5%. One may recall that dining in a restaurant would attract 15% service tax in earlier regime. It was initially revised upwards to 18% in GST and now within a few months lowered significantly to 5%. Let us turn to corporate finance again. Lintner[1], while describing how managers determine dividend payout, observed that managers tend not to make dividend decisions that might have to be reversed in near future.  Markets react more negatively to dividend reversal than dividend increase. Hence, knowledge of corporate dividend literature would have helped the GST Council in setting initial GST rates in a way that change in such a short time could be avoided.  Examples of Canada and Singapore showed that a stable GST rates for a longer duration send a signal of confidence on the part of the government. This would help the business community concentrate more on implementation and compliance issues rather than wasting time in lobbying for reduction of GST rates. The GST Council also, in that case, could have spent more time and energy in fixing the IT glitches and handles issues relating to frequency of return filings. A longer-term GST rates could only be fixed if the rates were lower with fewer slabs in the initial five years, at least. The central and state exchequer would have definitely lost some revenue in such a situation. But smooth transition to the huge transformation is more important than loss of revenue in initial years. There are ways to make good any possible loss. One possibility is that lower GST rates would create favourable buoyancy in the business and hence would offset any shortfall in indirect tax revenue.

Lowering of tax rates has other implications. Corporate finance literature again shows that firms did not use savings due to tax incentives for growth. Rather such savings were passed on to shareholders by way of higher dividend and at times were usurped by managers as costly perquisites. The objective of providing any kind of tax incentive is to help business in early years to grow and face competition. However, literature on ‘agency theory’ amply shows that tax benefits were squandered away. Therefore, benefits of recent downward revision in GST rates for several commodities may not translate to lower invoice value. The administrative machinery has to be very watchful to ensure that ultimate consumers benefit.

Major relaxation is now offered with regard to filing of various GST returns. This would provide comfort to small businesses and release pressure on the GST portal for the time being. Developer of the GST portal will get time to fix the bugs that still remain in the system.  It is hoped that GST Council will stay put with the rates for some years and observe the impact of the new law on business. One may justify the decision of lowering GST rates and relaxing compliance as something that quickly address the concerns of the business. This would portray the lawmakers as more proactive.  However, the danger is that it may also send signal that such pressure tactics would work in future as well.  International investors do not generally like frequent policy changes and hence favour a destination that has stable economic and fiscal policies. India has been making right noises on economic front for the past few years and the global community is watching us with delight.  Let us embolden their faith with steady GST policy.

[1] Lintner, J. (1956) Distribution of Incomes of Corporations among Dividends, Retained Earnings and Taxes, American Economic Review, 2, pp 97-113

A note on External Commercial Borrowings in India: Rapid growth amidst some vulnerabilities

  1. Introduction

External debt flows to developing and developed countries have increased rapidly over the last few years. A study prepared by the Institute of International Finance (IIF) and reported by Reuters indicate that global debt has risen to record US$ 226 trillion, which is more than three times global economic output. The developing world is estimated to have external debt amounting to US$ 59 trillion. This increase in debt to developing countries is largely driven by China, which presently has a debt burden of US$ 35 trillion[1].

India is also receiving increased debt flows. Since 2007-08, India’s external debt stock increased from around US$ 200 billion to hit about US $ 485 billion in end-March 2016 before climbing down to US $ 472 billion in end-March 2017. This has been largely driven by a rapid rise in External Commercial borrowings (ECBs) by Indian firms. Also, in the last one-year, monthly data show that portfolio flows to Indian capital market has been strongly dominated by debt flows. Apart from a few months, net debt inflows have been much higher than equity inflows in the present calendar year (Figure 1).


Figure 1. Foreign Portfolio flows in Debt and Equity in India, (in Rs. billions)


Source: Monthly FPI/FII Net Investments; https://www.fpi.nsdl.co.in

It is notable here that since November 2016, Indian currency has appreciated vis-à-vis US dollar and this has happened despite a widening current account deficit (Figure 2) and weak and intermittent inflows of foreign portfolio capital in the Indian equity markets. Though it is possible that the rupee appreciation has happened due to global weakness of dollar, it can also be hypothesized that increased capital flows to India has contributed to the appreciation of rupee during this period. A validation of this conjecture comes from data on foreign exchange reserves released by the Reserve Bank of India which that India’s foreign exchange reserve rose from US$ 288 billion in end-March 2016 to US$ 398 billion in end-October 2017[2].  As it is evident from figure 1, private capital flows in the equity market has been subdued during this period, and current account balance has been consistently negative (Figure 2). Therefore, it is foreign direct investment or increased inflow in the debt market which are helping in pushing the rupee up.

Figure 2. India’s Current Account Deficit

Source: Reserve Bank of India (RBI)

Against this backdrop, this article looks at the external commercial borrowing by Indian firms in more detail and tries to find out some of the implications of this surge in external debt in this India. It is important to look at this issue because mounting debt in developing countries has become a major concern for the stability of the global financial system. International Monetary Fund (IMF) has repeatedly pointed out that growing global debt poses the greatest risk to global financial markets in medium term.

  1. Debt flows to Developing Countries after the Financial Crisis

This general rise in debt flows to developing countries can be attributed to the post financial-crisis global economic scenario. One of the policy response to the financial crisis of 2008 has been a slew of accommodative and unconventional monetary policy regimes, including policies like Quantitative Easing (QE) or “large-scale asset purchases” by central banks. These policies increased liquidity in the system and pushed interest rates down to historically low levels in these countries (Figure 3).Domestic policy targets of these monetary policies were largely effective, and they managed to impose some control in the developed markets on the financial turmoil associated with the crisis. However, their global fallout has been quite significant. Increased liquidity and low interest rates in developed countries resulted in excess liquidity which is now crisscrossing national borders chasing higher returns in many countries.


Figure 3. Yield of 91 days Treasury Bond (India) and 3-month LIBOR (in percent)

Source: RBI and Federal Reserve Bank of St. Louis

Relatively higher nominal interest rates and better growth performance of developing countries attracted increased capital flows since 2010. This has pushed up asset prices in many countries of these regions. Easy global liquidity has led to massive commercial and household credit growth in developing countries (IMF 2017)[3]. It is also being argued that post-financial crisis, there has been an increase in propensity to save among developed country consumers. Along with influx of more thrifty Asians in the global economic system, this increased propensity to save in many developed countries is also adding to the pool of global liquidity. As mentioned before, a major share of this increase in commercial debt has gone to China. Bloomberg Intelligence estimates that in China total borrowing climbed to about 260 percent of the economy’s size by the end of 2016, up from 162 percent in 2008. It is estimated that borrowing in China will hit close to 320 percent of GDP by 2021[4].This rapid rise in debt levels have prompted the People’s Bank of China Governor Zhou Xiaochuan to warn about the emergence of possible ‘Minsky moments’ in global financial architecture[5]. Famous US economist Hyman Minsky warned that too much optimism and favourable conditions in financial markets may lead to excessive risk taking by economic agents which may eventually lead to a financial crisis. A ‘Minsky moment’ in China may trigger a significant wave of financial panic across the world. Other economists have also warned about possible repayment problems once central banks in developed countries start shifting towards tighter monetary policy which may lead to higher interest rates in these countries and stronger currencies.

  • India and External Commercial Borrowing

India is experiencing debt flows through three major channels. As mentioned before, foreign portfolio investors are investing heavily in Indian debt markets. Indian corporates are raising money from international capital markets through external commercial borrowings (ECBs) and the newly introduced rupee-denominated bonds (the so-called ‘masala bonds’) are bringing in more debt flows to the country. Among these different routes through which external debt is being accumulated, the most important has been the External Commercial Borrowings. ECBs has seen a sharp rise during the post-crisis period. At end March 2006, India’s ECB stock was US$ 26.45 billion, it reached US$ 62 billion at the end of the fiscal year 2008 and by March 2015 the ECB stock crossed US$ 180 billion. Since then it has declined to about US$ 173 billion at the end of the fiscal year 2017 (End-March).  According to latest available data (end March 2017), ECBs account for about 36.7 percent of India’s total external debt. Since 2015, India has also allowed issuance of rupee denominated bonds (RDBs) by the corporate sector. The major advantage of RDBs is that the issuer does not bear any currency risk and it is borne completely by the subscriber of the bond. RBI data show that so far 44 Indian firms have raised close to US$ 5.5 billion through RDBs[6]. Taking a cue from Japanese ‘Sushi bonds’, which are fundamentally similar in nature, RDBs are also popularly known as the ‘Masala Bonds’. Recently RBI has imposed some additional guidelines on RDBs. In a June 2017 guideline, RBI has imposed rules capping the maturity limit of bonds less than USD 50 million to three years and bonds above USD 50 million for five years. There is an apprehension that this new rule may restrict the growth of the Masala bond market to a large extent.

On comparing the foreign inflow of funds generated through debt oriented foreign portfolio flows vis-à-vis commercial borrowings, Figure 4 shows that ECBs have become the most dominant avenue of inflow of foreign debt to India.

Figure 4. Composition of inflow of debt to India from January 2007 to July 2017

Source: Reserve Bank of India and NSDL website

This rapid growth of ECBs has happened in a period when domestic credit growth from banks has been slowing down. In fact, in 2016-17, domestic bank credit growth has touched 5.08 percent, which is the lowest growth rate achieved in the last 60 years[7]. It can be argued that development of alternative sources of finance like the bond market and external commercial borrowings has reduced dependence of the Indian corporate sector on banks for raising money, it must be kept in mind that ECBs come with higher level of risk compared to domestic borrowing. ECBs are denominated in foreign exchange and the borrowers bear the dual risk arising out of movements in foreign exchanges and interest rates. Any shock administered through an external economic event like a hike in the Fed rates, can create a dual impact on the borrowing firms through interest rate and exchange rate effect. As long as international interest rates are low, servicing of ECBs may not pose much challenge for Indian firms. However, there seems to be some early signs of hardening of monetary policy in developed countries. If international interest rates go up, it will increase the debt burden in rupee terms. Also, a hardening of monetary policy by the central banks of developed countries may lead to a depreciation of the Indian currency. This may put additional pressure on servicing of external commercial borrowing. For companies involved in exports, net export earnings in foreign currency can act as a natural hedge against exchange rate movements. But India’s performance on that front also has not been remarkable in the recent past. Earnings and profitability numbers of the Indian corporate sector are not looking up[8]. Increased competition in some of the sectors have reported to have created payment problems on some international borrowings[9].

Reserve Bank of India publishes monthly company level data on ECBs. These data show how stated purpose of ECBs has changed over the years. On examining the end use of ECBs it is found that over the years it has undergone a significant transformation. Traditionally ECBs were taken for funding projects goods, capital expenditures in foreign currencies and some refinancing. In addition, companies used to borrow abroad for meeting miscellaneous needs such as buybacks of foreign currency Convertible bonds (FCCBs), budget financing, leasing and hiring, operating expense, leasing and hiring purchase as well as financial lease. However, of late (2017) refinancing of loans has turned out to be the most popular reasons for taking ECBs by firms. After refinancing, on-lending is the next most popular reason for firms to opt for ECBs (Figure 5). This trend of using less ECBs for Capital Expenditure and Project financing is visible for the last few years. The focus of ECBs seems to have shifted towards refinancing and on-lending in the last few years.

Table 1. Changing purpose of ECBs as stated by borrowing companies

Purpose 2010 2017
REFINANCING 8.27 35.27
ON-LENDING 3.06 28.86
CAPEX 60.28 16.23
OTHER* 6.42 9.24
PROJECT 21.95 8.51
WORKING CAPITAL 0.02 1.88

Source: Compiled from Reserve Bank of India


Notes:* ‘Other’ include: general corporate purpose, microfinance, port, road, telecommunication, urban infrastructure, infrastructure development, rupee expenditure, power, development, construction, cold storage and cold room facility

This changing utilization pattern has raised a few questions. Table 1 clearly shows that in ECBs are not used primarily for capacity creation in the Indian economy. This is not surprising as capital utilization in the Indian economy is down to around 72 percent and private sector investment has been low[10]. Easy availability of foreign debt coupled with lack of avenues of productive domestic investment may have prompted firms to use these resources for financialization and arbitrage. It is possible that the difference in nominal interest rate between India and the developed world is triggering inflows of ECBs in India. This inflow, thereby, is gradually approximating the pattern of carry trade. A paper by Acharya and Vij (2017) has investigated this matter and has concluded that ‘carry-trade’ explain the rise in foreign currency borrowing by Indian firms more that firm-level characteristics. If this is indeed the case, then any movements of domestic and foreign interest rates may trigger changes in this flow. Possible triggers may include a much-demanded interest rate cut in India or a tightening of interest rates in developed countries.

  1. Concluding Observations

A prolonged period of low interest rates has created a massive global burden of debt. According a CNBC report quoting the Bank for International Settlements, global corporate and household debt reached 138 percent as a share of GDP in 2016, compared to 115 percent in 2007, before the start of the economic downturn. The 2016 figure for advanced economies was 195 percent. Many developing countries like China and India have also taken advantage of this prolonged period of easy money to amass significant amount of external debt. The level of debt in China has reached alarming proportions and given the importance of China in the global financial system, any major problem with debt servicing in that country is likely to have a global fallout. On the other hand, the external debt-GDP burden has been far more modest for India. In case of India, the external debt to GDP ratio has stayed below the 25 percent mark. This level of external debt is manageable and is unlikely to create any major macroeconomic panic in the system. But as monetary tightening is gradually being introduced in developed markets, rising indebtedness and increase in market risk do pose some threat for India. This threat is likely to be more firm-specific. The problem may have its roots in the way ECBs are being used by the Indian corporate sector. Changing usage pattern shows that ECBs are used for financialization rather than real capacity creation. Moreover, performance indicators of the corporate sector have not been very encouraging in the recent past. Earning and profitability numbers have been modest, exports have not shown any major improvement over the past few years, and some of the key sectors like real estate, Information and Communication Technology (ICT) and Pharmaceuticals are going through difficult times. Many of these sectors have fairly high external borrowings. If a shock arises, some firms in these sectors may face problems in managing the dual burden of interest rate and exchange adjustments. While on a macro level, India does not seem to be facing a real ‘Minsky moment’ in near future, some firms in the more difficult sectors may face challenges in financing and repaying their external debt.

********

[1]http://in.reuters.com/article/us-global-debt-iif/worldwide-debt-more-than-triple-economic-output-as-central-bank-shift-looms-idINKBN1CU1V9

[2] Weekly Statistical Supplement, Reserve Bank of India, dated November 03 2017, available at:  https://rbidocs.rbi.org.in/rdocs/Wss/PDFs/2T_03111706F9ED53B3EA43E78AE8A5A64287FD27.PDF

[3]Global Financial Stability Report October 2017: Is Growth at Risk? October 2017, IMF.

[4]‘Global economy health at stake as China tries to hold sneeze’, Economic Times, October 30, 2017, available at:

https://economictimes.indiatimes.com/news/international/world-news/global-economy-health-at-stake-as-china-tries-to-hold-sneeze/articleshow/61333440.cms

[5]Zhou Warns China Should Defend Against Threat of ‘Minsky Moment’ Bloomberg News, October 19, 2017, available at: https://www.bloomberg.com/news/articles/2017-10-19/zhou-warns-china-should-defend-against-threat-of-minsky-moment

[6] Author’s calculations , compiled based on monthly data available on External Commercial Borrowings on RBI website

[7]‘Credit growth plunges to over 60-year low of 5.1% in FY17’ April 16, 2017, Hindu Business line, available at http://www.thehindubusinessline.com/money-and-banking/credit-growth-plunges-to-over-60year-low-of-5-in-fy17/article9642151.ece

[8] Financial Express says: ‘The July-September earnings of India Inc. continue to be disappointing with the net profit of a sample of 1,296 companies (excluding banks, financials and oil marketing companies) declining by 1.41% compared with the same period last year. A sharp rise in expenditure at 8.28% squeezed operating margins, which also declined 13.38 basis points. Weak order inflows saw domestic revenues of industrial and infrastructure companies decline sharply during the period, which reflects a slowdown in execution, which in turn reflects working capital challenges in the entire value chain due to disruption from the goods and services tax (GST) roll-out.’ See http://www.financialexpress.com/industry/india-inc-quarterly-returns-festive-season-cheer-bypasses-corporates-as-costs-jump-margins-get-squeezed-auto-sector-bucks-trend/934731/

[9]‘Anil Ambani group stocks plunge by up to 12%’November 16, 2017, The Indian Express, available at: http://indianexpress.com/article/business/market/anil-ambani-group-stocks-plunge-by-up-to-12-4939272/

[10] See ‘India’s market rally running on empty’ by Henny Sender, Financial Times, November 16 2017, available at: https://www.ft.com/content/5ef9775a-ca9a-11e7-aa33-c63fdc9b8c6c